
Abstract
This paper presents a comprehensive study on electromagnetic radiation (EMR) levels within electric vehicles (EVs) during acceleration, comparing them with stationary and charging states. Using empirical data from nine electric vehicle models across various frequency bands (10–200 Hz), the research analyzes EMR distribution at different body positions (head, chest, feet) and discusses implications for safety standards. The findings highlight that acceleration states exhibit higher EMR levels, with distinct patterns across body 部位,underscoring the need for targeted protective measures.
1. Introduction
The rapid proliferation of electric vehicles (EVs) has sparked growing public concern about electromagnetic radiation (EMR) exposure among occupants. As governments worldwide promote electric vehicle adoption, understanding their electromagnetic environment becomes critical for safety regulation. Unlike traditional internal combustion engine vehicles, electric vehicles rely on high-power electric drivetrains, which may generate unique EMR profiles, particularly during dynamic operations like acceleration.
This study aims to characterize EMR levels in electric vehicles under three operational states—stationary, charging, and accelerating—with a focus on identifying frequency-specific and position-specific radiation patterns. By measuring low-frequency electric and magnetic fields (10–200 Hz), we provide empirical data to inform safety guidelines and vehicle design.
2. Health Implications of Electromagnetic Radiation
Prolonged exposure to excessive EMR has been linked to potential health risks, including disruptions to the reproductive, nervous, and immune systems . Studies suggest cumulative effects of EMR exposure may contribute to cardiovascular diseases, genetic mutations, and adverse pregnancy outcomes . While global research confirms that EV-generated EMR generally falls within safe limits , localized peaks during specific operations (e.g., acceleration) warrant detailed investigation.
The International Commission on Non-Ionizing Radiation Protection (ICNIRP) and IEEE standards emphasize the need for frequency-dependent exposure limits. In China, the Electromagnetic Environment Control Limits (GB8702–2014) sets strict thresholds for public exposure, including 4000 V/m for electric fields and 0.1 μT for magnetic fields in the low-frequency range .
3. Sources of Electromagnetic Radiation in Electric Vehicles
Electric vehicles generate EMR through multiple subsystems, primarily:
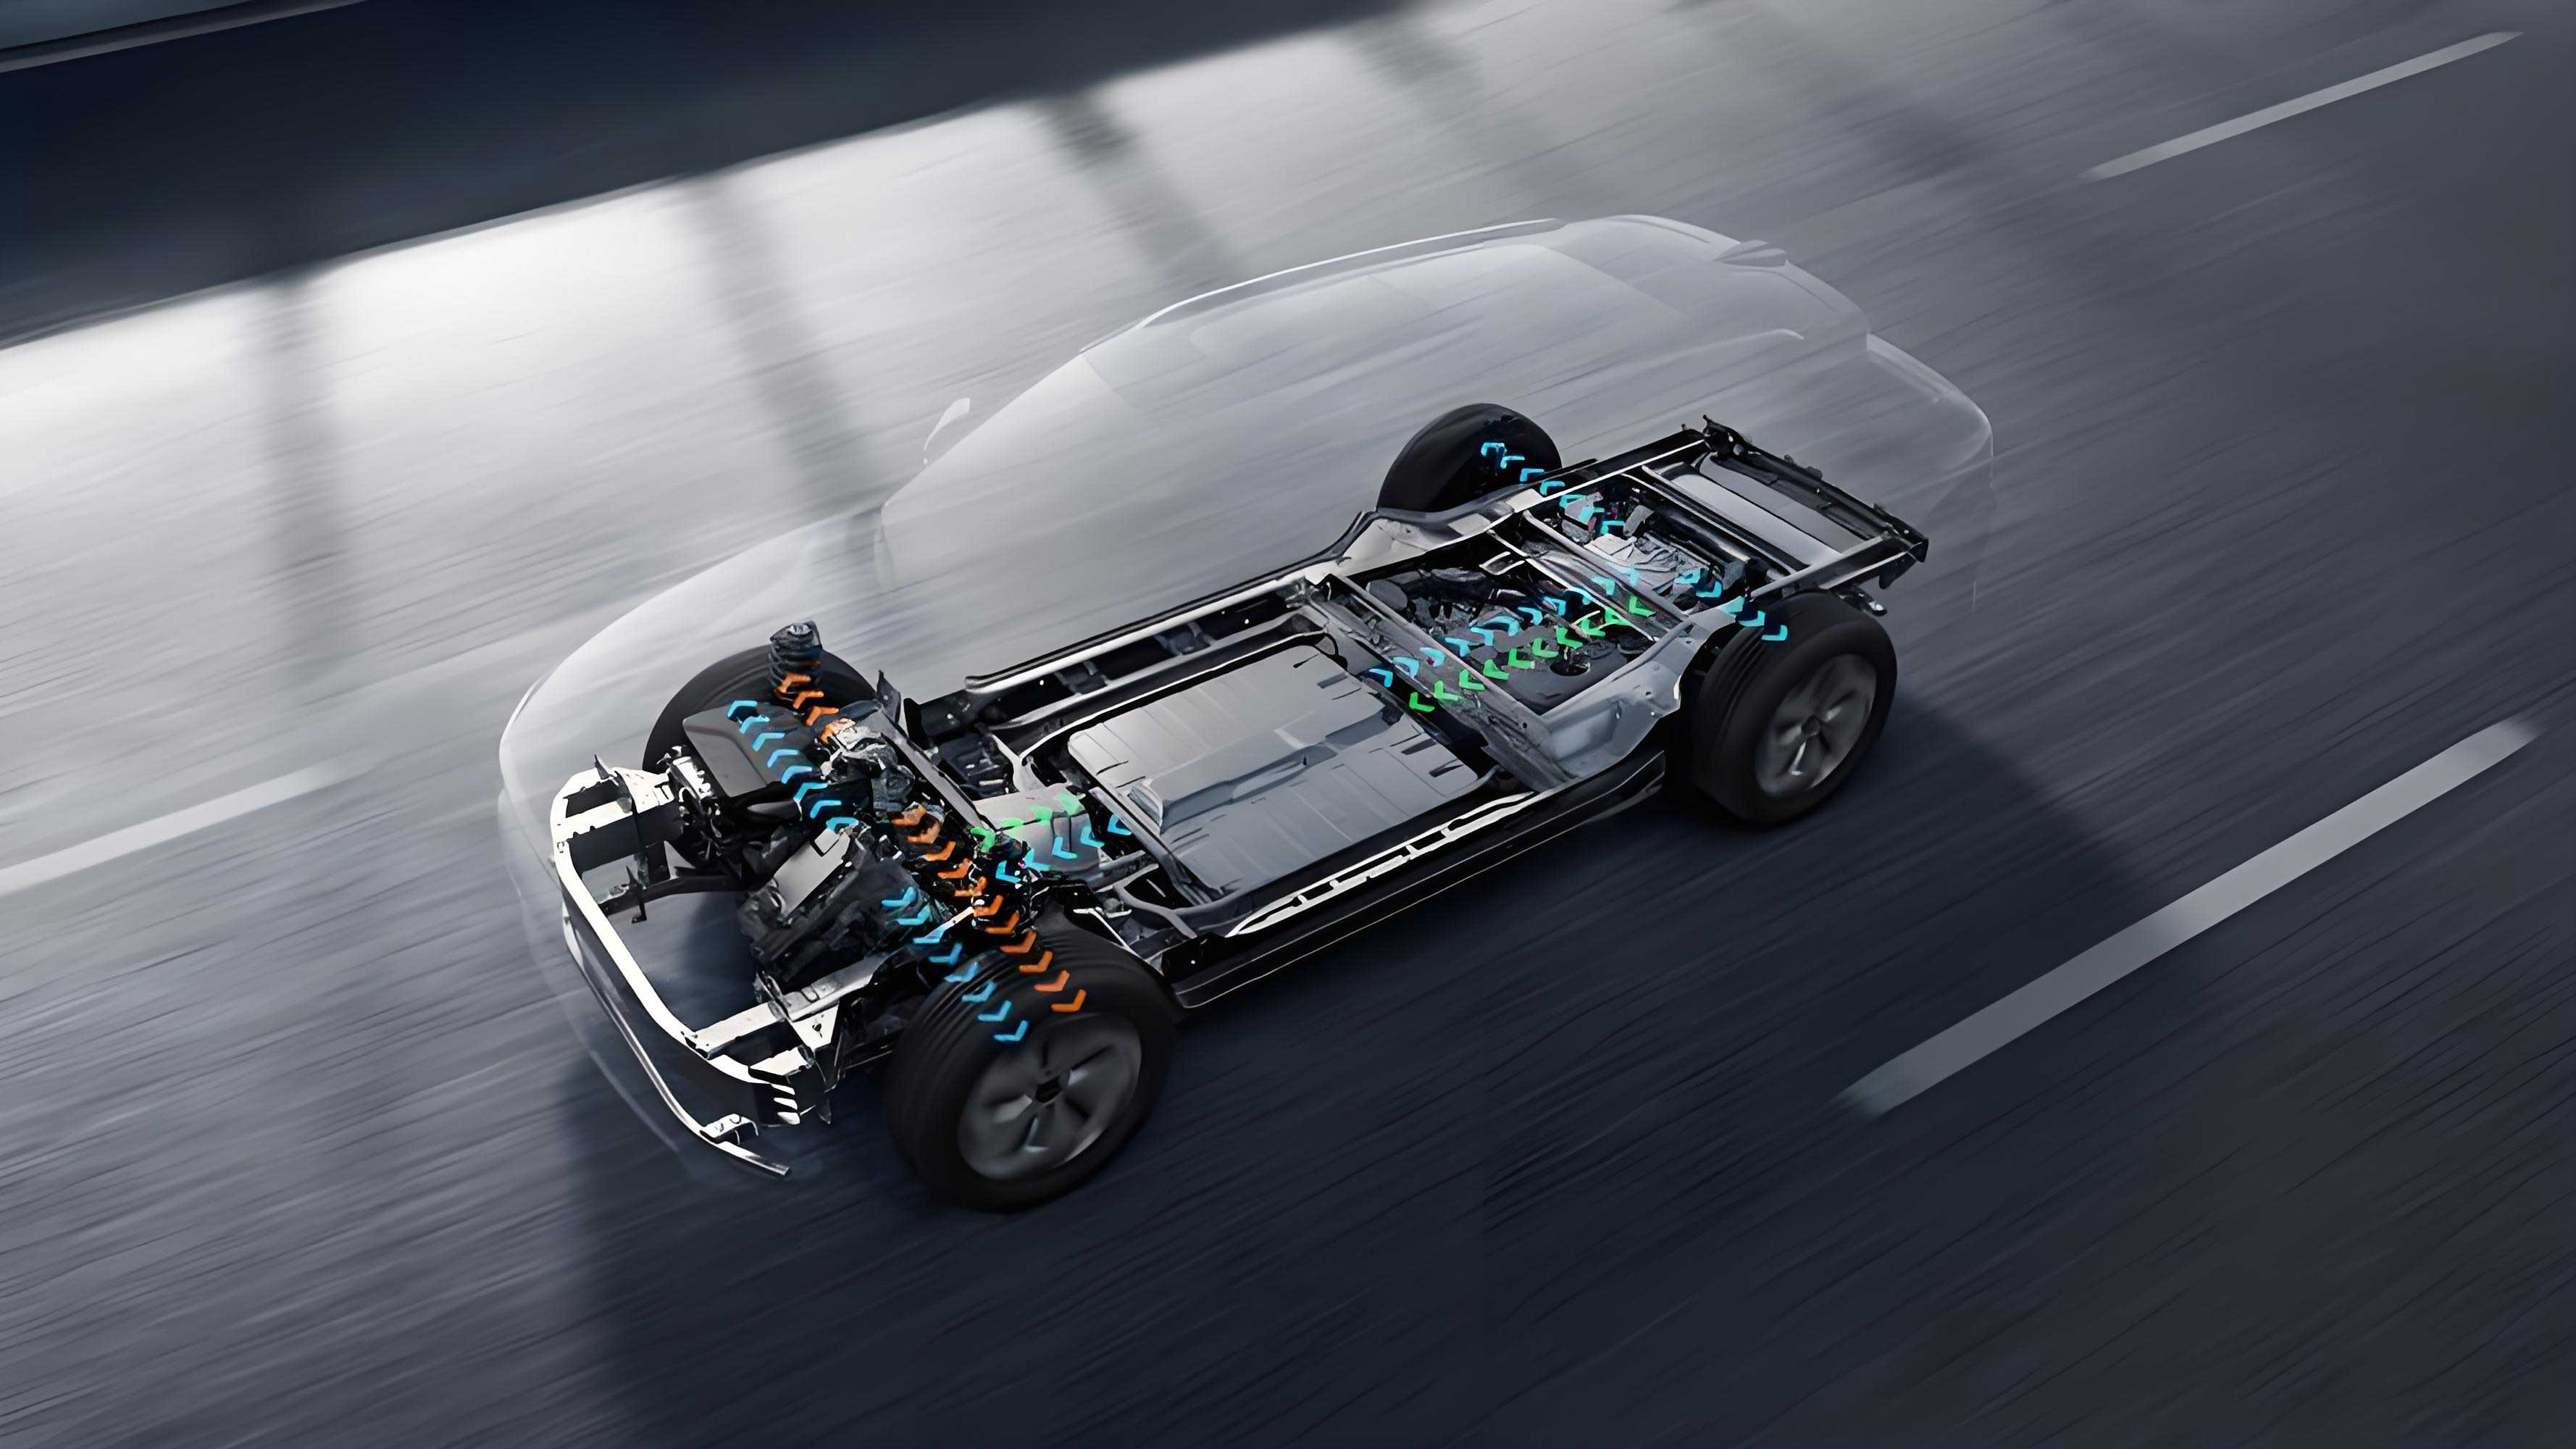
3.1 Electric Drivetrain System
The drivetrain, comprising high-voltage batteries, DC-AC inverters, and permanent magnet synchronous motors, is a major EMR source. Inverters using pulse-width modulation (PWM) create rapid voltage/current fluctuations, emitting broadband EMR .
3.2 Battery Management System (BMS)
BMS operations, including charge/discharge control and state monitoring, induce low-level electromagnetic emissions .
3.3 Electronic Control Systems
DC motors (e.g., for fans, heaters) and switching components (relays, control boards) produce pulsed EMR during operation .
Table 1: Primary EMR Sources in Electric Vehicles
| Component | Radiation Type | Frequency Range | Mechanism |
|---|---|---|---|
| DC-AC Inverter | Electric/Magnetic | 10–200 Hz | PWM-induced voltage transients |
| Permanent Magnet Motor | Magnetic | 50–150 Hz | Rotational magnetic fields |
| High-Voltage Cables | Electric | 20–100 Hz | Capacitive coupling |
| BMS Electronics | Both | <50 Hz | Low-frequency switching |
4. Monitoring Methodology
4.1 Standards and Instruments
Measurements followed GB/T 37130–2018 (Vehicle Electromagnetic Field Measurement Methods for Human Exposure) and GB8702–2014, using the EHP50F low-frequency electromagnetic monitor (1 Hz–400 kHz range) . The device recorded root-mean-square (RMS) values for electric field strength (E, V/m) and magnetic induction intensity (B, μT), with spectral scans logged at 1-minute intervals.
4.2 Test Conditions
- States: Stationary (powered on, accessories active), charging (connected to a Level 2 charger), and accelerating (0–60 km/h, steady acceleration).
- Frequency Band: 10–200 Hz, focusing on low-frequency emissions dominant in electric vehicle drivetrains.
- Measurement Points: Four passenger positions (driver, front passenger, rear left, rear right) at head (1.5 m), chest (1.0 m), and foot (0.2 m) heights .
4.3 Vehicle Selection
Nine electric vehicle models were tested, representing diverse powertrain configurations (Table 2):
- Drive Types: Rear-wheel drive (RWD), front-wheel drive (FWD), all-wheel drive (AWD).
- Vehicle Classes: Sedan, SUV, MPV.
- Power Output: 100–220 kW.
Table 2: Tested Electric Vehicle Models and Specifications
| Model ID | Power (kW) | Drive Layout | Vehicle Type |
|---|---|---|---|
| 1 | 150 | Rear single | Sedan |
| 2 | 220 | Rear single | SUV |
| 3 | 210 | Rear single | MPV |
| 4 | 180 | Front single | Sedan |
| 5 | 137 | Rear single | SUV |
| 6 | 100 | Front single | Sedan |
| 7 | 100 | Front single | Hatchback |
| 8 | 150 | Front single | SUV |
| 9 | 180 | Dual (F+R) | SUV |
5. Data Analysis and Results
5.1 EMR Levels Across Operational States
Figure 1 (simplified) shows mean EMR values across states:
- Acceleration: Highest average E and B fields, particularly in the 20–80 Hz band.
- Charging: Elevated magnetic fields compared to stationary, likely from charger-induced currents.
- Stationary: Lowest overall emissions, dominated by accessory systems (e.g., HVAC, lights).
Table 3: State-wise EMR Averages (10–200 Hz)
| State | Electric Field (V/m) | Magnetic Field (μT) |
|---|---|---|
| Stationary | 0.8 ± 0.3 | 0.05 ± 0.02 |
| Charging | 1.2 ± 0.4 | 0.09 ± 0.03 |
| Accelerating | 2.1 ± 0.6* | 0.18 ± 0.05* |
| *Significantly higher than other states (p < 0.05). |
The acceleration-state EMR increase correlates with drivetrain activity, as inverters and motors operate at higher loads, generating stronger electromagnetic fields .
5.2 Spatial Distribution of EMR
5.2.1 Passenger Positions
No significant differences were observed between front and rear seats during acceleration (Table 4), indicating uniform EMR distribution within the cabin .
Table 4: EMR by Passenger Position (Acceleration State)
| Position | Electric Field (V/m) | Magnetic Field (μT) |
|---|---|---|
| Driver | 2.0 ± 0.5 | 0.17 ± 0.04 |
| Front Passenger | 2.1 ± 0.6 | 0.18 ± 0.05 |
| Rear Left | 1.9 ± 0.4 | 0.16 ± 0.03 |
| Rear Right | 2.2 ± 0.7 | 0.19 ± 0.06 |
5.2.2 Body 部位 Variations
- Magnetic Field: Chest > Foot > Head. The chest, positioned near the center of the vehicle, experiences stronger fields from lateral drivetrain components .
- Electric Field: Foot >> Chest ≈ Head. Proximity to under-floor motors and batteries drives higher electric fields at foot level .
Table 5: EMR by Body 部位 (Acceleration State)
| Body Part | Electric Field (V/m) | Magnetic Field (μT) |
|---|---|---|
| Head | 1.2 ± 0.3 | 0.12 ± 0.02 |
| Chest | 1.5 ± 0.4 | 0.18 ± 0.05* |
| Foot | 3.0 ± 0.8* | 0.15 ± 0.03 |
| *Significant difference from other 部位 (p < 0.05). |
5.3 Frequency-Domain Analysis
Low-frequency emissions (20–50 Hz) dominated acceleration-state EMR, aligning with motor rotational speeds and inverter switching frequencies . This 频段 corresponds to the resonant frequency of many electric vehicle drivetrain components, amplifying radiation intensity.
6. Discussion
The observed EMR patterns during acceleration highlight two key insights:
- Drivetrain Dynamics: Increased motor torque and inverter activity during acceleration enhance EMR emissions, particularly in the low-frequency range. This underscores the need for dynamic EMR testing in addition to static assessments.
- Cabin Geometry: The spatial distribution of EMR is influenced by vehicle architecture. Footwells, located above motors and batteries, exhibit higher electric fields, while chest-level magnetic fields reflect central drivetrain positioning .
While all measured values remain below GB8702–2014 limits, the relative increase during acceleration justifies targeted mitigation strategies, such as improved shielding for under-floor components and seat-based magnetic field attenuation .
7. Conclusions
- State Comparison: electric vehicles emit the highest EMR during acceleration, driven by drivetrain activity. Charging states show moderate magnetic field increases, while stationary states have minimal emissions.
- Spatial Trends: Chest and foot areas experience distinct EMR peaks, correlated with vehicle component placement.
- Safety Implications: Despite compliance with current standards, the dynamic nature of acceleration-state EMR warrants inclusion in future safety guidelines, particularly for 低频 emissions.
8. Recommendations
- Enhanced Testing Protocols: Integrate acceleration-phase EMR measurements into mandatory certification processes.
- Targeted Shielding: Develop conductive barriers for footwells and central drivetrain areas to reduce localized exposure.
- Frequency-Specific Standards: Revise guidelines to address low-frequency (20–50 Hz) EMR, which dominates electric vehicle emissions during critical operations.
By addressing these points, the electric vehicle industry can proactively mitigate EMR concerns, ensuring public confidence in sustainable transportation technologies.