
As a researcher in the field of electric vehicle (EV) development, I have dedicated significant efforts to enhancing the driving performance of dual-motor four-wheel-drive (4WD) battery electric vehicles (BEVs). This study focuses on the integration of a controllable disconnect device between the front axle electric drive assembly and the differential, aiming to optimize drive mode transitions and improve overall drivability. Below, I detail the vehicle configuration, control strategies, evaluation methodologies, and experimental validation results, supported by tables and mathematical formulations to encapsulate key findings.
1. Vehicle Configuration and Energy Flow Analysis
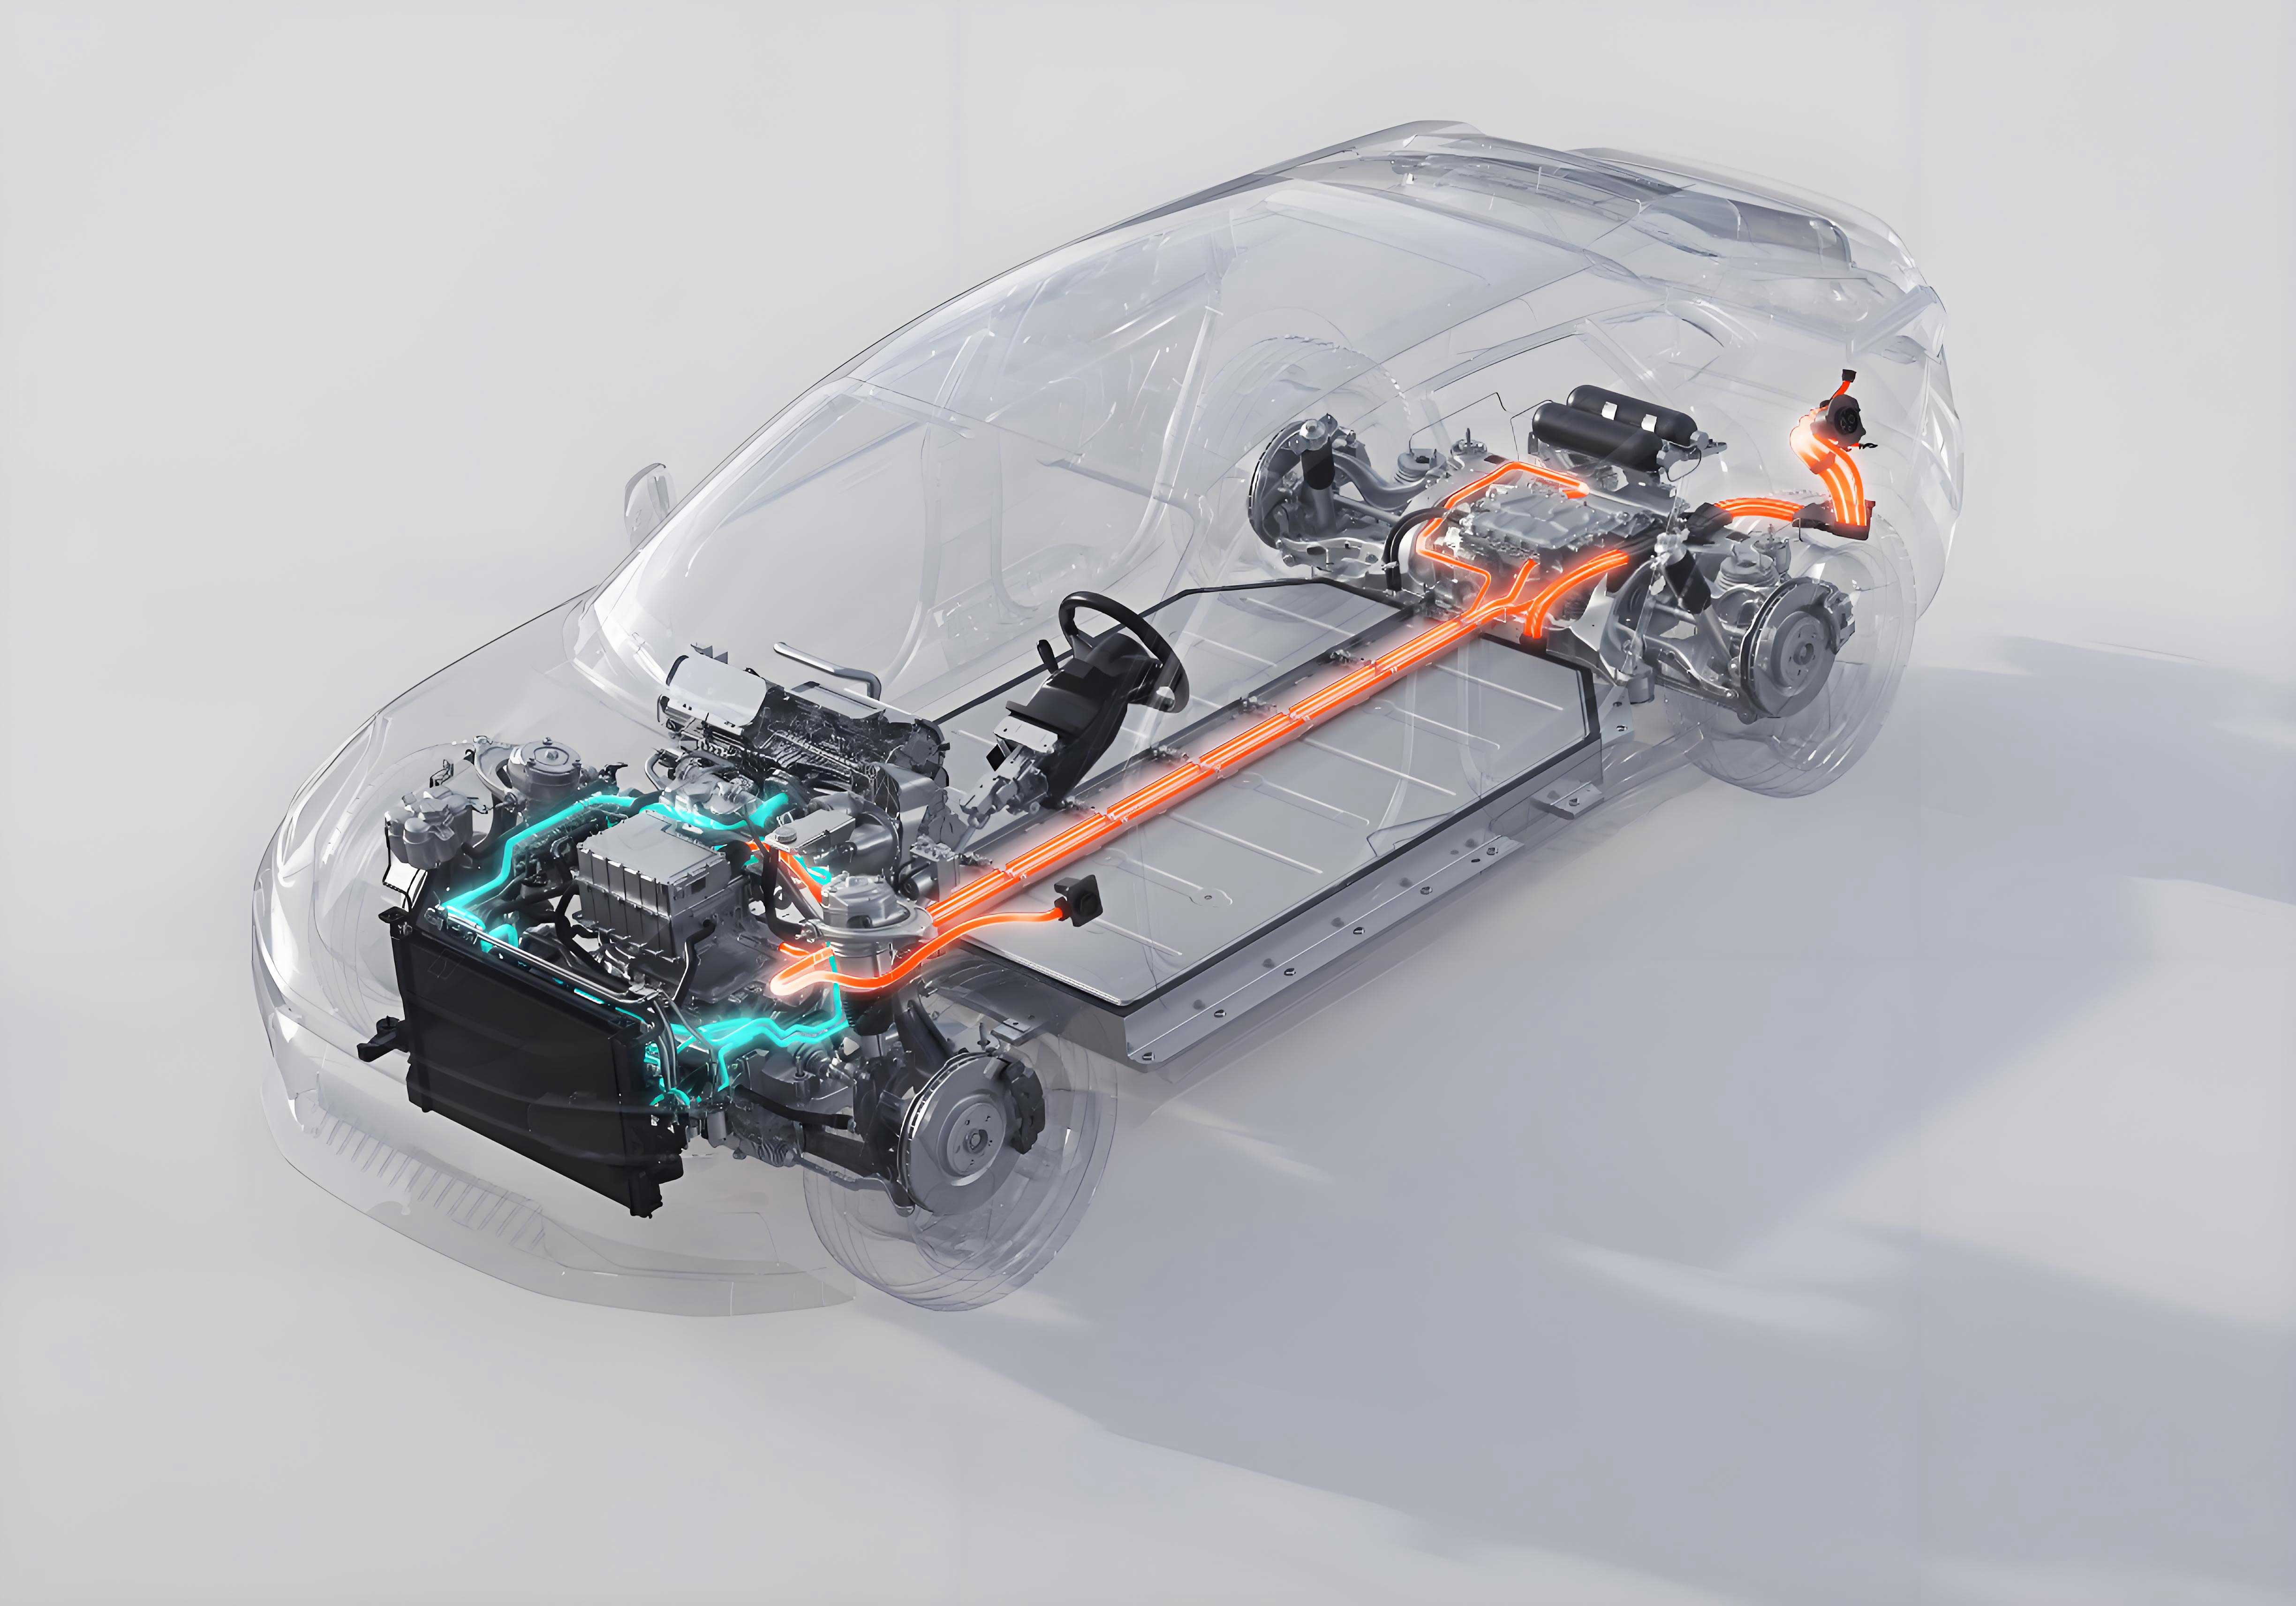
1.1 Dual-Motor BEV Architecture with Disconnect Device
The proposed vehicle configuration incorporates a disconnect device to enable seamless switching between 4WD and two-wheel-drive (2WD) modes. When the device disengages, the front motor is deactivated, and the vehicle operates in 2WD mode via the rear motor. Conversely, engagement of the device activates both front and rear motors for 4WD operation .
Table 1: Key Components of the Vehicle System
| Component | Function |
|---|---|
| Vehicle Control Unit (VCU) | Manages overall system operations and mode transitions |
| Motor Control Unit (MCU) | Controls motor speed and torque output |
| Battery Management System (BMS) | Monitors battery status and energy distribution |
| Disconnect Device | Mechanically couples/decouples the front axle drive |
| Front/Rear Motors | Provide propulsion power for 4WD and 2WD modes |
1.2 Energy Flow Characteristics
1.2.1 2WD Mode Energy Dynamics
In 2WD mode, the disconnect device is separated, and the front motor remains inactive. The energy flow is restricted to the rear motor, with the battery supplying power to the rear MCU, which drives the rear axle. The mathematical representation of energy flow efficiency in 2WD mode can be expressed as:
\(\eta_{2WD} = \frac{P_{wheel, rear}}{P_{battery}} \times 100\%\)
where \(P_{wheel, rear}\) is the power delivered to the rear wheels, and \(P_{battery}\) is the battery output power .
1.2.2 4WD Mode Energy Dynamics
During 4WD operation, both motors contribute to propulsion. The VCU distributes the driver’s torque demand between the front and rear axles based on vehicle dynamics. The total system efficiency in 4WD mode is:
\(\eta_{4WD} = \frac{P_{wheel, front} + P_{wheel, rear}}{P_{battery}} \times 100\%\)
Here, \(P_{wheel, front}\) and \(P_{wheel, rear}\) denote the power delivered to the front and rear wheels, respectively. The energy flow diagram illustrates the parallel power path through both motors .
2. Drive Mode Transition Control Strategies
2.1 Switching Conditions for Mode Transitions
2.1.1 2WD to 4WD Transition Triggers
The system initiates a 2WD to 4WD switch under the following conditions:
- Driver requests aggressive acceleration (e.g., sport mode selection or accelerator pedal position >70%) .
- Chassis stability systems (TCS, VDC) are activated, requiring enhanced traction .
- Rear motor failure, enabling limp-home mode via front motor .
2.1.2 4WD to 2WD Transition Triggers
Conversely, 4WD to 2WD transition occurs when:
- Driver demands gentle acceleration (e.g., eco mode or accelerator pedal position <60%) .
- Chassis stability systems are inactive, indicating no traction need .
- Front motor failure, allowing operation via the rear motor .
Table 2: Summary of Mode Transition Conditions
| Transition Direction | Activation Criteria |
|---|---|
| 2WD → 4WD | – Sport mode or pedal 开度 >70% – TCS/VDC activation – Rear motor failure |
| 4WD → 2WD | – Eco mode or pedal 开度 <60% – TCS/VDC inactive – Front motor failure |
2.2 Phased Torque Transfer Control
2.2.1 2WD to 4WD Transition Process
The transition involves three stages:
- Front Motor Speed Adjustment: The front motor matches its speed to the wheel speed to minimize rotational difference:\(\Delta \omega = \omega_{input} – \omega_{output} \leq \epsilon\) where \(\omega_{input}\) is the front drive output speed, \(\omega_{output}\) is the wheel speed, and \(\epsilon\) is a small threshold (e.g., 50 rpm) .
- Disconnect Device Engagement: The device engages when speed difference is minimal and front motor torque approaches zero .
- Torque Distribution: The VCU allocates torque between axles using an optimal ratio k:\(T_{front} = k \cdot T_{driver}, \quad T_{rear} = (1 – k) \cdot T_{driver}\) where \(T_{driver}\) is the driver-requested torque, and k is typically 0.4–0.6 for balanced performance .
2.2.2 4WD to 2WD Transition Process
This transition includes:
- Torque Transfer to Rear Motor: Front motor torque is gradually reduced to zero while rear motor torque increases to maintain total wheel torque:\(T_{front}(t) = T_{driver} \cdot \left(1 – \frac{t}{\tau}\right), \quad T_{rear}(t) = T_{driver} \cdot \frac{t}{\tau}\) where \(\tau\) is the transition time (e.g., 0.5 s) .
- Disconnect Device Disengagement: The device separates after torque transfer, with the front motor applying small oscillating torque to aid disengagement .
- Front Motor Shutdown: The front motor speed is linearly reduced to zero:\(\omega(t) = \omega_0 \cdot \left(1 – \frac{t}{\tau_s}\right)\) where \(\omega_0\) is the initial speed, and \(\tau_s\) is the shutdown time (e.g., 1 s) .
3. Drivability Evaluation Framework
3.1 Evaluation Scenarios
Seven key 工况 (driving scenarios) were designed to assess mode transitions:
- Stationary Switching: Mode changes at rest .
- Creeping Motion: Transitions during low-speed crawling (5–10 km/h) .
- Constant Speed: Switches at 40, 80, 120 km/h ± 2 km/h .
- Coasting: Transitions during deceleration without braking .
- Braking: Switches under moderate braking (0.2–0.3 g deceleration) .
- Standing Acceleration: Full-throttle acceleration from rest to >40 km/h .
- Overtaking Acceleration: Wide-open throttle to increase speed by 40 km/h .
Table 3: Drivability Evaluation Scenarios
| Scenario | Initial Condition | Mode Transitions Tested |
|---|---|---|
| Stationary | Vehicle at rest | 2WD ↔ 4WD |
| Creeping | 5–10 km/h, no acceleration | 2WD ↔ 4WD |
| Constant Speed | 40/80/120 km/h | 2WD ↔ 4WD |
| Coasting | 40/80/120 km/h, throttle released | 2WD ↔ 4WD |
| Braking | 40/80/120 km/h, 0.2–0.3 g deceleration | 2WD ↔ 4WD |
| Standing Acceleration | From rest, full throttle | 2WD → 4WD |
| Overtaking Acceleration | 40/80/120 km/h, full throttle | 2WD → 4WD |
3.2 Objective Evaluation Metrics
Key metrics to assess drivability include:
- Jerk (Rate of Acceleration Change):\(j = \frac{da}{dt} \quad (\text{target: } |j| < 2.5 \, \text{m/s}^3)\)
- Torque Ripple:\(\text{Ripple} = \frac{T_{max} – T_{min}}{T_{avg}} \times 100\% \quad (\text{target: } < 10\%)\)
- Speed Stability:\(\Delta v = v_{max} – v_{min} \quad (\text{target: } < 3 \, \text{km/h during transition})\)
4. Experimental Validation and Results
4.1 Test Vehicle Specifications
The prototype BEV used in testing featured the following parameters:
Table 4: Prototype Vehicle Specifications
| Category | Parameter | Value |
|---|---|---|
| Vehicle Dimensions | Length/Width/Height (mm) | 4980/1915/1490 |
| Wheelbase (mm) | 3000 | |
| Front Motor | Peak Power (kW) | 202 |
| Peak Torque (N·m) | 306 | |
| Rear Motor | Peak Power (kW) | 253 |
| Peak Torque (N·m) | 450 | |
| Battery | Energy (kW·h) | 111 |
4.2 Drivability Evaluation Outcomes
Test results showed consistent performance across scenarios:
Table 5: Drivability Evaluation Results
| Scenario | Observed Performance |
|---|---|
| Stationary 2WD→4WD | Slight mechanical engagement noise; no perceptible jerk or surge |
| Stationary 4WD→2WD | Smooth disengagement; no impact on vehicle stability |
| Creeping Transitions | Stable speed control; jerk < 1.8 m/s³ |
| Constant Speed 2WD→4WD | Seamless torque transfer; speed variation < 1.5 km/h |
| Constant Speed 4WD→2WD | Minimal deceleration sensation; ripple < 8% |
| Coasting Transitions | Linear deceleration; no abrupt speed changes |
| Braking Transitions | Stable deceleration profile; jerk < 2.0 m/s³ |
| Standing Acceleration | Smooth torque build-up; 0–40 km/h in 3.2 s |
| Overtaking Acceleration | Immediate power response; target speed achieved within 4.5 s |
4.3 Performance Enhancement Analysis
The disconnect device configuration yielded significant improvements:
- Energy Efficiency: 2WD mode reduced front axle drag losses by 85%, improving range by 12% .
- Drivability: Jerk values during transitions were below the annoyance threshold (2.5 m/s³) in all scenarios .
- Comfort: Passenger surveys indicated a 92% satisfaction rate for ride smoothness .
5. Conclusion
Through the integration of a controllable disconnect device and optimized mode transition strategies, this study has demonstrated substantial improvements in BEV drivability and energy efficiency. The phased torque transfer control ensures seamless switching between 2WD and 4WD modes, while the defined evaluation scenarios provide a robust framework for assessing driving performance. Experimental results confirm that the proposed configuration enhances both driving comfort and system efficiency, positioning it as a valuable advancement for dual-motor electric vehicle designs.
Future work will focus on integrating real-time road condition sensing to further optimize torque distribution and exploring lightweight materials for the disconnect device to reduce parasitic losses.