
1. Introduction
The pure electric vehicle (EV) has emerged as a pivotal solution for global automotive sustainability, driven by its zero-emission capability, simplified structure, and low noise profile . However, the development of EVs is constrained by the trade-offs among driving range, energy economy, and dynamic performance. Specifically, the energy density limitations of lithium-ion batteries and the parasitic energy consumption of thermal management systems pose significant challenges to break through the driving range bottleneck .
To address these challenges, this study focuses on the parameter matching and optimization of EV powertrain systems. The research aims to integrate system simulation with intelligent algorithms to achieve a synergistic improvement in EV performance. By leveraging AVL CRUISE, a leading vehicle simulation software, we established a multi-dimensional parametric model encompassing motor characteristics, battery discharge behavior, and transmission efficiency .
2. Powertrain System Configuration of the Electric Vehicle
2.1 Vehicle Structure and Basic Parameters
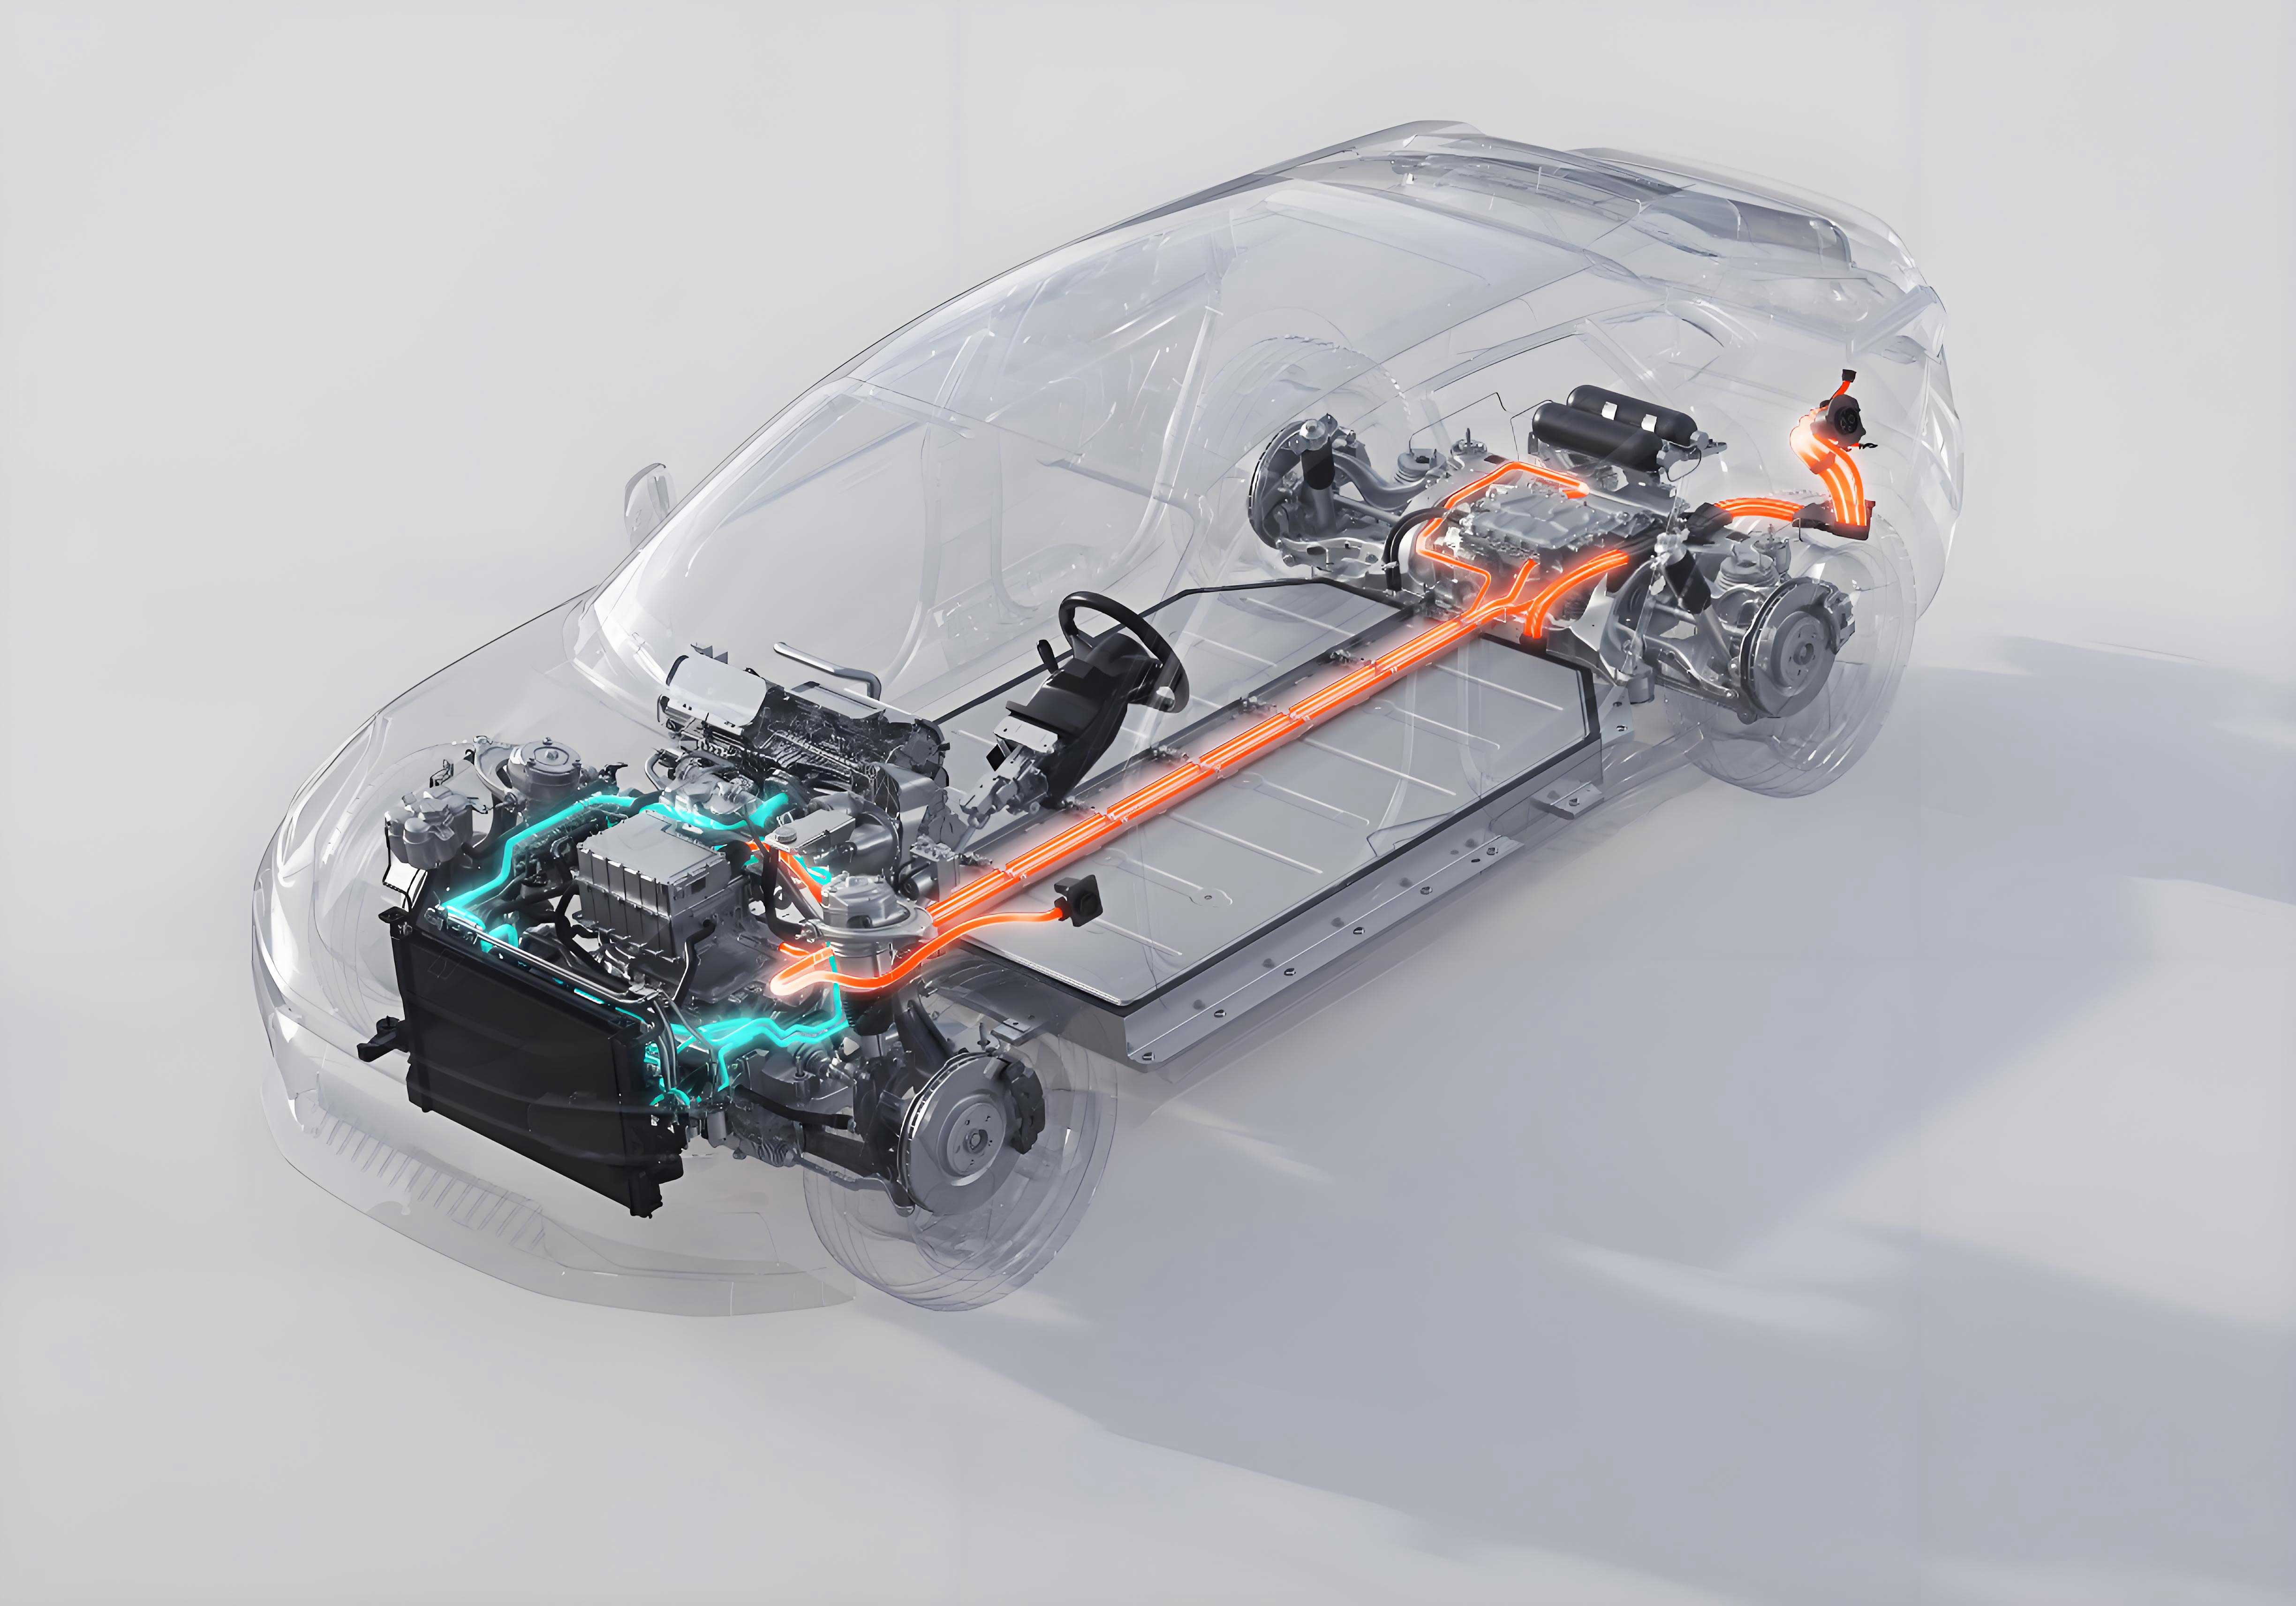
The EV powertrain analyzed in this study comprises a drive motor, power battery, transmission system, and control system. The powertrain layout is designed to optimize space utilization, enhancing vehicle mobility . The key technical parameters of the EV are summarized in Table 1.
Table 1. Basic Performance Parameters of the Electric Vehicle
| Technical Parameter | Value |
|---|---|
| Vehicle Dimensions (L×W×H, mm) | 4680×1850×1550 |
| Wheelbase (mm) | 2870 |
| Curb Mass (kg) | 1480 |
| Maximum Load Mass (kg) | 500 |
| Distance from Centroid to Front Axle (mm) | 1300 |
| Rotational Inertia Conversion Coefficient | 1.04 |
| Frontal Area (m²) | 2.45 |
| Drag Coefficient | 0.28 |
| Tire Rolling Radius (m) | 0.319 |
| Transmission Mechanical Efficiency | 0.96 |
2.2 Performance Metrics
The target performance indicators for the EV are as follows:
- Maximum speed ≥ 160 km/h
- 0-100 km/h acceleration time ≤ 11 s
- NEDC driving range ≥ 350 km
- Maximum gradeability ≥ 20%
3. Key Parameter Matching for the Electric Vehicle
3.1 Determination of Drive Motor Power
The selection of drive motor power is based on three critical performance metrics: maximum speed, gradeability, and acceleration capability. The power required for each metric is calculated as follows:
- Power for Maximum Speed:Pmax1≥ηT1(3600mgfvmax+76140CDAvmax3)
where Pmax1 is the drive motor power, CD is the drag coefficient, m is the vehicle mass, f is the rolling resistance coefficient (0.013), g is the gravitational acceleration, ηT is the transmission efficiency, and vmax is the maximum speed. This calculation yields Pmax1≥50kW . - Power for Gradeability:Pmax2≥ηT1(3600mgfcosαmaxvi+76140CDAvi3+3600mgsinαmaxvi)
where αmax is the maximum grade angle, and vi is the constant speed during climbing (20 km/h). This gives Pmax2≥40kW . - Power for Acceleration:Pmax3≥3600ηTvf(δmdtdu+mgf+21.15CDAvf2)
where vf is the target acceleration speed, du/dt is the acceleration, and δ is the rotational mass conversion coefficient. The result is Pmax3≥83kW .
The motor’s peak power Pemax is determined as the maximum of these values:Pemax≥max(Pmax1,Pmax2,Pmax3)
After comprehensive analysis, Pemax=90kW and rated power Pe=40kW were selected, with an overload coefficient λ=2.25 .
3.2 Motor Speed and Torque Determination
The motor’s peak speed is chosen as 8500 r/min, a medium-speed permanent magnet synchronous motor, to balance performance, cost, and operational conditions . The relationship between the rated speed ne and peak speed nmax is defined by:β=nenmax
where β is the constant power region expansion coefficient .
The motor torque is calculated using:
- Rated torque:Te=ne9550Pe
- Peak torque:Tmax=ne9550Pmax
This results in a peak torque of 320 N·m and a rated torque of 142 N·m .
3.3 Transmission Ratio Matching
The transmission ratio of the single-stage main reducer is determined based on dynamic performance and ground adhesion constraints:
- Minimum Transmission Ratio:
- Upper limit based on maximum speed:imin≤vmax0.377nmaxr
- Lower limit based on driving resistance:imin≥TvmaxηT(mgf+CDAvmax2/21.15)r
The range for imin is 4.2 to 7.5 .
- Maximum Transmission Ratio:
- Lower limit based on gradeability:imax≥TmaxηT(mgfcosαmax+CDAvi2/21.15+mgsinαmax)r
- Upper limit based on ground adhesion:imax≤TmaxLηTmgrLbφ
The range for imax is 5.8 to 7.3 .
综合 (Comprehensively), the transmission ratio is set to 6.0 .
3.4 Battery Pack Selection
Lithium iron phosphate (LiFePO₄) batteries are chosen for their high specific power, energy density, and cycle life . The battery pack design involves:
- Energy Requirement for Driving Range:Wl=Pt=3600ηtVα(mgf+21.15CDAVα2)(VαS)
where Vα is the constant speed, and S is the driving range. - Battery Capacity Requirement:EB≥DOD⋅ηmc⋅ηdisWl
where DOD (depth of discharge) is 0.85, ηmc (motor efficiency) is 0.92, and ηdis (discharge efficiency) is 0.9. This gives EB≥54kWh .
The final battery configuration is 7 parallel groups, each with 125 series-connected cells, totaling 875 cells, with single-cell capacity of 20 Ah and voltage of 3.2 V .
3.5 Summary of Parameter Matching Results
The key powertrain parameters after matching are listed in Table 2.
Table 2. Powertrain System Parameter Matching Results
| Category | Parameter | Value |
|---|---|---|
| Drive Motor | Rated Power (kW) | 40 |
| Peak Power (kW) | 90 | |
| Rated Torque (N·m) | 142 | |
| Peak Torque (N·m) | 320 | |
| Peak Speed (r/min) | 8500 | |
| Transmission | Main Reduction Ratio | 6.0 |
| Battery | Single-cell Capacity (Ah) | 20 |
| Number of Single Cells | 125 (per group) | |
| Single-cell Voltage (V) | 3.2 |
4. Overall Modeling and Simulation of the Electric Vehicle
4.1 Model Construction Using AVL CRUISE
The EV model was built in AVL CRUISE to validate dynamic and economic performance under the NEDC cycle. The simulation model integrates vehicle parameters and powertrain configurations, enabling comprehensive performance analysis .
4.2 Dynamic Performance Analysis
- Maximum Speed:
Simulation results show the EV achieves a maximum speed of 173.66 km/h, exceeding the target of 160 km/h . - Acceleration Time:
The 0-100 km/h acceleration time is 10.93 s, meeting the design requirement of ≤ 11 s . - Gradeability:
At 20 km/h, the EV can climb a 30.67% gradient, surpassing the 20% target . - Driving Range:
The NEDC driving range is 357.3 km, with a 百公里电耗 (100-km energy consumption) of 12.31 kWh, meeting the range requirement of ≥ 350 km .
4.3 Simulation Results Summary
Table 3 compares the simulated performance metrics against the design targets.
Table 3. Comparison of Simulation Results and Design Targets
| Parameter | Design Target | Simulated Value | Meeting Target |
|---|---|---|---|
| Maximum Speed (km/h) | 160 | 173.66 | Yes |
| 0-100 km/h Acceleration Time (s) | 11 | 10.93 | Yes |
| Maximum Gradeability (%) | 20 | 30.67 | Yes |
| NEDC Driving Range (km) | 350 | 357.3 | Yes |
5. Powertrain System Performance Optimization
5.1 Multi-Objective Genetic Algorithm (NSGA-II)
The Non-dominated Sorting Genetic Algorithm II (NSGA-II) is employed for optimization, leveraging its efficiency in handling multi-objective problems. The algorithm features fast non-dominated sorting and elite preservation, enhancing convergence and solution diversity .
The optimization mathematical model is defined as:F(x)=min{F1(x),F2(x),…,Fn(x)}
with constraints:Gi(x)≤0,Hj(x)=0
where x is the decision vector, Gi(x) are inequality constraints, and Hj(x) are equality constraints .
5.2 Optimization Variables and Objectives
- Optimization Variables:
- Motor peak power Pmax
- Main reduction ratio i
- Battery capacity C
- Objective Functions:
- Dynamic objectives: acceleration time, gradeability, maximum speed
- Economic objective: energy consumption
The multi-objective function is:f(x)=ω1tef1(x)+ω2f2(x)+ω3vef3(x)+ω4f4(x)
where ω1=0.3, ω4=0.3, ω2=0.2, ω3=0.2 are weight coefficients, prioritizing acceleration and range .
5.3 Constraint Conditions
- 0-100 km/h acceleration time: ≤11s
- Maximum speed: ≥160km/h
- Maximum gradeability: ≥20%
- NEDC 100-km energy consumption: ≤12.51kWh
- Variable ranges:85.5≤Pmax≤94.5kW,5.8≤i≤7.3,133≤C≤147Ah
.
5.4 Optimization Results
After 34 iterations using Matlab’s genetic algorithm toolbox, the optimized parameters are:
- Pmax=89.3kW
- i=6.7
- C=142Ah .
5.5 Performance Comparison Before and After Optimization
The optimized performance metrics are compared with the baseline in Table 4.
Table 4. Comparison of Performance Before and After Optimization
| Parameter | Before Optimization | After Optimization | Change Rate |
|---|---|---|---|
| 0-100 km/h Acceleration Time (s) | 10.93 | 10.01 | -8.4% |
| Maximum Speed (km/h) | 173.66 | 160.7 | -7.4% |
| Maximum Gradeability (%) | 30.67 | 35.9 | +17% |
| NEDC Driving Range (km) | 357.3 | 375 | +4.9% |
6. Conclusion
This study presents a comprehensive approach to parameter matching and optimization for pure electric vehicles using AVL CRUISE and the NSGA-II algorithm. Key findings include:
- The optimized powertrain parameters significantly improve vehicle performance:
- NEDC driving range increased by 4.9% from 357.3 km to 375 km.
- 0-100 km/h acceleration time reduced by 8.4% from 10.93 s to 10.01 s.
- Gradeability improved by 17% to 35.9%. .
- The integration of AVL CRUISE simulation with multi-objective optimization algorithms proves effective in balancing dynamic and economic performance, providing a robust framework for EV powertrain design.
- The proposed method offers practical guidance for engineering applications, demonstrating the potential to enhance EV competitiveness through systematic parameter optimization.
This research highlights the importance of synergistic design in EV development, emphasizing the role of simulation-driven optimization in addressing the complex trade-offs inherent in electric vehicle powertrain systems.