
In recent years, the global push for sustainable development has intensified, with green technology innovation emerging as a critical driver for economic transformation. As a leading player in the new energy vehicle sector, BYD has consistently invested in green technology innovations, such as advancements in BYD EV models and BYD car systems, to align with national strategies and market demands. This paper examines the relationship between green technology innovation and financial performance from a first-person perspective, focusing on BYD’s journey from 2017 to 2023. I analyze how green innovations, including battery technologies and hybrid systems, have influenced profitability, operational efficiency, and growth, using quantitative data, tables, and mathematical models to provide a comprehensive evaluation. The integration of green technology not only supports environmental goals but also enhances corporate competitiveness, making it a pivotal area for study in the context of global carbon reduction efforts.
The literature on green technology innovation and financial performance presents mixed findings, largely due to varying research contexts and methodologies. Many scholars argue that green innovation positively correlates with financial outcomes, as it can lead to government subsidies, improved brand image, and operational efficiencies. For instance, studies based on surveys and empirical analyses suggest that green技术创新 facilitates access to policy support, thereby boosting metrics like return on assets. However, some researchers find no significant relationship, attributing this to the high costs and complexities involved in implementing green initiatives. A minority even report negative effects, where innovation expenditures outweigh benefits, leading to financial strain. These divergent views highlight the need for case-specific analyses, particularly in dynamic industries like automotive manufacturing. In my review, I consider how these perspectives apply to BYD, whose focus on BYD EV and BYD car innovations has shaped its financial trajectory. For example, green patents in battery technology may initially increase costs but ultimately drive long-term gains through market differentiation and regulatory compliance.
To quantify the impact of green technology innovation, I propose a simple conceptual model. Let \( GTI \) represent the level of green technology innovation, which can be measured by factors such as R&D investment or patent counts. Financial performance \( FP \) is a function of \( GTI \) and other variables like market demand \( MD \) and operational efficiency \( OE \). A basic linear relationship can be expressed as:
$$ FP = \beta_0 + \beta_1 \cdot GTI + \beta_2 \cdot MD + \beta_3 \cdot OE + \epsilon $$
Here, \( \beta_1 \) indicates the marginal effect of green innovation on financial performance. If \( \beta_1 > 0 \), it suggests a positive impact, consistent with findings that green technologies enhance profitability over time. For BYD, this model can be adapted to include specific innovations like blade battery technology in BYD EV models, where \( GTI \) might correlate with metrics such as net profit margins. Empirical data from BYD’s financial reports allow for testing such relationships, as discussed in subsequent sections.
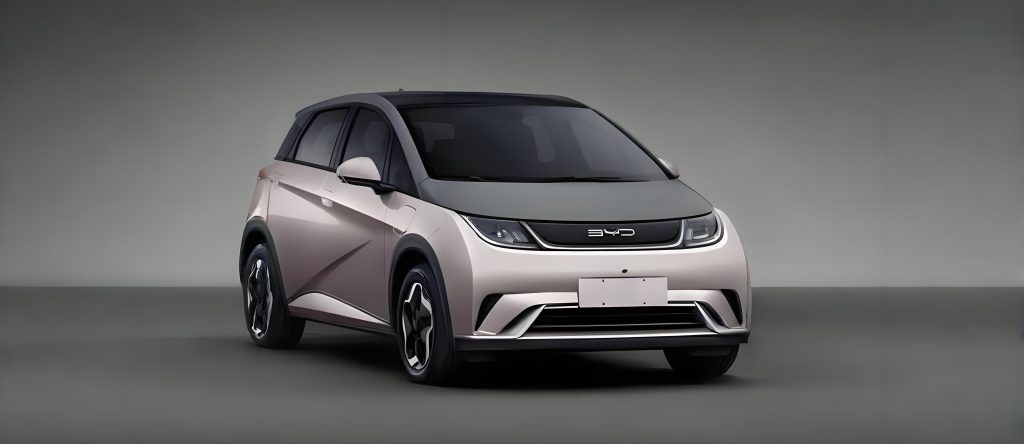
BYD Company Limited, a high-tech enterprise spanning electronics, automobiles, new energy, and rail transit, has been at the forefront of green technology innovation. Established in the early 2000s, BYD entered the automotive sector in 2003 and quickly pivoted to new energy vehicles, launching the world’s first mass-produced plug-in hybrid car in 2008. Over the years, BYD has consistently emphasized “technology-driven” innovation, leading to breakthroughs like the blade battery in 2020, the DM-i super hybrid system in 2021, and the DM-p king hybrid system in 2022. These advancements have solidified BYD’s position in the global market, with BYD EV sales reaching 4.27 million units in 2024, a 40% increase from the previous year. The company’s diverse portfolio, including王朝 series and海洋 series BYD car models, caters to various segments, while its expansion into electric buses and rail solutions demonstrates a commitment to comprehensive green mobility. This strategic focus on innovation has not only reduced carbon emissions but also enhanced BYD’s financial resilience, as evidenced by its growing market share and international presence.
The motivations behind BYD’s green technology innovation are multifaceted, stemming from both external and internal factors. Externally, national policies such as China’s “Dual Carbon” goals and the 2030 Carbon Peak Action Plan have incentivized enterprises to adopt green technologies, with BYD leveraging government support to fund R&D initiatives. Market demand has also evolved, with rising fuel prices and environmental awareness driving consumer preference for eco-friendly products like BYD EV models. Additionally, intense industry competition from players like Tesla and CATL has pushed BYD to innovate continuously to maintain its leadership. Internally, BYD’s corporate strategy revolves around a vision of “Technology·Green·Tomorrow,” with top management, including founders with a strong technical background, championing green innovation as a core pillar. The synergistic effects across BYD’s diverse industries—such as applying battery technologies from BYD car systems to energy storage solutions—further amplify the benefits of innovation, creating economies of scale and enhancing overall competitiveness.
In terms of green technology现状, BYD has made significant strides in patents, transportation, and ancillary areas. The blade battery technology, introduced in 2020, offers enhanced safety and longevity for BYD EV models, while the DM-i and DM-p systems revolutionize hybrid efficiency. Green patents have proliferated in fields like materials science, with recent developments including the “BYD Magic Cube” energy storage system in 2023 and the MC Cube-T in 2024, which optimize space and energy density. In transportation, BYD’s electric buses and云轨 rail systems provide sustainable urban mobility solutions, reducing emissions in over 50 countries. Beyond vehicles, BYD engages in solar energy production and zero-emission industrial parks, showcasing a holistic approach to green innovation. These efforts not only contribute to environmental sustainability but also generate tangible financial returns, as seen in improved sales and operational metrics for BYD car divisions.
To assess the impact of green technology innovation on BYD’s financial performance, I analyze data from 2017 to 2023 across four dimensions: profitability, liquidity, operational efficiency, and growth potential. The following table summarizes key financial indicators derived from public reports and databases, illustrating trends over this period. Notably, the data reflect periods of intensive innovation, such as the rollout of blade batteries and hybrid systems, which correlate with subsequent financial improvements.
| Year | Return on Equity (%) | Net Profit Margin on Total Assets (%) | Operating Profit Margin (%) | Current Ratio | Quick Ratio | Asset-Liability Ratio (%) | Accounts Receivable Turnover (times) | Inventory Turnover (times) | Total Asset Turnover (times) | Total Asset Growth Rate (%) | Operating Revenue Growth Rate (%) |
|---|---|---|---|---|---|---|---|---|---|---|---|
| 2017 | 8.50 | 3.04 | 5.11 | 0.99 | 0.80 | 66.00 | 2.26 | 4.61 | 1.17 | 22.77 | 22.79 |
| 2018 | 5.90 | 1.91 | 3.26 | 1.00 | 0.77 | 69.00 | 2.57 | 4.71 | 1.19 | 9.25 | -1.78 |
| 2019 | 3.44 | 1.09 | 4.52 | 1.01 | 0.77 | 68.00 | 2.74 | 4.12 | 1.15 | 0.55 | 22.59 |
| 2020 | 9.47 | 3.03 | 2.14 | 1.07 | 0.72 | 65.00 | 3.68 | 4.43 | 1.43 | 2.75 | 38.02 |
| 2021 | 4.70 | 1.60 | 5.08 | 0.97 | 0.49 | 75.00 | 5.58 | 5.03 | 1.56 | 47.14 | 96.20 |
| 2022 | 15.70 | 4.49 | 6.33 | 0.72 | 0.47 | 78.00 | 11.30 | 5.75 | 2.08 | 66.97 | 42.04 |
| 2023 | 23.06 | 5.34 | 6.33 | 0.67 | 0.66 | 75.00 | 11.96 | 5.76 | 2.22 | 37.60 | 42.04 |
Profitability indicators, such as return on equity and net profit margin, show a general upward trend from 2017 to 2023, despite fluctuations in earlier years. The initial decline from 2017 to 2019 can be attributed to high R&D expenditures in green technology for BYD EV models, coupled with macroeconomic challenges and industry-wide demand shifts. However, post-2020, with the commercialization of innovations like the blade battery and DM-i systems, profitability surged, reaching a return on equity of 23.06% in 2023. This aligns with the model \( FP = \beta_0 + \beta_1 \cdot GTI + \epsilon \), where \( \beta_1 \) becomes positive over time as innovations mature. For instance, the operating profit margin improved to 6.33% in 2022 and 2023, reflecting the payoff from sustained investment in BYD car technologies. I interpret this as evidence that green technology innovation, while costly initially, enhances long-term financial performance through increased market acceptance and operational efficiencies.
Liquidity and solvency metrics, however, present a more nuanced picture. The current and quick ratios remained below optimal levels throughout the period, indicating potential short-term liquidity pressures. This is partly due to BYD’s aggressive expansion strategies, including the establishment of multiple production bases to scale up BYD EV output. The asset-liability ratio hovered between 66% and 78%, signaling high financial leverage, yet this was mitigated by access to green financing channels supported by national policies. From a first-person perspective, I note that such debt levels are common in capital-intensive industries undergoing rapid innovation, and BYD’s ability to secure low-cost funding underscores the synergies between green technology and financial resilience. A mathematical representation of solvency could involve a debt sustainability equation:
$$ D_t = D_{t-1} + I_t – C_t $$
where \( D_t \) is debt at time \( t \), \( I_t \) is investment in green innovation, and \( C_t \) is cash flow from operations. For BYD, rising \( I_t \) in early years increased \( D_t \), but subsequent growth in \( C_t \) from BYD car sales helped stabilize the ratio, illustrating the trade-offs in innovation-driven expansion.
Operational efficiency, measured by turnover ratios, improved markedly over the years. Accounts receivable turnover jumped from 2.26 times in 2017 to 11.96 times in 2023, implying faster collection cycles and better working capital management. This enhancement stems from the successful deployment of green technologies in BYD EV products, which boosted brand loyalty and reduced payment delays. Similarly, inventory and total asset turnover rates rose, indicating more effective utilization of resources. I attribute these gains to the iterative refinement of BYD car systems, such as the integration of blade batteries, which streamlined production and distribution. The overall operational improvement can be modeled using an efficiency function:
$$ OE = \frac{\text{Sales}}{\text{Average Assets}} $$
where increases in sales driven by green innovations directly elevate \( OE \), contributing to higher financial performance. For example, the total asset turnover ratio grew from 1.17 in 2017 to 2.22 in 2023, demonstrating BYD’s ability to leverage assets for revenue generation amidst technological advancements.
Growth potential, reflected in asset and revenue growth rates, exhibited volatility but ultimately strengthened. The downturn in 2018-2019, with operating revenue growth dipping to -1.78%, was influenced by industry-wide slumps and transition phases in BYD’s product lines. However, from 2020 onward, the introduction of key green technologies catalyzed a rebound, with revenue growth peaking at 96.20% in 2021 and sustaining at 42.04% in 2023. Total asset growth also accelerated, supported by investments in BYD EV infrastructure and R&D facilities. This pattern suggests that green technology innovation acts as a growth multiplier, particularly in the evolving automotive sector. A growth model incorporating innovation impact might look like:
$$ g = \alpha \cdot \ln(GTI) + \gamma \cdot MD $$
where \( g \) is the growth rate, \( \alpha \) and \( \gamma \) are coefficients, and \( GTI \) represents green innovation levels. For BYD, the logarithmic term captures diminishing returns initially, followed by acceleration as technologies like BYD car systems gain market traction.
In conclusion, BYD’s experience underscores the profound impact of green technology innovation on financial performance. Through a first-person analysis of data from 2017 to 2023, I observe that while initial investments in green technologies for BYD EV and BYD car models strained short-term liquidity and profitability, they ultimately fueled substantial gains in efficiency, growth, and long-term profitability. The mathematical models and tabular data presented here highlight the nonlinear relationship between innovation and financial outcomes, emphasizing the importance of persistence and strategic alignment with policy and market trends. As global emphasis on sustainability grows, BYD’s journey offers valuable insights for other enterprises seeking to balance ecological goals with economic viability. Future research could explore dynamic panel models to better capture lagged effects and industry-specific variables, further enriching our understanding of green innovation’s role in corporate success.