
As a critical piece of public infrastructure, EV charging stations require mandatory inspection to ensure accurate energy measurement for trade settlements. In this article, I explore the factors influencing calibration errors and their uncertainties based on extensive field data. I also propose solutions to common issues encountered during the calibration process, aiming to optimize workflows for metrology institutions. The analysis focuses on the multidimensional aspects of error sources, including voltage and current variations, cumulative energy values, and measurement repetitions, all of which impact the reliability of EV charging station calibrations.
The calibration of EV charging stations is governed by specific regulations that outline methods for assessing working errors. For instance, real-load calibration methods are commonly employed in field inspections, with variations that depend on the availability of pulse interfaces or additional wiring. In my analysis, I adopt a real-load approach that avoids complex setups, ensuring practical applicability. The primary goal is to quantify how different parameters affect the working error, which is defined as the relative difference between the measured and reference energy values. This is crucial for maintaining the accuracy of EV charging stations, especially as their deployment expands globally.
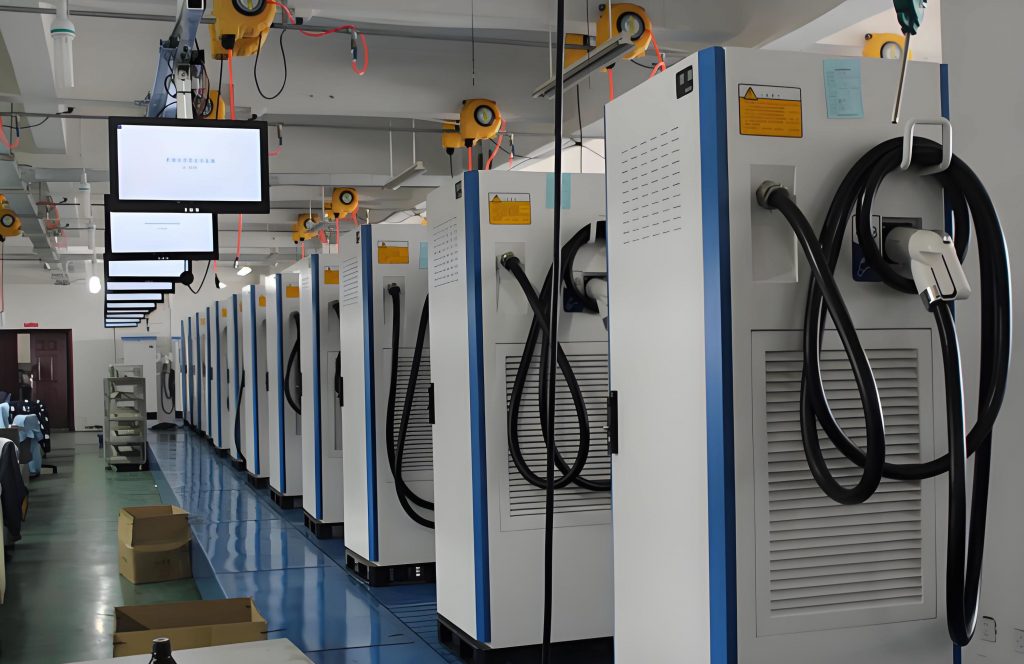
To begin, I outline the measurement conditions used in this study. The standard equipment includes a mobile testing vehicle equipped with comprehensive testing devices and programmable loads, all traceable to higher-level standards. The object under test is a typical DC EV charging station with an accuracy class of 1, capable of output voltages ranging from 200 V to 750 V and currents up to 250 A, with a rated power of 120 kW. The calibration method follows established procedures, emphasizing real-load techniques that simulate actual charging scenarios. This setup allows for a detailed examination of error influences under controlled conditions, providing a foundation for the subsequent multidimensional analysis.
Analysis of Error Influences
The working error of an EV charging station is significantly affected by the selected voltage and current load points. According to regulatory guidelines, load points should cover a range from 10% to 100% of the maximum voltage and current. In my evaluation, I measured the working error across 59 valid points after excluding those that the EV charging station could not output effectively. The results, summarized in the table below, show that while most errors fall within the permissible limits of ±1.0% for a class 1 EV charging station, some points exhibit significant deviations. This underscores the importance of selecting load points carefully, particularly in dispute or arbitration cases, where a comprehensive assessment is necessary.
| Voltage Point | Current Point | Working Error (%) |
|---|---|---|
| 0.4U_max | 0.1I_max | -0.5 |
| 0.5U_max | 0.3I_max | 0.8 |
| 0.6U_max | 0.4I_max | -1.1 |
| 0.7U_max | 0.5I_max | 1.2 |
| 0.8U_max | 0.6I_max | 0.3 |
| 0.9U_max | 0.7I_max | -0.9 |
| U_max | I_max | 1.5 |
The variation in working error across different load points can be modeled using a linear approximation. For an EV charging station, the relative error γ at a given point can be expressed as:
$$ \gamma = a \cdot V + b \cdot I + c $$
where V is the voltage, I is the current, and a, b, c are coefficients derived from empirical data. This equation highlights the multidimensional nature of error influences in EV charging stations, emphasizing the need for precise control during calibration.
Another critical factor is the cumulative energy value set during calibration. Regulatory requirements specify minimum cumulative energy values, such as 0.5 kWh for class 1 EV charging stations. However, my experiments reveal that the working error fluctuates with changes in this value. For example, at a fixed voltage of 0.6U_max and current of 0.4I_max, I observed the following variations:
| Cumulative Energy (kWh) | Working Error (%) |
|---|---|
| 0.5 | 0.5 |
| 1.0 | -0.5 |
| 1.5 | -0.4 |
| 2.0 | 0.1 |
| 2.5 | -0.1 |
| 3.0 | -0.1 |
This data indicates that errors tend to stabilize as cumulative energy increases, suggesting that adhering only to the minimum requirement may increase the risk of misjudgment. Therefore, I recommend setting higher cumulative energy values in practice to enhance reliability for EV charging station calibrations.
Measurement repetition also plays a vital role in error assessment. Regulatory standards often require at least two measurements to calculate the average error. In my tests, I conducted four consecutive measurements at the same load point and cumulative energy, resulting in significant fluctuations:
| Measurement Number | Working Error (%) |
|---|---|
| 1 | 0.1 |
| 2 | 0.3 |
| 3 | -1.1 |
| 4 | 1.9 |
The standard deviation of these measurements was calculated using the Bessel formula:
$$ s = \sqrt{\frac{\sum_{i=1}^{n} (x_i – \bar{x})^2}{n-1}} $$
where \( x_i \) are the individual measurements and \( \bar{x} \) is the mean. For this dataset, \( s = 0.81\% \), indicating poor repeatability. This underscores the necessity of multiple measurements to mitigate random errors in EV charging station calibrations.
Uncertainty Evaluation
To comprehensively assess the calibration process for EV charging stations, I developed a measurement model that accounts for various uncertainty sources. The model is defined as:
$$ \gamma = \gamma_0 + \Delta \gamma $$
where \( \gamma \) is the relative error of the EV charging station, \( \gamma_0 \) is the relative error of the calibration device, and \( \Delta \gamma \) is the correction value. The uncertainty components include repeatability, standard device accuracy, cumulative energy influence, and rounding errors.
First, I evaluated the standard uncertainty from repeatability (\( u_1 \)) using a Type A assessment. Based on 10 repeated measurements at a load point of 0.6U_max and 0.4I_max, with a cumulative energy of 0.5 kWh, the standard deviations for 1 to 4 measurements were calculated as 0.81%, 0.57%, 0.47%, and 0.40%, respectively.
Next, the standard uncertainty from the maximum permissible error of the calibration device (\( u_2 \)) was assessed using a Type B method. Assuming a uniform distribution for a 0.05% accuracy class device:
$$ u_2 = \frac{0.05\%}{\sqrt{3}} = 0.029\% $$
The uncertainty due to cumulative energy variations (\( u_3 \)) was also evaluated as a Type B component. With an observed fluctuation of approximately 1% over a 0.5 kWh to 3 kWh range, and assuming a uniform distribution:
$$ u_3 = \frac{0.5\%}{\sqrt{3}} = 0.29\% $$
Rounding errors (\( u_4 \)) were considered similarly, with a rounding interval of 0.1% leading to:
$$ u_4 = \frac{0.05\%}{\sqrt{3}} = 0.029\% $$
The combined standard uncertainty (\( u_c \)) for 1 to 4 measurements was then computed as:
$$ u_c = \sqrt{u_1^2 + u_2^2 + u_3^2 + u_4^2} $$
Resulting in values of 0.86%, 0.64%, 0.55%, and 0.50%, respectively. Finally, the expanded uncertainty (U) was determined with a coverage factor k=2:
$$ U = k \cdot u_c $$
Yielding 1.7%, 1.3%, 1.1%, and 1.0% for 1 to 4 measurements. This analysis highlights the importance of multiple measurements in reducing uncertainty for EV charging station calibrations.
Common Issues in Calibration Practice
During field calibrations of EV charging stations, several recurrent problems arise that complicate the process. One major issue is the lack of understanding among operators regarding mandatory inspection requirements. Many EV charging station owners are unfamiliar with计量检定 concepts, leading to delays and inefficiencies. Additionally, coordination between regulatory bodies and operators is often inadequate, resulting in incomplete compliance.
Another challenge is the mismatch between EV charging stations and standard calibration equipment. In some cases, connecting the devices fails to initiate charging due to parameter incompatibilities or firmware issues. This necessitates adjustments by manufacturers, prolonging the calibration timeline. For instance, I have observed instances where specific current settings prevent normal operation, requiring technical interventions to resolve.
High failure rates further exacerbate these difficulties. Based on data from approximately 1,100 EV charging station calibrations, the overall failure rate was 14.8%, with common causes including working errors exceeding limits, communication failures, and clock inaccuracies. The distribution of failures is summarized below:
| Failure Type | Percentage of Total Failures (%) |
|---|---|
| Working Error Exceedance | 23.9 |
| Appearance and Function Issues | 18.4 |
| Clock Time Error | 57.7 |
To address these issues, I recommend proactive measures such as remote pre-checks for parameters like appearance and clock synchronization. This can reduce on-site rework and improve the efficiency of EV charging station calibrations.
Conclusion
In summary, this multidimensional analysis of EV charging station calibration errors reveals that factors such as voltage and current load points, cumulative energy values, and measurement repetitions significantly influence working errors. The uncertainty evaluation demonstrates that repeated measurements and higher cumulative energy settings can enhance reliability. Common practical problems, including equipment mismatches and high failure rates, underscore the need for improved communication and pre-calibration checks. By implementing the proposed strategies, metrology institutions can optimize their workflows, ensuring accurate and efficient calibrations for EV charging stations. This contributes to the sustainable growth of the electric vehicle infrastructure, fostering trust in energy trade settlements.