
In recent years, the automotive industry has undergone a significant transformation, driven by the urgent need to address environmental concerns and reduce dependence on fossil fuels. Among various alternatives, the battery electric vehicle has emerged as a promising solution due to its zero tailpipe emissions, lower noise levels, and potential for sustainable energy integration. However, the widespread adoption of battery electric vehicles is hindered by challenges such as high battery costs, limited driving range, and relatively shorter lifespan compared to conventional vehicles. To overcome these barriers and promote the development of battery electric vehicles, in-depth research into vehicle parameters and system optimization is essential. In this study, we focus on the powertrain parameter matching for a specific battery electric vehicle, employing theoretical analysis and simulation techniques to enhance both dynamic and economic performance. Our goal is to provide a comprehensive framework for the design and evaluation of battery electric vehicle systems, which can serve as a reference for similar developments in the field.
The performance of a battery electric vehicle largely depends on the careful selection and matching of key components, including the drive motor, power battery, and transmission system. Parameter matching ensures that the vehicle meets predefined targets for acceleration, top speed, gradability, and energy efficiency. To achieve this, we first establish mathematical models for the primary performance indicators, which form the basis for component sizing and optimization. Subsequently, we utilize CRUISE simulation software to build a detailed vehicle model and conduct simulations under various driving conditions. The simulation results validate our parameter matching approach and demonstrate the feasibility of the proposed design. Throughout this paper, we emphasize the importance of systematic design in advancing battery electric vehicle technology, and we repeatedly highlight the term “battery electric vehicle” to underscore its relevance in modern transportation systems.
Before delving into component matching, it is crucial to define the overall vehicle parameters and performance targets. These parameters serve as inputs for our mathematical models and simulations. The following table summarizes the main design parameters for the battery electric vehicle under consideration:
| Parameter | Value |
|---|---|
| Curb mass (kg) | 1900 |
| Gross vehicle mass (kg) | 2900 |
| Rolling resistance coefficient | 0.01 |
| Frontal area (m²) | 2.56 |
| Dimensions (length × width × height, mm) | 3520 × 1570 × 1490 |
| Wheelbase (mm) | 3300 |
| Adhesion coefficient | 0.85 |
| Wheel rolling radius (mm) | 298 |
| Air drag coefficient | 0.53 |
Based on these parameters, we set the following performance targets for the battery electric vehicle, which are critical for ensuring competitiveness and user satisfaction:
| Performance Indicator | Target Requirement |
|---|---|
| 0-100 km/h acceleration time (s) | ≤ 15 |
| Maximum gradability at 20 km/h (%) | ≥ 30 |
| NEDC driving range (km) | ≥ 210 |
| Energy consumption at constant speed (kWh/100 km, full load) | ≤ 16 |
| Driving range at constant 60 km/h (km) | ≥ 280 |
| Maximum speed (km/h) | ≥ 120 |
To achieve these targets, we develop mathematical models for key performance aspects. The power required for vehicle motion can be derived from fundamental physics principles. For instance, the power needed to maintain the top speed is calculated using the following equation, which accounts for rolling resistance and aerodynamic drag:
$$P_1 = \frac{V_{\text{max}}}{3600 \eta_t} \left( m g f + \frac{C_D A V_{\text{max}}^2}{21.15} \right)$$
where \( V_{\text{max}} \) is the maximum speed in km/h, \( \eta_t \) is the transmission efficiency (assumed as 0.9), \( m \) is the vehicle mass in kg, \( g \) is the gravitational acceleration (9.81 m/s²), \( f \) is the rolling resistance coefficient, \( C_D \) is the air drag coefficient, and \( A \) is the frontal area in m². This equation is essential for sizing the drive motor in a battery electric vehicle to ensure it can sustain high-speed travel.
Similarly, the power required for acceleration is modeled to account for inertial forces and velocity-dependent resistances. The formula for acceleration power is given by:
$$P_2 = \frac{1}{3600 \eta_t t_m} \left( \frac{\delta m v_m^2}{2 t_m} + \frac{m g f v_m}{1.5} + \frac{C_D A v_m^3}{21.15 \times 2.5} \right)$$
where \( t_m \) is the acceleration time in seconds, \( \delta \) is the rotational mass conversion factor (taken as 1.845), and \( v_m \) is the target speed in m/s. This calculation ensures that the battery electric vehicle can achieve quick acceleration, which is a key performance metric for modern electric vehicles.
For gradability, the power needed to climb a slope at a specific speed is derived from the following expression:
$$P_3 = \frac{m g V_i}{3600 \eta_t} \left( f \cos \alpha + \sin \alpha_{\text{max}} + \frac{C_D A V_i^2}{76146} \right)$$
where \( V_i \) is the climbing speed in km/h, \( \alpha \) is the slope angle, and \( \alpha_{\text{max}} \) is the maximum slope angle. This model ensures that the battery electric vehicle can handle steep inclines, enhancing its utility in diverse terrains.
These mathematical models form the foundation for component parameter matching. In the next section, we apply these equations to select and optimize the drive motor and power battery for our battery electric vehicle.
The drive motor is the heart of a battery electric vehicle, converting electrical energy into mechanical torque to propel the vehicle. After evaluating various motor types, we selected a permanent magnet synchronous motor (PMSM) for its high efficiency, compact size, and excellent performance across a wide speed range. The parameter matching for the drive motor involves determining its peak power, rated power, base speed, and maximum speed based on the performance targets. The peak power must satisfy the highest demand among top speed, acceleration, and gradability requirements. Using the formulas above, we computed the following power values:
| Power Requirement | Calculation Result (kW) |
|---|---|
| Top speed power (\( P_1 \)) | 41.9 (rounded to 42) |
| Acceleration power (\( P_2 \)) | 93.8 |
| Gradability power (\( P_3 \)) at 20 km/h | 50 |
Thus, the peak power of the drive motor should be at least the maximum of these values:
$$P_{\text{max}} \geq \max\{P_1, P_2, P_3\} = 93.8 \text{ kW}$$
We round this to 94 kW for practical purposes. The rated power of the motor is related to the peak power through the overload coefficient \( \lambda \), which typically ranges from 2 to 3. For our battery electric vehicle, we choose \( \lambda = 2 \), leading to:
$$P_0 = \frac{P_{\text{max}}}{\lambda} = \frac{94}{2} = 47 \text{ kW}$$
The base speed and maximum speed of the motor are determined based on the transmission ratio and wheel dynamics. The final drive ratio \( i_0 \) is set to 8.12 after optimization for energy efficiency and performance. The maximum motor speed is calculated using:
$$n_{\text{max}} = \frac{V_{\text{max}} i_0}{0.377 r}$$
where \( r \) is the wheel rolling radius in meters (0.298 m). Substituting the values:
$$n_{\text{max}} = \frac{120 \times 8.12}{0.377 \times 0.298} \approx 8673 \text{ rpm}$$
The base speed \( n_0 \) is related to the maximum speed through the base speed ratio \( \beta \), which is chosen as 3.2 for this battery electric vehicle:
$$n_{\text{max}} = \beta n_0 \implies n_0 = \frac{n_{\text{max}}}{\beta} = \frac{8673}{3.2} \approx 2710 \text{ rpm}$$
The torque characteristics of the motor can be derived from the power and speed. The rated torque \( T_0 \) and peak torque \( T_{\text{max}} \) are given by:
$$T_0 = \frac{9550 P_0}{n_0} = \frac{9550 \times 47}{2710} \approx 165.5 \text{ N·m}$$
$$T_{\text{max}} = \frac{9550 P_{\text{max}}}{n_0} = \frac{9550 \times 94}{2710} \approx 331 \text{ N·m}$$
These parameters ensure that the drive motor provides sufficient torque for acceleration and climbing while maintaining efficiency. The following table summarizes the matched drive motor parameters for our battery electric vehicle:
| Motor Parameter | Value |
|---|---|
| Type | Permanent Magnet Synchronous Motor (PMSM) |
| Peak power (kW) | 94 |
| Rated power (kW) | 47 |
| Base speed (rpm) | 2710 |
| Maximum speed (rpm) | 8673 |
| Peak torque (N·m) | 331 |
| Rated torque (N·m) | 165.5 |
The power battery is another critical component in a battery electric vehicle, supplying energy to the drive motor and auxiliary systems. Its parameters must be matched to meet the driving range and power demand. We selected lithium-ion battery cells for their high energy density and power capability. The battery system design involves determining the total energy capacity and voltage based on the vehicle’s energy consumption and range targets.
First, we calculate the average power required during driving at a constant speed of 60 km/h, which is a common benchmark for range estimation. The average power \( P_a \) is given by:
$$P_a = \frac{V_a}{3600 \eta_t} \left( m g f + \frac{C_D A V_a^2}{21.15} \right)$$
where \( V_a = 60 \text{ km/h} \). Substituting the values, we get \( P_a \approx 12.5 \text{ kW} \). The energy required from the battery to achieve a driving range \( S \) at this speed is:
$$W \geq \frac{P_a S}{\eta_{\text{DOD}} \eta_t \eta_E V_a}$$
where \( \eta_{\text{DOD}} = 0.8 \) is the depth of discharge, \( \eta_E = 0.9 \) is the efficiency of the motor and controller, and \( S = 280 \text{ km} \). This yields:
$$W \geq \frac{12.5 \times 280}{0.8 \times 0.9 \times 0.9 \times 60} \approx 72.3 \text{ kWh}$$
However, for practical design, we consider the NEDC range target of 210 km and adjust accordingly. The battery energy \( W \) is related to its capacity \( C_E \) and voltage \( U_E \) by:
$$W = \frac{C_E \times U_E}{1000} \quad \text{(in kWh)}$$
We choose a battery pack with a nominal voltage of 350 V (based on cell configuration) and a capacity of 150 Ah, resulting in:
$$W = \frac{150 \times 350}{1000} = 52.5 \text{ kWh}$$
This capacity is sufficient to meet the range targets after accounting for realistic driving patterns and efficiency losses. The battery system is configured using series and parallel connections of individual cells. Each cell has a nominal voltage of 3.7 V and a capacity of 50 Ah. The configuration is summarized below:
| Battery Parameter | Value |
|---|---|
| Cell type | Lithium-ion |
| Cell nominal voltage (V) | 3.7 |
| Cell capacity (Ah) | 50 |
| Number of cells in series | 95 |
| Number of parallel strings | 3 |
| Total battery voltage (V) | ≈ 351.5 |
| Total battery capacity (Ah) | 150 |
| Total battery energy (kWh) | 52.7 |
With the component parameters matched, we proceed to build a detailed model of the battery electric vehicle using CRUISE simulation software. CRUISE is a powerful tool for analyzing vehicle performance, allowing us to integrate the drive motor, power battery, transmission, and vehicle dynamics into a cohesive system. The modeling process involves defining each component with the parameters derived above and setting up simulation tasks for performance evaluation.
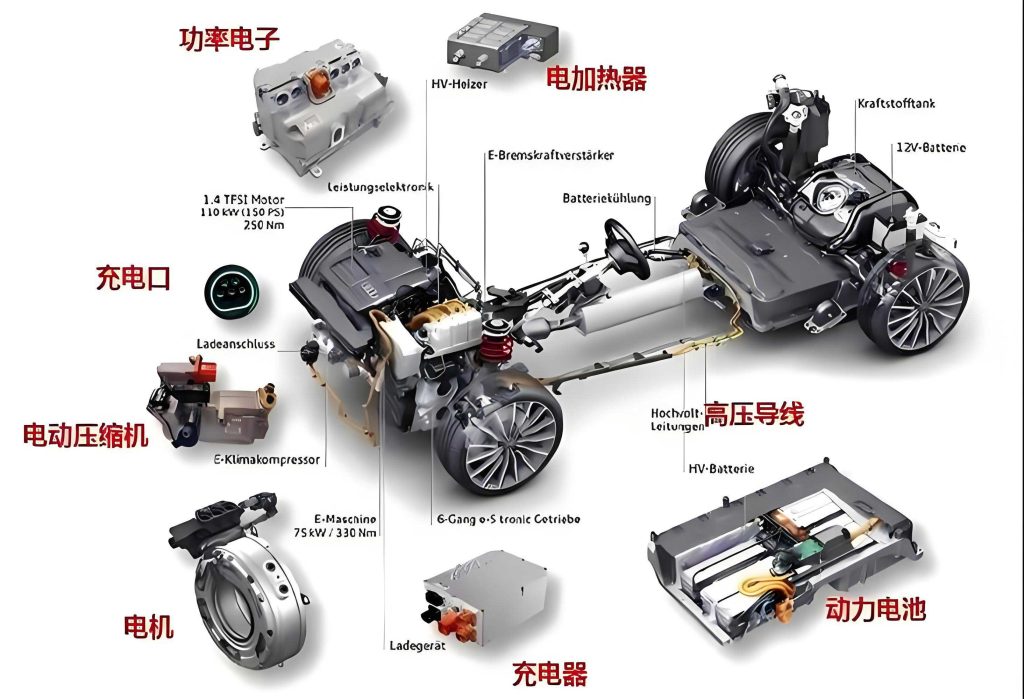
The image above illustrates a typical battery electric vehicle, highlighting its key components such as the battery pack and electric drive system. In our CRUISE model, we replicate this architecture to simulate real-world behavior. The model includes subsystems for the powertrain, chassis, and controls, enabling us to assess both dynamic and economic performance under various driving cycles.
We conducted multiple simulations to evaluate the battery electric vehicle against the design targets. The simulation tasks included maximum speed test, acceleration test, gradability test, and driving range tests under NEDC and constant-speed conditions. The results are presented and analyzed in the following sections, demonstrating the effectiveness of our parameter matching approach.
First, we simulated the maximum speed of the battery electric vehicle under full-load conditions. The simulation output shows that the vehicle achieves a top speed of 124 km/h, which exceeds the target of 120 km/h. This confirms that the drive motor and transmission are adequately matched for high-speed performance in this battery electric vehicle. The speed-time curve from the simulation is smooth, indicating stable operation at the limit.
Next, we evaluated the acceleration performance by simulating a 0-100 km/h sprint. The simulation result indicates an acceleration time of 14.89 seconds, meeting the target of ≤15 seconds. This achievement is crucial for the battery electric vehicle to compete with conventional vehicles in terms of drivability. The acceleration curve shows rapid torque delivery from the motor, characteristic of electric propulsion systems.
For gradability, we simulated the vehicle climbing a slope at a constant speed of 20 km/h. The maximum gradability achieved is 34.2%, surpassing the target of 30%. At a crawl speed of 1 km/h, the gradability can reach up to 34.99%, demonstrating the robust low-speed torque capability of the drive motor in this battery electric vehicle. These results ensure that the vehicle can handle steep inclines in urban or mountainous areas.
The following table summarizes the dynamic performance simulation results for the battery electric vehicle:
| Dynamic Performance Indicator | Simulation Result | Target Requirement | Status |
|---|---|---|---|
| Maximum speed (km/h) | 124 | ≥ 120 | Met |
| 0-100 km/h acceleration time (s) | 14.89 | ≤ 15 | Met |
| Maximum gradability at 20 km/h (%) | 34.2 | ≥ 30 | Met |
Moving to economic performance, we simulated the driving range under the New European Driving Cycle (NEDC) and at a constant speed of 60 km/h. For the NEDC, the battery electric vehicle achieves a range of 211 km, which meets the target of ≥210 km. The simulation accounts for typical urban and extra-urban driving patterns, reflecting real-world usage scenarios for a battery electric vehicle. The state of charge (SOC) profile during the NEDC simulation shows gradual depletion, with regenerative braking events contributing to energy recovery.
In the constant-speed test at 60 km/h, the vehicle reaches a range of 281 km when the battery SOC drops to 5%, exceeding the target of 280 km. The energy consumption per 100 km under full load is calculated as 15.97 kWh, which is within the limit of 16 kWh. This efficiency is attributed to the optimized parameter matching and the high efficiency of the permanent magnet synchronous motor. The following table presents the economic performance results:
| Economic Performance Indicator | Simulation Result | Target Requirement | Status |
|---|---|---|---|
| NEDC driving range (km) | 211 | ≥ 210 | Met |
| 60 km/h constant-speed range (km) | 281 | ≥ 280 | Met |
| Energy consumption at 60 km/h (kWh/100 km, full load) | 15.97 | ≤ 16 | Met |
To further analyze the energy flow and efficiency, we can derive additional formulas. For instance, the overall energy efficiency \( \eta_{\text{total}} \) of the battery electric vehicle during a driving cycle can be expressed as:
$$\eta_{\text{total}} = \frac{E_{\text{mech}}}{E_{\text{batt}}} = \eta_{\text{batt}} \times \eta_{\text{inv}} \times \eta_{\text{motor}} \times \eta_{\text{trans}}$$
where \( E_{\text{mech}} \) is the mechanical energy at the wheels, \( E_{\text{batt}} \) is the energy drawn from the battery, \( \eta_{\text{batt}} \) is the battery efficiency, \( \eta_{\text{inv}} \) is the inverter efficiency, \( \eta_{\text{motor}} \) is the motor efficiency, and \( \eta_{\text{trans}} \) is the transmission efficiency. In our simulations, we assumed typical values: \( \eta_{\text{batt}} = 0.95 \), \( \eta_{\text{inv}} = 0.97 \), \( \eta_{\text{motor}} = 0.93 \), and \( \eta_{\text{trans}} = 0.95 \), leading to an overall efficiency of approximately 0.85. This high efficiency contributes to the favorable economic performance of the battery electric vehicle.
Another important aspect is the regenerative braking system, which recovers kinetic energy during deceleration and feeds it back to the battery. The energy recovered \( E_{\text{regen}} \) can be estimated using:
$$E_{\text{regen}} = \int_{t_1}^{t_2} P_{\text{regen}} \, dt = \int_{t_1}^{t_2} \eta_{\text{regen}} \times T_{\text{brake}} \times \omega \, dt$$
where \( P_{\text{regen}} \) is the regenerative power, \( \eta_{\text{regen}} \) is the regeneration efficiency (around 0.7), \( T_{\text{brake}} \) is the braking torque, and \( \omega \) is the angular speed of the wheels. In our NEDC simulation, regenerative braking adds about 5-10% to the overall range, highlighting its significance in enhancing the efficiency of a battery electric vehicle.
The success of our parameter matching and simulation validates the design methodology for battery electric vehicles. However, there are additional factors to consider for future improvements. For example, thermal management of the battery pack can impact both performance and lifespan. The heat generation rate \( Q_{\text{batt}} \) in the battery can be modeled using Joule heating and entropic effects:
$$Q_{\text{batt}} = I^2 R_{\text{internal}} + T \frac{\partial U}{\partial T} I$$
where \( I \) is the current, \( R_{\text{internal}} \) is the internal resistance, \( T \) is the temperature, and \( \frac{\partial U}{\partial T} \) is the temperature coefficient of the open-circuit voltage. Implementing advanced thermal management could further optimize the battery electric vehicle’s durability and efficiency.
Moreover, the transmission system in a battery electric vehicle can be refined. While we used a fixed-ratio reducer with \( i_0 = 8.12 \), multi-speed transmissions or continuously variable transmissions (CVTs) could improve efficiency across a wider speed range. The optimal transmission ratio for minimizing energy consumption can be found by solving:
$$\min_{i} \int_{\text{cycle}} P_{\text{required}}(v, i) \, dt$$
where \( P_{\text{required}} \) is the power demand as a function of vehicle speed \( v \) and transmission ratio \( i \). Such optimizations could be explored in subsequent studies on battery electric vehicles.
In conclusion, this study demonstrates a systematic approach to parameter matching and simulation for a battery electric vehicle. By establishing mathematical models for performance indicators, we matched the drive motor and power battery parameters to meet specific targets for acceleration, top speed, gradability, and driving range. The CRUISE simulation results confirm that the designed battery electric vehicle satisfies all dynamic and economic performance requirements, with a top speed of 124 km/h, acceleration time of 14.89 s, gradability of 34.2%, NEDC range of 211 km, and 60 km/h constant-speed range of 281 km. The methodology outlined here provides a reliable framework for the development of battery electric vehicles, emphasizing the importance of integrated design and simulation. Future work could focus on optimizing thermal management, exploring advanced transmission systems, and incorporating real-world driving data to enhance the accuracy of simulations. As the automotive industry evolves, the battery electric vehicle will continue to play a pivotal role in sustainable transportation, and studies like this contribute to its ongoing advancement.