
Modern electric cars must satisfy a broad range of legislative requirements before entering the market. One of the most important performance indicators for owners and regulators is the driving range, which is commonly measured on a chassis dynamometer. However, range values are not intrinsic physical constants; they depend strongly on the driving cycle, the vehicle mass loaded on the dynamometer, the braking energy recovery logic, and the calculation method used to convert measured electrical energy into a distance. In this work, we examined one conventional pure electric car and compared its range and energy consumption under three different regulatory conditions: the European WLTC family, the Chinese CLTC-P cycle, and the legacy NEDC cycle. The main objective was to quantify the differences and to explain them on the basis of speed profiles, vehicle test mass, regenerative braking behaviour, and shortened-test weighting factors.
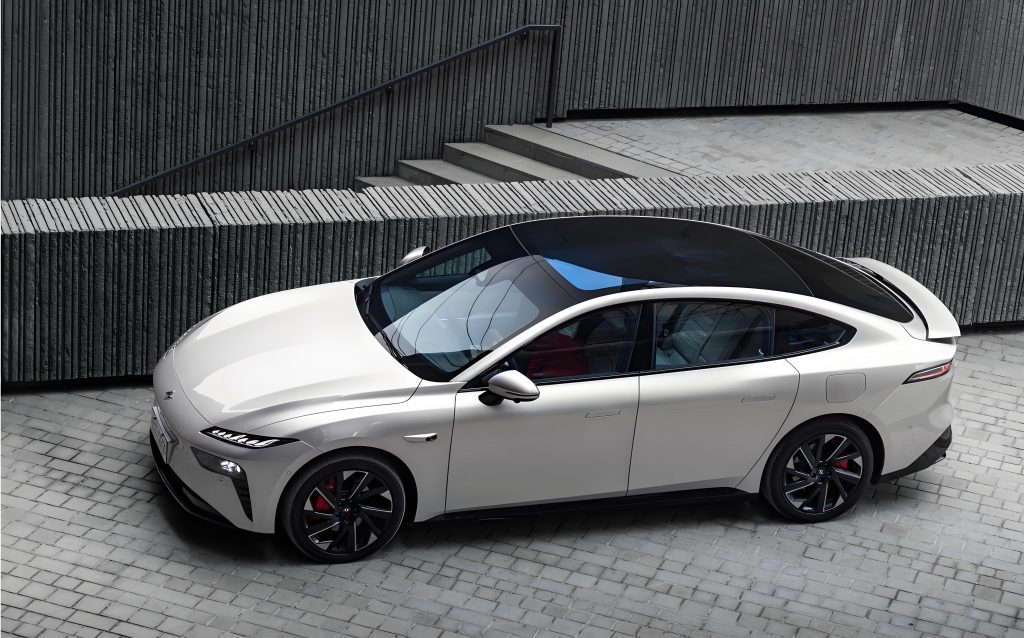
The tested electric car belongs to the mainstream saloon category and is representative of modern battery-electric vehicles. It was equipped with a 70 kWh lithium-ion traction battery and a permanently excited synchronous motor. The vehicle was tested sequentially under the same thermal environment, with all auxiliary consumers switched off, the brake energy recovery function active, and the same driver assistance mode selected. The only intentionally changed variables among the tests were the prescribed cycle and the reference mass used to set the dynamometer road load. By keeping the electric car itself unchanged, the measured range spread can be attributed directly to the test protocols.
The test programme was divided into three parts. First, the electric car was tested according to the shortened procedure defined in the European regulation (EU) 2018/1832, which uses the WLTC cycle. Second, the same electric car was tested according to the shortened procedure described in the Chinese standard GB/T 18386.1-2021, which uses the CLTC-P cycle. Third, the electric car was tested according to the continuous procedure of GB/T 18386-2017, which uses repeated NEDC cycles until the test-end criterion was met. During each test, the instantaneous vehicle speed, traction battery voltage, current, and accumulated electrical energy were logged at high frequency. The chassis dynamometer provided the road load simulation, while the power analyser measured the energy flow into and out of the high-voltage battery.
The results showed a clear ranking. The WLTC-based test produced the highest average energy consumption per kilometre and therefore the shortest driving range. The NEDC-based test was intermediate. The CLTC-P-based test produced the lowest energy consumption and the highest range. More precisely, the final range result for the electric car was around 386 km for WLTC, around 450 km for NEDC, and about 477 km for CLTC-P. The difference between the maximum and minimum range was therefore 91 km, which is approximately 23.6% of the WLTC result. Such a large spread may surprise end users because the physical vehicle did not change and the battery state of health was identical before each test.
To explain this spread, we analysed the speed patterns of the three cycles. The WLTC cycle contains aggressive high-speed and extra-high-speed segments, frequent accelerations, and a relatively high average speed. The CLTC-P cycle was originally developed from Chinese road traffic data and contains more idling time, more low-speed and medium-speed operation, and a maximum speed of only 114 km/h. The NEDC cycle has quite smooth and steady phases, but it is older and includes a 120 km/h high-speed phase in its extra-urban section. The average speed of WLTC is 46.5 km/h, while NEDC has an average speed of 33.6 km/h, and CLTC-P has an average speed of approximately 28.9 km/h. Higher average speed and stronger acceleration generally imply higher traction energy demand, although the effect is partially offset by regenerative braking.
We also noticed that test mass had an influence. For WLTC and CLTC-P, the standard required the vehicle test mass to be equal to the kerb mass plus a representative payload, which in our case corresponded to 2064 kg. For the NEDC procedure from the previous standard, the test mass was lighter and equal to 1993 kg. The 71 kg difference in test mass changes the road load applied by the chassis dynamometer. The difference in average dynamometer force between the two settings was approximately 15 N over the speed range. Therefore, the WLTC and CLTC tests were performed with a slightly higher resistance than the NEDC test, which further explains why NEDC produced a range value closer to the CLTC result despite its higher aerodynamic phase.
An important subtlety is the testing method. NEDC was performed as a continuous multi-cycle run, while WLTC and CLTC-P were performed with the shortened procedure. In the shortened procedure, the electric car is supposed to run a composite cycle that consists of several dynamic segments and two constant-speed discharge segments. The test is repeated until the battery can no longer follow the prescribed speed trace or until the state of charge falls below a defined threshold. The calculation of the final range is then based on the measured electrical energy change of the REESS over the complete dynamic cycles and a weighting factor related to those cycles. This approach differs from the NEDC continuous method, where the simply accumulated distance is used.
In the following sections, we describe the experimental setup, the test vehicle parameters, the dynamometer loading, the characteristics of the three duty cycles, the mathematical formulation for the shortened test, and the main measured electric variables. We also highlight why the initial cycles of some tests are atypical from the point of view of regenerative braking and how this behaviour affects the weighting factors. The purpose is to provide a clear engineering explanation for the differences in driving range between different test protocols for one and the same electric car.
Test Vehicle and Experimental Setup
The electric car used for this test campaign was a conventional pure-electric sedan. It was selected because its nominal battery capacity, aerodynamic shape, and energy recovery strategy are representative of the mainstream products available on the market. Before the formal testing, the high-voltage battery was subjected to a standard conditioning procedure, followed by an initial full discharge and a subsequent full charge. This ensured that every test began with an identical state of charge and battery temperature. The main parameters of the electric car are listed below.
| Parameter | Value |
|---|---|
| Vehicle category | Pure electric passenger car |
| Kerb mass | 1893 kg |
| Gross vehicle mass | 2270 kg |
| Maximum vehicle speed | 160 km/h |
| Battery chemistry | Lithium-ion |
| Battery rated energy | 70 kWh |
| Driving configuration | Front-wheel drive |
| Regenerative braking | Active during all tests |
The tests were carried out on a four-wheel chassis dynamometer in a temperature-controlled laboratory. The dynamometer was operated in front-wheel-drive mode because the electric car is powered by its front axle. The test roller speed was controlled precisely so that the actual vehicle speed followed the target cycle speed within the permitted tolerances, typically plus or minus 2 km/h. The driver used a robotic driving aid and followed the target trace displayed on a monitor. An independent power analyser measured the voltage and current of the high-voltage battery. The voltage was sampled at the battery terminal, while the current was measured by a high-bandwidth hall sensor connected around the high-voltage cable. The instantaneous product of voltage and current gave the battery power, and the time integration of power gave the electrical energy extracted from or fed into the REESS.
The chassis dynamometer load was set according to the individual standard for each test. Before the dynamometer load was fixed, the electric car was brought to a uniform thermal state by running it at 80 km/h for half an hour. Then coast-down tests were performed on the dynamometer to determine the actual road load coefficients. A weighted least-squares fit was used to express the road load as a quadratic function of vehicle speed:
$$F_{\mathrm{road}}(v) = f_0 + f_1 v + f_2 v^2$$
where \(F_{\mathrm{road}}\) is the force that the dynamometer has to simulate, \(v\) is the vehicle speed, \(f_0\) represents the rolling resistance term that does not depend on speed, \(f_1\) is a linear term related to tyre deformation, and \(f_2\) is the aerodynamic drag coefficient. The values of the coefficients were different for the new and old test standards because the test mass differed. For the WLTC and CLTC procedures, the test mass was 2064 kg. For the older NEDC procedure, the test mass was 1993 kg. Table 2 summarises these values.
| Regulatory procedure | Reference test mass / kg |
|---|---|
| Regulation (EU) 2018/1832 (WLTC) | 2064 |
| GB/T 18386.1-2021 (CLTC-P) | 2064 |
| GB/T 18386-2017 (NEDC) | 1993 |
Figure 1 shows a typical view of the electric car installed on the chassis dynamometer during the project. The four-roller bench and the cooling fan can be observed, together with the data acquisition system that records the electrical variables.
Dynamometer Road-Load Verification
Before each official range test, we performed a coast-down verification on the chassis dynamometer. The purpose of this verification was to confirm that the force applied to the tyres was close to the prescribed road load curve. The electric car was accelerated to a speed slightly above the highest speed of the target cycle and then placed in neutral as required by the procedure. The speed decay was recorded, and from the deceleration, we derived the resistance force. This measured force was then compared with the target force calculated from the polynomial coefficients. The agreement was satisfactory for all three conditions. The largest difference occurred at high speed, but it remained below the tolerances allowed by the standards.
Table 2 shows that the NEDC test was performed with a smaller reference mass than the WLTC and CLTC tests. Consequently, the road-load curve for NEDC was lower. The average difference between the two loaded-mass conditions over the speed interval from 10 to 130 km/h was about 15 N. Although 15 N seems modest, over a 450 km driving range this force difference translates into non-negligible mechanical work. It is another factor that helped the NEDC range result to become higher than the WLTC range, all other things being equal. It also means that part of the difference between NEDC and CLTC range values is not caused by the speed profile but by the different test mass.
We also inspected the temperature of the high-voltage battery during the coast-down procedure. The battery temperature was kept between 20 °C and 30 °C throughout the whole test campaign, as required by the standards. The laboratory temperature was maintained at 23 °C with a variation of no more than 2 °C. A constant temperature is especially important for an electric car because battery internal resistance and available discharge capacity are both temperature sensitive. By keeping the thermal environment stable, we ensured that the differences from one standard to another were caused mainly by the driving cycle and not by the battery condition.
Driving Cycles and Their Characteristics
The three standard cycles that were applied to the electric car are summarised in Table 3. Each cycle has a different speed trace, duration, maximum speed, average speed, and degree of acceleration intensity. Understanding these characteristics is essential for interpreting the range result. The WLTC cycle represents a modern worldwide transient cycle, the CLTC-P cycle represents Chinese urban traffic statistics, and the NEDC cycle is an older modal cycle with long constant-speed periods.
| Cycle | Duration / s | Distance / km | Average speed / km/h | Maximum speed / km/h |
|---|---|---|---|---|
| WLTC | 1800 | 23.21 | 46.5 | 131.3 |
| CLTC-P | 1800 | 14.48 | 28.96 | 114.0 |
| NEDC | 1180 | 11.02 | 33.6 | 120.0 |
The WLTC cycle is composed of four phases: low, medium, high, and extra-high speed. The first two phases can be grouped together as a low-speed urban part, while the latter two represent suburban and motorway driving. Because the high-speed segment contains speeds above 100 km/h and many accelerations from standstill, the average power demand is substantial. In contrast, the CLTC-P cycle has only three phases: low, medium, and high speed, and it never exceeds 114 km/h. Its acceleration profile is less aggressive in the high-speed phase, although it still contains many transient events. The NEDC cycle is formed by four identical urban segments followed by one extra-urban segment. It is often described as a modal cycle because the accelerations are gentle and the cruise periods are long. In the NEDC cycle, the acceleration time occupies 277 s, which is about 23% of the cycle, while the deceleration time is about 15%, the constant-speed time is about 38%, and the idle time is about 24%. In contrast, modern transient cycles have far fewer seconds of true constant-speed operation and many more acceleration and deceleration events.
For the WLTC shortened procedure, one composite test cycle contains two dynamic segments, DS1 and DS2, and two constant-speed segments, CSSM and CSSE. The dynamic segments contain a prescribed number of WLTC curves. The first constant-speed segment is physically located between the two dynamic segments, while the second constant-speed segment is at the end of the composite cycle. Both constant-speed segments use a nominal speed of 100 km/h. In a similar way, the CLTC-P shortened procedure is constructed from four CLTC-P dynamic cycles plus two constant-speed segments at 100 km/h. The first dynamic segment contains two complete CLTC-P cycles, and the second dynamic segment contains another two complete CLTC-P cycles. The two constant-speed segments are designated CSSM and CSSE. During the constant-speed segments, the electric car is continuously discharging and there is almost no energy recovery; therefore, those segments contribute a high proportion of the electrical energy extracted from the battery.
Shortened Procedure and Range Determination
Because the complete WLTC and CLTC-P range tests would need a very long time if the vehicle simply repeated the basic cycle thousands of times, standards allow a shortened procedure. In a shortened test, the electric car is driven over a specially designed composite cycle whose length is only a fraction of the total expected range. The composite cycle includes enough complete dynamic cycles so that the weighting factors can be calculated from measured battery energy. At the end of the test, the range is not equal to the accumulated distance but rather to a calculated value based on electrical energy balance. In contrast, the NEDC test in GB/T 18386-2017 is a continuous procedure: the electric car simply runs NEDC cycles one after another until it can no longer follow the speed trace. The accumulated distance at the end of that test is directly reported as the range result.
In the shortened test, we first estimated the range of the electric car from a preconformity test or from the manufacturer’s declared value. Let us denote the estimated final range as \(R_{\mathrm{est}}\). The composite cycle is then designed so that its total travelled distance is divided into a dynamic part and a constant-speed part. The dynamic parts have fixed lengths, while the length of the second constant-speed segment is chosen so that the electrical energy consumed in that segment is approximately 10% of the total dischargeable energy of the REESS. In the calculation, the theoretical range contribution of the composite cycle is:
$$R_{\mathrm{composite}} = D_{\mathrm{DS1}} + D_{\mathrm{CSSM}} + D_{\mathrm{DS2}} + D_{\mathrm{CSSE}}$$
where \(D_{\mathrm{DS1}}\) and \(D_{\mathrm{DS2}}\) are the distances of the two dynamic segments, \(D_{\mathrm{CSSM}}\) is the distance of the first constant-speed segment, and \(D_{\mathrm{CSSE}}\) is the distance of the second constant-speed segment. This relationship is used to define the target distance of the shortened composite test cycle before the actual run starts. The actual distance is determined from the measured speed signal after the run because small speed-trace deviations are unavoidable.
At the end of the complete shortened run, the test data contain several complete WLTC or CLTC-P cycles. For those complete cycles, we calculate the electrical energy change of the REESS. The energy change is defined as the net electrical energy removed from the traction battery, taking into account the energy returned during regenerative braking. The measured electrical current is positive during discharge and negative during charge. Therefore, the net energy change over a complete cycle is:
$$\Delta E_{\mathrm{REESS},i} = \int_0^{t_i} U(t) \, I(t) \, \mathrm{d}t$$
where \(i\) denotes the index of the complete dynamic cycle, \(U\) is the battery terminal voltage, \(I\) is the current, and \(t_i\) is the duration of that cycle. Because the battery voltage does not change drastically during one single cycle, the expression above can be approximated by the product of average voltage and net ampere-hour throughput if needed, but in this work the instantaneous power integration was used for better accuracy.
Once the energy changes of the complete cycles are known, we calculate the individual energy consumption rates as follows:
$$EC_{\mathrm{DC},i} = \frac{\Delta E_{\mathrm{REESS},i}}{D_i}$$
where \(D_i\) is the actual travelled distance during the \(i\)-th complete dynamic cycle. However, because the battery is not charged between the different segments of the shortened composite run, not every complete cycle has the same initial state of charge. During the first cycle of the run, the battery is almost fully charged, and the regenerative braking strategy often deliberately limits the recuperated power to protect the battery. During later cycles, the battery can accept more charge, and the regeneration current increases. For this reason, the first complete cycle in a shortened run generally consumes more energy than the cycles that occur later. If we blindly used a single early cycle to extrapolate the range, we would underestimate the range. To avoid this problem, the standards define weighting factors based on the ratio of the energy change of each complete cycle to the total energy change of the entire shortened run.
For a shortened run containing \(n\) complete dynamic cycles, the weighting factor for cycle \(i\) is given by:
$$K_i = \frac{\Delta E_{\mathrm{REESS},i}}{\Delta E_{\mathrm{REESS,step}}}$$
where \(\Delta E_{\mathrm{REESS,step}}\) is the total electrical energy change of the REESS measured over the entire shortened test run from the beginning to the test-stop condition. The weighted energy consumption of the electric car is then:
$$EC_{\mathrm{DC,weighted}} = \sum_{i=1}^{n} K_i \, EC_{\mathrm{DC},i}$$
Finally, the driving range of the electric car according to the shortened procedure is obtained by dividing the total usable energy change by the weighted energy consumption:
$$R = \frac{\Delta E_{\mathrm{REESS,step}}}{EC_{\mathrm{DC,weighted}}}$$
This calculation method explains why the weighting factor can have a strong impact on the final range. If the first complete cycle consumes more electrical energy than the later cycles, its energy consumption rate is high, but its weighting factor is relatively high as well if the cycle occupies a large fraction of the total energy. In a properly designed shortened run, the later cycles are representative of the steady-state behaviour of the electric car, and the weighting factors allow one to correct for the atypical first cycle. The same mathematical framework was applied to both WLTC and CLTC-P shortened tests in this project. In the CLTC-P shortened run, four complete CLTC-P cycles were available for the weighted calculation. In the WLTC shortened run, two complete WLTC cycles were used. NEDC was different because no weighting was necessary; the measured distance was directly equal to the range.
Electrical and Current Measurement Results
The power analyser recorded the instantaneous battery current at a high sampling rate. When the electric car is accelerating or cruising at constant speed, the motor consumes energy from the battery, so the current is positive. When the vehicle decelerates with the accelerator pedal released and the brake pedal applied moderately, the electric machine operates as a generator and charges the battery, so the current is negative. The current waveform is therefore directly correlated with the dynamic segments of the cycle.
In the CLTC-P shortened test, the maximum regenerative current in the first CLTC-P cycle was only about –167 A. The cumulative time with negative current during that first cycle was only about 228 s. Starting from the second cycle, the regenerative braking system began to operate normally. The maximum regenerative currents observed in the second, third, and fourth cycles were about –204 A, –211 A, and –223 A, respectively, and the cumulative time with negative current increased to approximately 500 s for each of those cycles. This behaviour is a clear indication that the battery management system of the electric car limits regeneration when the battery is close to full charge.
In the WLTC shortened test, a similar trend was observed. The first complete WLTC cycle showed a maximum regenerative current of only –145 A and a negative-current time of only about 268 s. In the second complete WLTC cycle, once the battery had been slightly discharged, the maximum regenerative current rose to –190 A and the cumulative negative-current time increased to about 485 s. This explains why two complete cycles in a shortened procedure have different energy consumption rates despite having the same speed trace. The first cycle consumes more energy from the battery because it receives less energy back during braking. At the same time, the first cycle is affected by the slightly higher internal resistance of a fully charged battery in some chemistries.
In the NEDC continuous test, the electric car started from the fully charged state as well. In the first NEDC cycle, regenerative current was observed only after about 400 s, and the maximum current was smaller, around –84 A. In the second NEDC cycle, the energy recovery function reached almost normal operation, and from the second to the sixth cycle the maximum recovered current remained close to –132 A. After six NEDC cycles, the vehicle completed 41 full NEDC cycles before reaching the test-end criterion. The first two NEDC cycles had less recovered energy than the rest, but because so many cycles were accumulated, the impact of the first two atypical cycles on the total distance was quite small. That is another reason why the NEDC continuous test gives a comparatively stable range result.
From an energy point of view, the net electrical energy change of a cycle is lower when recuperation is active and high. The energy recuperated during braking events is stored in the battery and reused during subsequent accelerations. However, regenerative braking is not lossless: the motor, inverter, and battery each introduce losses. At low speed, aerodynamic drag and rolling resistance are lower, so the motor does less work and the recuperated energy is limited. At the same time, in a low-speed cycle such as CLTC-P, braking events are more frequent and the speeds are modest, which suits the energy recovery strategy of an urban electric car. In contrast, WLTC has high-speed driving that requires a large amount of energy to overcome aerodynamic resistance, and although aerodynamic drag partially replaces mechanical braking, the net consumption is higher.
| Cycle segment | First-cycle max regen current / A | Later-cycle max regen current / A | Negative current duration in first cycle / s | Negative current duration in later cycles / s |
|---|---|---|---|---|
| WLTC shortened | –145 | –190 | 268 | 485 |
| CLTC-P shortened | –167 | –204 to –223 | 228 | 500 to 506 |
| NEDC continuous | –84 | –132 | about 400 s until first recovery | stable after cycle 2 |
Energy Consumption Characteristics
To understand the measured range results, we separated the total battery energy change into the electrical energy supplied to the motor and the electrical energy returned to the battery. The first quantity is called output energy, and the second is the braking recovery energy. The net energy change of the battery is the difference between those two quantities. Figure 10 in the original data, which is not reproduced here, showed that for one WLTC shortened run, the constant-speed segment CSSM produced the largest output energy because the electric car travelled at 100 km/h for a long distance and no regenerative braking was present. The dynamic WLTC segments also produced a significant output, but part of that output was offset by recovered energy during decelerations. In an analogous way, for the CLTC-P shortened run, all four complete CLTC-P cycles showed approximately the same output energy values, while their recovered energies differed slightly. The last CLTC-P cycle had the largest recovered energy because the battery was sufficiently discharged and the brake management system allowed higher charging current.
From the cycle-energy analysis, we derived the average energy consumption per kilometre for a typical normalised single cycle, that is, a cycle in which regenerative braking has already reached normal operation. The values are shown below. The WLTC single-cycle energy consumption of the electric car was about 175 Wh/km. The NEDC single-cycle value was about 153 Wh/km. The CLTC-P single-cycle value was about 142 Wh/km. Thus, for the identical electric car and the same driver assistance mode, the CLTC-P cycle is the most efficient among the three, and the WLTC cycle is the most demanding. The difference between WLTC and CLTC-P in terms of specific consumption is approximately 33 Wh/km, which is roughly 23% of the CLTC-P value. This energetic advantage is exactly what creates the range advantage of 91 km mentioned earlier.
| Cycle type | Single representative cycle consumption |
|---|---|
| WLTC | 175 Wh/km |
| NEDC | 153 Wh/km |
| CLTC-P | 142 Wh/km |
One may ask whether the battery capacity was completely used in all tests. At the end of each shortened test, the electric car had approximately the same depth of discharge. The measured total usable energy change of the REESS was very similar for the WLTC and CLTC shortened tests. In Table 6 we show the measured total energy change and the final range results for the two shortened procedures.
| Procedure | Total REESS energy change / Wh | Weighted energy consumption / Wh/km | Calculated range / km |
|---|---|---|---|
| CLTC-P shortened | 68,232 | 143 | 477 |
| WLTC shortened | 68,284 | 177 | 386 |
The two total energy changes are almost equal, which confirms that the range difference is not caused by a difference in usable battery capacity. The same electric car released almost the same energy from the battery, but that energy supported very different travelled distances. During the CLTC-P cycle, the average power drawn from the battery is lower, so the battery voltage stays higher on average and the internal losses are smaller. During the WLTC cycle, the high-speed segments require high power and the internal resistance of the battery creates additional losses that reduce the total energy actually delivered to the wheels. Therefore, the same 70 kWh battery produces more useful mechanical work in the less demanding CLTC-P cycle.
Why the First Cycle Is Special
The electric car used in this test has a battery management system that is designed to protect the battery from overcharging. When the battery is at a very high state of charge, the maximum permissible charging current during regenerative braking is limited. This is why the first WLTC and CLTC-P cycles have a lower negative current and a shorter cumulative braking time than subsequent cycles. It is also the reason why the first NEDC cycle has a delayed recovery operation. In the NEDC continuous test, however, the first cycle is only one out of 41 total cycles, so it affects the final average by less than 3%. In the shortened test, the first cycle may represent a much larger share of the complete dynamic segments, especially if only four CLTC-P cycles or two WLTC cycles are used. Standards therefore require weighting factors to be applied when estimating range from shortened tests. The weighting factors ensure that the consumption rates of individual complete cycles are not treated with equal importance but according to the energy they contain in the whole test run.
For the CLTC-P shortened run with four complete cycles, the first cycle produced a maximum recuperation current of –167 A, while the fourth produced a maximum of –223 A. Consequently, the first cycle had a slightly higher net discharge energy. In the weighting calculation, the first cycle nevertheless received a weight proportional to its net discharge energy relative to the total. If we had discarded the first cycle and extrapolated using only cycles 2 to 4, the range would have been slightly longer. The standard method gives a more conservative result because it includes all complete cycles. In practice, the difference between weighting factors among CLTC-P cycles was modest, because after the first cycle the recovery function stabilised very quickly. The same observation applies to WLTC, where the first cycle showed clearly limited regeneration and was only accompanied by one later complete cycle in the shortened run. The available number of complete cycles is small, so the first-cycle effect is more critical in the WLTC shortened test. This explains why the WLTC measured energy consumption of 177 Wh/km is higher than the representative single-cycle value of 175 Wh/km, while for CLTC-P the weighted value of 143 Wh/km is very close to the 142 Wh/km representative value.
Impact of Test Mass and Road Load
The test mass directly determines the normal force on the tyres and therefore the rolling resistance. The road load coefficients were measured separately for the higher mass and lower mass configurations. In the case of the WLTC and CLTC tests, the mass was increased by 71 kg compared with the NEDC test. The additional inertia is not negligible because the dynamometer must also simulate the inertia of the vehicle during acceleration. A heavier test mass means that more traction energy is required whenever the electric car accelerates. It also means that more kinetic energy is available during braking, which can be converted back into electrical energy by the recuperation system. Since regenerative braking efficiency is not 100%, the net effect of increasing test mass is generally an increase in energy consumption per kilometre, particularly on cycles with many stops. The measured average road-load difference of about 15 N is not the full story because the inertia effect is embedded in the transient accelerations. However, for the same speed trace, a 71 kg higher mass could increase consumption by several Wh/km. In this project, WLTC and CLTC both used the higher mass, while NEDC used the lower mass. If NEDC had been performed with the same 2064 kg test mass, its range would have been slightly lower than 450 km. The ranking would still remain CLTC-P first, NEDC second, and WLTC third, but the difference between NEDC and CLTC would be smaller.
Another interesting comparison is between the WLTC and CLTC-P results, because both were performed with the same reference mass and almost the same total battery energy release. Their difference is therefore purely a consequence of the driving cycle dynamics. The maximum speed is lower in CLTC-P, and the acceleration level is gentler. At speeds below 60 km/h, aerodynamic drag is moderate, so the traction energy demand of the electric car is low. The high proportion of low-speed operation in CLTC-P also increases the opportunities for regenerative braking, because many decelerations occur from moderate speeds. In WLTC, the extra-high-speed phase often demands power above 60 kW, and the battery current is high for long periods. The losses in the battery, inverter, and motor scale roughly with the square of the current, so the WLTC cycle has higher electrical losses. Moreover, aerodynamic drag grows with the square of speed, meaning that the mechanical energy required per kilometre is much higher at 120 km/h than at 60 km/h. The difference of about 15 km/h in the average speed between WLTC and NEDC already matters; the difference between WLTC and CLTC is more than 17 km/h in average speed. If we look at the maximum speed, the WLTC maximum speed is 131.3 km/h versus 114 km/h for CLTC-P and 120 km/h for NEDC. The high-speed share is significantly larger in WLTC.
Cycle dynamics also influence the distribution of time spent in acceleration, deceleration, cruising, and idling. In the WLTC cycle, the acceleration phases are numerous and aggressive. The rate of change of speed in the high-speed and extra-high-speed phases is much higher than in NEDC. Frequent pedal movements create more transient losses in the electric machine and power electronics. During high-power accelerations, the motor operates in a less efficient region if the requested torque is far from the optimum. A similar effect occurs during hard regenerative braking: the inverter and battery are forced to accept high current, which increases the losses. The CLTC-P cycle has a more balanced speed profile that resembles everyday driving in congested and suburban traffic, so the high-efficiency operating region of the electric drivetrain is used more often. This explains the substantial energy saving.
Continuous versus Shortened Procedures
Some readers may wonder whether the continuous NEDC test method produces a range value that can be directly compared with the shortened WLTC or CLTC calculations. In the NEDC continuous test, the electric car is discharged from 100% to the test-end criterion by simply repeating identical NEDC cycles. The final distance is very clear and does not depend on weighting formulas. In the shortened WLTC and CLTC tests, however, the total distance is not read directly from the odometer because the composite cycle is intentionally shortened. Instead, the range is mathematically reconstructed from the energy consumption rate of complete WLTC or CLTC-P cycles. If the energy consumption of those cycles is estimated correctly, the calculated range should be equivalent to the range that would be obtained by running continuous WLTC or CLTC-P cycles until the battery is exhausted. In practice, the shortened procedure saves testing time while producing almost the same result as a continuous test. The requirement is that the composite cycle includes enough complete dynamic cycles and that the test-stop conditions are controlled.
Another methodological detail is the test-end criterion. In the shortened procedures, the test must be stopped when the electric car cannot follow the speed trace with the permitted tolerance or when the REESS reaches a disconnection threshold. In the NEDC continuous procedure, the test stops as soon as the vehicle speed falls below a certain value of the cycle speed. The state of charge at the stop point is not exactly a fixed percentage; therefore, the usable battery energy extracted during the test may vary slightly from one method to another. In our measurements, the total REESS energy change differed by only about 52 Wh between the WLTC and CLTC shortened tests. That is less than 0.1% of the total energy, suggesting that the test stop was determined by a similar criterion in both cases. The NEDC continuous test did not report a REESS energy quantity in the same manner, because the original standard expresses results in terms of distance and energy consumption measured from the charging system. Nevertheless, the NEDC test consumed the same physical battery energy over a distance of 450 km, giving an approximate average consumption of 151.6 Wh/km if one assumes 68,232 Wh was used. The slight discrepancy between this value and the representative single-cycle value of 153 Wh/km is due to the effect of the first two NEDC cycles and the slightly lower vehicle test mass.
Complete Range Comparison
The final measured range results are summarised below. For an identical electric car, the three test procedures produce three different range labels. The manufacturer might advertise one range based on a customer-friendly cycle, while regulator might require another range for homologation. This range variability is not a defect of the electric car but a consequence of different boundary conditions. It is important that consumers and policymakers compare range values from the same test cycle.
| Test cycle | Test procedure | Representative cycle | Final range result / km |
|---|---|---|---|
| NEDC | Continuous | NEDC | 450 |
| CLTC-P | Shortened | CLTC-P | 477 |
| WLTC | Shortened | WLTC | 386 |
From the same electric car, the CLTC-P range is 477 km, which is 91 km higher than the WLTC range. This huge difference is equivalent to roughly 23.6% of the WLTC value. The WLTC value is also 64 km lower than the NEDC value. Some of the NEDC advantage comes from the lower test mass; if the test mass had been the same, the NEDC range would be perhaps 10 to 15 km shorter, but still higher than the WLTC result. The fundamental reason is that WLTC is the most aggressive cycle of the three. The average speed is high, the acceleration rates are high, and the cycle contains a distinct high-speed phase in which aerodynamic drag dominates. The less aggressive CLTC-P cycle, which is derived from real-world Chinese driving statistics, favours the inherent efficiency of electric motors during low-speed operation.
The ranking of energy consumption per kilometre is consistent with the range ranking. WLTC gave a weighted energy consumption of about 177 Wh/km, NEDC gave about 153 Wh/km, and CLTC-P gave about 143 Wh/km. These numbers are all full-cycle averages including the low-speed urban part and the high-speed part. If one calculated only the low-speed portion of each cycle, the differences would be much smaller. The high-speed portion of WLTC is what pushes the average upward. At a steady speed of 100 km/h, an electric car with a frontal area typical of this class consumes roughly 180 to 200 Wh/km, and the constant-speed segments in WLTC and CLTC-P reflect that behaviour. In contrast, at an average speed of 30 km/h in urban traffic, the consumption may be only 100 to 120 Wh/km because aerodynamic drag is very small. The proportion of high-speed driving in each cycle is therefore a good predictor of range.
Statistical and Operational Observations
During the multiple range tests, several operational observations were made. The first observation is that the battery management system of an electric car does not allow full regenerative braking at a high state of charge. This is particularly visible at the start of a range test. If a driver tests the range of an electric car immediately after a full charge, the first few kilometres will not reflect the optimal energy recovery behaviour. The electric car will consume more energy during the first deceleration events because the braking request is partly fulfilled by the hydraulic brakes. After a few depth-of-discharge percentage points, the regenerative function becomes fully available. In shortened tests, this warm-up phenomenon is accounted for by weighting factors; in real-world driving, a driver familiar with an electric car will not notice it after a short distance.
The second observation is that the constant-speed segments in the shortened composite cycles are severe from the point of view of consumption. At a speed of 100 km/h, the electric motor must provide a continuous power that is much higher than at low speed. There is no recuperation during these segments, and the battery current remains positive for a long period. The high current causes resistive heating in the battery and cables. Over the entire shortened run, the constant-speed segments may represent a large share of the total energy consumed. The standards intentionally include these sections to simulate the range contribution of high-speed roads, which are important for range estimation. However, the length of these constant-speed sections is calculated from the expected range before the test. If the actual range differs from the predicted range, the percentage of energy consumed in the constant-speed segments can deviate from the target value. The standard tolerances help to ensure that the composite cycle remains valid.
The third observation is that the driver aid used in these tests performed very well. The speed trace was followed with an error of less than plus or minus 2 km/h for almost the entire test duration. Since the driver aid is designed to mimic a human driver, the small differences between actual speed and target speed produce correspondingly small differences in distance. The actual distance of a complete dynamic cycle may be 0.1 to 0.2 km different from the theoretical cycle distance. For example, the theoretical distance of one WLTC cycle is 23.21 km, but the measured distance of a single complete WLTC segment in the shortened run could be slightly higher or lower. The standards require us to use the actual measured distance in the energy consumption formula rather than the theoretical distance. We followed this requirement in all calculations, so the range result is not artificially biased by cycle distance errors.
Sensitivity of Range to Test Parameters
To further explore the range variability of the same electric car, we can perform a simple sensitivity calculation. Let the total battery dischargeable energy be approximately 68 kWh. If the energy consumption rate is 142 Wh/km, the range would be 479 km. If the energy consumption rate increases by 10% to 156 Wh/km, the range falls to about 436 km. If it increases by another 10% to 172 Wh/km, the range falls to about 395 km. Therefore, a 20% difference in consumption produces roughly a 17% difference in range. The measured CLTC and WLTC consumption rates differ by about 24%, which is why the range difference is 19%. This illustrative calculation can be expressed as:
$$R = \frac{E_{\mathrm{usable}}}{EC_{\mathrm{DC}}}$$
Any factor that raises \(EC_{\mathrm{DC}}\) while keeping \(E_{\mathrm{usable}}\) constant will reduce the range. In the WLTC cycle, the following factors raise \(EC_{\mathrm{DC}}\): higher aerodynamic drag force, longer time at high speed, stronger acceleration events, higher losses in the inverter, and more frequent high-power operation. In the CLTC-P cycle, the following factors lower \(EC_{\mathrm{DC}}\): lower maximum speed, more moderate accelerations, longer idle portions, and more efficient use of the electric machine. The NEDC cycle sits in between because it is a modal cycle with gentle accelerations and only one high-speed phase. If NEDC had more dynamic acceleration events, its range would move closer to WLTC.
It is also important to note that the auxiliary power consumption, if activated, would add a fixed power load. At low vehicle speeds, that fixed load would have a stronger effect on the per-kilometre consumption because the distance covered per unit time is small. In our tests, all auxiliaries were switched off, so the energy consumption was entirely due to traction and driveline losses. If auxiliaries had been switched on, the range differences between cycles might have been altered because the constant auxiliary power would make the low-speed CLTC cycle less advantageous. This explains why regulated range tests require auxiliary consumers to be turned off or set to a prescribed level.
For an electric car with a different energy recovery calibration, the range difference between WLTC and CLTC could be smaller or larger. A more aggressive regeneration strategy can recover a larger fraction of kinetic energy during deceleration, but it cannot recover energy lost to aerodynamic drag or rolling resistance. At high speed, most of the energy is spent to overcome drag, and regenerative braking cannot recover that part because it is dissipated as heat in the surrounding air. Therefore, no matter how advanced the recuperation system is, an electric car will still have substantially higher energy consumption on a cycle with a high-speed portion. This is a fundamental physics limitation common to every electric car.
Implications for Consumers and Regulators
The findings of this work have several practical implications. First, consumers should not compare range values obtained from different test cycles without accounting for their characteristics. A WLTC range value is typically more conservative than an NEDC range, while a CLTC range value may be more optimistic if the consumer often drives on motorways. Second, regulators should ensure that the chosen range test cycle represents the actual usage pattern of the market. The CLTC cycle was designed from Chinese traffic data and is therefore more realistic for Chinese cities. However, for an electric car sold in a European market, the WLTC cycle might be more representative because it contains faster motorway segments. Third, the test mass rules have a non-negligible effect. Different test masses can shift range by several percentage points even with the same cycle. Standardising the test mass across all electric cars is important for fairness of comparison.
The shortened procedure is very useful for speeding up certification tests, but it relies on accurate measurements of electrical energy. Any error in the current sensor or voltage measurement will directly affect the energy consumption and range result. In this work, we used a high-accuracy power analyser with a current sensor whose measurement uncertainty was below 1%. We also checked the offset of the current sensor before every test and after the test to avoid signal drift. The close agreement between total energy changes in the WLTC and CLTC tests confirms the quality of the measurements. The total REESS energy change in the two shortened tests differed by only 52 Wh, which is negligible.
The range values reported here were generated on a chassis dynamometer. Real-world driving range is always lower because of road traffic, weather, elevation changes, and auxiliaries such as heating and air conditioning. The dynamometer test is useful for certification and comparison, but consumers should expect a lower range in winter when heating is required, or in hilly terrain, or at sustained high speeds. Even with those caveats, the relative ranking between cycles established here remains valid because it is based on physical properties of the cycles.
Conclusions
After conducting range tests of the same pure electric car under WLTC, CLTC-P, and NEDC procedures, we summarise the main conclusions of this study. First, the instantaneous current of the traction battery is positive during acceleration and constant-speed driving, and negative during regenerative braking. The higher the speed and the stronger the acceleration, the larger the positive discharge current. During constant-speed driving, the discharge current remains stable because the road load is constant. Second, when the battery is nearly fully charged, the regenerative braking energy is limited. In all three test types, the first several cycles or the first portion of the test had smaller negative currents and shorter regenerative braking periods. Once the battery was slightly discharged, the recovery function reached normal operation. The maximum recovery current increased with the speed difference during braking events.
Third, the shortened WLTC and CLTC procedures require weighting factors to calculate the final range. The weighting factors are based on the electrical energy change of each complete cycle relative to the total energy change of the whole shortened run. The first complete cycle in a shortened run tends to have a relatively high energy consumption because regeneration is limited. The weighting formulas ensure that this atypical cycle is neither ignored nor overemphasised. Fourth, among the three cycles tested, the WLTC cycle gave the highest energy consumption and consequently the lowest range, while the CLTC-P cycle gave the lowest energy consumption and the highest range. The NEDC result was between the two. The final range values were 386 km, 450 km, and 477 km for WLTC, NEDC, and CLTC-P, respectively, with corresponding single-cycle consumption estimates of 175 Wh/km, 153 Wh/km, and 142 Wh/km.
Fifth, the range difference between WLTC and CLTC in this project was 91 km. This is a large difference and it is caused mainly by the different speed profiles. The WLTC cycle reaches a maximum speed of 131.3 km/h and contains a distinct high-speed phase. The higher aerodynamic drag at high speed cannot be recovered by regenerative braking, so the energy intake per kilometre increases. The CLTC-P cycle, by contrast, has a maximum speed of 114 km/h and a much lower average speed. The gentler accelerations of CLTC-P allow the electric motor to operate in a more efficient region. The NEDC cycle has a low average speed and gentle accelerations, but its higher test-mass equivalent in the modern procedures is slightly lower; however, if corrected for the same test mass, the NEDC range would decrease only slightly and not change the general ranking.
Finally, the results emphasise that the advertised range of an electric car is not a single fixed physical number but depends strongly on the test method and boundary conditions. Consumers, regulators, and manufacturers should always specify which cycle was used for measuring range. The same electric car can objectively have three different range labels under three different procedures, and none of them is wrong. What matters is that comparisons are made between values obtained under identical test procedures. Our work also shows that modern shortened test procedures are an efficient way to reduce testing time without sacrificing accuracy, provided that complete dynamic cycles are properly selected and the energy weighting factors are calculated carefully. With high-quality instrumentation and controlled environmental conditions, the repeatability of the measured range of an electric car can be very good; the variability caused by test procedures remains larger than the variability caused by measurement error. Understanding this variability is essential for a fair evaluation of electric car efficiency and for building confidence among consumers as the market of battery-electric vehicles continues to expand.