
This thesis addresses the need for an efficient and compact thermal management solution for small electric excavators, focusing on the interaction between the EV battery and the vehicle air-conditioning system. Electric excavators are emerging as a promising alternative to conventional diesel-powered machines due to stricter emission regulations and the rapid development of electric-vehicle technologies. However, the thermal management of electric excavators is more challenging than that of electric passenger cars because of limited installation space and high-power working conditions. The EV battery in such machines must be maintained within an appropriate temperature range, while the driver cabin also requires heating or cooling for operator comfort. A well-designed integrated thermal management system can reduce electricity consumption and extend the operation time of the machine.
In my research, I first identified the key thermal requirements of a small electric excavator by analyzing its working cycle. I then experimentally measured the internal resistance, specific heat capacity and entropic heat coefficient of the selected lithium-ion cell, and used these parameters to build a heat-generation model for the EV battery. The thermal behaviour of the battery pack was investigated through three-dimensional CFD simulations in Ansys Fluent, which guided the design of the liquid-cooled cold plate. Based on the three-dimensional results, I constructed a one-dimensional model of the liquid cooling circuit in Siemens Amesim and validated it against the CFD output. I further added an air-conditioning model, a driver-cabin model and a plate heat exchanger to create a fully interactive thermal management system. Finally, I compared two control strategies, namely staged compressor control and multi-mode dynamic switching with PID power regulation, to evaluate their performance in terms of cabin comfort, battery temperature, compressor energy consumption and machine endurance.
The remainder of this thesis is organised as follows. Section 2 introduces the architecture of the interactive thermal management system and the selection of its major components. Section 3 describes the experiments for measuring cell heat-generation parameters. Section 4 presents the design of the liquid-cooling plate and the CFD-based optimization of its flow channel. Section 5 discusses the one-dimensional system-level simulation in Amesim and the comparative control strategy analysis. Section 6 summarizes the conclusions and suggests directions for future work.
Review of Existing Research
In recent years, the international development of small electric excavators has progressed rapidly. Several leading construction-machinery manufacturers have introduced compact electric excavators with battery capacities between 30 kWh and 110 kWh. These machines typically employ a permanent-magnet synchronous motor to drive a hydraulic pump, replacing the diesel engine of a conventional excavator. The powertrain architecture of such machines is similar to that of modern battery electric vehicles. Table 1 summarizes the typical specifications of small electric excavators in the 5-to-8-tonne class.
| Parameter | Typical range | Remarks |
|---|---|---|
| Operating weight | 5800–8000 kg | Compact class |
| Battery capacity | 39–109 kWh | Space-limited installation |
| System voltage | 300–400 V | Similar to passenger EVs |
| Drive motor power | 32–50 kW | Peak value |
| Indicative runtime | 4–6 h | Depending on duty cycle |
Battery thermal management has been studied extensively in the context of electric vehicles. Three main cooling technologies have been developed: air cooling, liquid cooling and phase-change-material cooling. Air cooling is simple and inexpensive, but its heat-transfer coefficient is relatively low. Liquid cooling offers much better cooling performance and is now widely adopted in commercial EV battery packs. Phase-change materials provide good temperature uniformity but suffer from high cost and increased system weight and complexity. Table 2 compares the three heat-management technologies for EV battery systems.
| Criterion | Air cooling | Liquid cooling | Phase-change material |
|---|---|---|---|
| Heat-transfer capability | Low | High | Medium |
| Structural complexity | Low | Medium | High |
| Cost | Low | Medium | High |
| Temperature uniformity | Fair | Good | Excellent |
| Energy consumption | Moderate | Moderate | Low |
For the liquid cooling of EV batteries, the shape of the cold-plate flow channel has received considerable research attention. Straight channels, serpentine channels, multi-branch channels and pin-fin structures have been compared in terms of maximum cell temperature, temperature difference and pressure drop. Many studies agree that a serpentine channel can improve the temperature uniformity of the EV battery pack. More recently, a symmetric serpentine arrangement was proposed to reduce pressure loss while preserving thermal performance. My work extends this idea to the restricted space of a small excavator and introduces an improved symmetric serpentine channel in which straight segments are moved closer to the inlet. This modification improves the temperature distribution without increasing pumping power.
At the vehicle level, several authors have simulated integrated thermal management systems for electric vehicles using one-dimensional software such as Amesim and KULI. Those studies often combine the air-conditioning circuit, the motor cooling circuit and the EV battery cooling circuit into one thermal architecture. The compressor is a major energy consumer, so reducing compressor work is critical to achieving a longer operating time. However, only a limited number of studies have applied such ideas to construction machinery. Therefore, my work attempts to transfer the integrated thermal-management concept from the automotive domain to compact electric excavators and to evaluate its system-level performance under realistic digging cycles.
Interactive Thermal Management System Analysis
The conventional air-conditioning system of an excavator consists of a compressor, a condenser, a thermal expansion valve, an evaporator and a receiver-dryer. The compressor elevates the pressure and temperature of the refrigerant vapour. The condenser rejects heat to ambient air and changes the refrigerant into a high-pressure liquid. The expansion valve then reduces the pressure, producing a low-temperature two-phase mixture. In the evaporator, the refrigerant absorbs heat from the cabin air and returns to the compressor as a superheated vapour.
In the EV battery liquid-cooling circuit, a coolant pump drives a 50 % ethylene-glycol–water mixture through cold plates attached to the battery cells. The coolant absorbs heat from the cells and then transports it to a plate heat exchanger. On the other side of the plate heat exchanger, refrigerant evaporates and absorbs the heat from the coolant. Therefore, the refrigeration circuit of the air conditioner and the coolant circuit of the EV battery share a similar structure with the same set of key components.
Based on this similarity, I have combined the two cooling loops into one interactive system. As shown in the architecture, the refrigerant leaving the expansion valve is divided into two branches. One branch goes to the cabin evaporator, while the other flows through the plate heat exchanger to cool the coolant. This arrangement eliminates the need for a second compressor and saves valuable installation space. The operating state is determined by the opening of two electronic expansion valves and the rotational speed of the compressor. The control objective is to maintain the EV battery temperature and cabin temperature within acceptable ranges while minimizing compressor power consumption.
The overall heat load of the system can be expressed as:
$$ Q_{\text{total}} = Q_{\text{cabin}} + Q_{\text{battery}} ,$$
where \( Q_{\text{cabin}} \) is the air-conditioning load of the driver cabin and \( Q_{\text{battery}} \) is the heat generated by the EV battery.
The cabin heat load is estimated using the empirical formula:
$$ Q_{\text{cabin}} = V_{\text{cab}} \, \Delta T \, k + Q_d ,$$
where \( V_{\text{cab}} \) is the volume of the cabin, \( \Delta T \) is the temperature difference between indoor and outdoor air, \( k \) is the heat-transfer coefficient of the cabin structure, and \( Q_d \) represents additional heat sources such as solar radiation, electric motors and the operator. For the excavator cabin considered here, \( V_{\text{cab}} \approx 2.6~\text{m}^3 \), \( k = 0.035~\text{kW m}^{-3}\text{K}^{-1} \), \( \Delta T = 9~\text{K} \) and \( Q_d = 1~\text{kW} \), yielding a cabin load of approximately 1.74 kW.
The EV battery heat generation during a digging cycle is not constant. In this study, the peak heat load is assumed to be twice the average value obtained from constant-current discharging, and a safety factor of 1.2 is applied. The design heat load of the EV battery cooling loop is therefore about 1.87 kW. Thus, the total required cooling capacity is close to 3.61 kW.
Component Selection
On the basis of the calculated heat load, I selected a hermetic scroll compressor designed for electric vehicle air-conditioning systems. The main specifications of the selected compressor are listed in Table 3.
| Item | Value |
|---|---|
| Compressor type | Hermetic scroll |
| Refrigerant | R134a |
| Displacement | 34 cm³ |
| Speed range | 1000–6000 rpm |
| Nominal voltage | 312 V DC |
| Rated input power | 3 kW |
| Cooling capacity at 3000 rpm | 3730 W |
For the condenser, I used a parallel-flow micro-channel heat exchanger. For the evaporator, I chose a finned U-tube heat exchanger. The plate heat exchanger was selected with a nominal heat-transfer capacity of 3 kW, which is sufficient to transfer heat from the coolant to the refrigerant. The electric expansion valves have an orifice diameter of 1.65 mm and a maximum opening area of 1.13 mm². The refrigerant R134a is used throughout the model.
Experimental Measurement of EV Battery Cell Parameters
Accurate thermal simulation of the EV battery pack depends on the internal resistance, specific heat capacity and entropic heat coefficient of the individual cells. In this study, I used a commercial prismatic lithium iron phosphate cell with a nominal voltage of 3.2 V and a rated capacity of 52 Ah. The cell has a length of 148 mm, width of 28 mm and height of 115 mm. The electrode material provides high thermal stability and low cost, which is attractive for construction machinery.
During discharge, heat is generated in the cell by irreversible processes such as ohmic heating and polarization, and by the reversible entropy change of the electrochemical reaction. The total heat-generation rate can be described by the Bernardi equation:
$$ q = \frac{1}{V_{\text{cell}}} \left( I^2 R + I T \frac{\partial U_{ocv}}{\partial T} \right), $$
where \( q \) is the volumetric heat-generation rate, \( I \) is the discharge current, \( R \) is the internal resistance, \( T \) is the cell temperature, \( V_{\text{cell}} \) is the cell volume and \( \partial U_{ocv}/\partial T \) is the entropy coefficient.
I measured the internal resistance using the hybrid pulse power characterization (HPPC) method. In this test, the cell was first fully charged and then discharged with a current pulse of 1C for 10 seconds, followed by a rest period and a regenerative charge pulse of 0.75C for 10 seconds. The voltage jump at the beginning of the discharge pulse was divided by the pulse current to obtain the DC resistance. The cell was then discharged to the next state of charge (SOC) level, and the pulse test was repeated. Table 4 lists the measured internal resistance values at different SOC levels.
| SOC (%) | Voltage before pulse \(U_A\) (V) | Voltage after 10 s \(U_C\) (V) | Voltage drop (V) | Internal resistance (mΩ) |
|---|---|---|---|---|
| 100 | 3.335 | 3.212 | 0.123 | 2.37 |
| 90 | 3.327 | 3.223 | 0.104 | 2.00 |
| 80 | 3.326 | 3.224 | 0.102 | 1.96 |
| 70 | 3.322 | 3.213 | 0.109 | 2.10 |
| 60 | 3.295 | 3.191 | 0.104 | 2.00 |
| 50 | 3.286 | 3.177 | 0.109 | 2.10 |
| 40 | 3.284 | 3.169 | 0.115 | 2.21 |
| 30 | 3.272 | 3.151 | 0.121 | 2.33 |
| 20 | 3.224 | 3.095 | 0.129 | 2.48 |
| 10 | 3.155 | 3.004 | 0.151 | 2.90 |
| 0 | 2.793 | 2.587 | 0.206 | 3.96 |
The measured cell resistance at 50 % SOC was 2.10 mΩ, which is within the specification range of the cell datasheet. This confirms the validity of the measurement procedure. A polynomial expression was fitted to describe the resistance as a function of SOC.
To measure the specific heat capacity, I wrapped the cell with thermal insulation material and placed it inside a constant-temperature chamber. The cell was discharged at different constant-current rates for exactly 20 minutes, and the surface temperature was recorded with eight thermocouples. Assuming that all the heat generated by the cell is absorbed by the cell itself, the energy balance can be written as:
$$ m C_p \frac{dT}{dt} = I^2 R + I T \frac{\partial U_{ocv}}{\partial T}.$$
After dividing both sides by \( I \), this becomes:
$$ \frac{1}{I} \frac{dT}{dt} = \frac{R}{m C_p} I + \frac{T}{m C_p} \frac{\partial U_{ocv}}{\partial T}. $$
If the temperature rise is small, the term on the right-hand side involving the entropy coefficient can be considered nearly constant during the test. Therefore, the quantity \( (1/I)(dT/dt) \) should vary linearly with the discharge current. Table 5 summarizes the measured temperature rises for discharge rates between 0.2C and 1C.
| Discharge rate (C) | Current (A) | Average temperature rise (K) | \((1/I)(\Delta T/\Delta t)\) (K A⁻¹ s⁻¹ ×10⁻⁶) |
|---|---|---|---|
| 0.2 | 10.4 | 1.08 | 0.87 |
| 0.4 | 20.8 | 2.41 | 0.97 |
| 0.6 | 31.2 | 4.30 | 1.15 |
| 0.8 | 41.6 | 6.81 | 1.36 |
| 1.0 | 52.0 | 10.05 | 1.61 |
A linear fit of the data in Table 5 gives:
$$ \frac{1}{I}\frac{dT}{dt} = 1.798 \times 10^{-6} I + 6.31 \times 10^{-5}, $$
with a coefficient of determination \( R^2 = 0.978 \). By comparing the fitted slope with the theoretical expression, the specific heat capacity is obtained as:
$$ C_p = \frac{R}{m \times 1.798 \times 10^{-6}} \approx 1405~\text{J kg}^{-1}\text{K}^{-1}. $$
Using the computed specific heat capacity, the entropic heat coefficient was determined to be approximately \( 2.6 \times 10^{-4}~\text{V K}^{-1} \). The heat-generation rate of the cell can then be expressed by:
$$ Q_1 = I^2 R + 2.6 \times 10^{-4} I T . $$
To validate these parameters, I established a natural-convection model of a single cell in Ansys Fluent. The cell was modelled as a homogeneous solid with anisotropic thermal conductivity. The material properties used in the simulation are listed in Table 6.
| Property | Value |
|---|---|
| Density | 1993.5 kg m⁻³ |
| Specific heat capacity | 1405 J kg⁻¹ K⁻¹ |
| Thermal conductivity in x/y/z | 14.9 / 0.9 / 14.9 W m⁻¹ K⁻¹ |
| Convective heat-transfer coefficient | 5 W m⁻² K⁻¹ |
Simulations were run for discharge rates of 0.2C, 0.4C, 0.6C, 0.8C and 1C at an initial temperature of 30 °C. The simulated temperature evolution was compared with the measured data from the discharge experiments. The relative error between the simulated and measured temperature rise stayed below 10 % for most of the discharge time, which confirmed that the measured internal resistance and specific heat capacity are sufficiently accurate for system-level simulations.
Design of the Liquid-Cooling System for the EV Battery
After validating the cell parameters, I designed the EV battery pack for a compact electric excavator. The pack consists of 420 cells arranged in a 105-series and 4-parallel configuration. The cells are placed on their sides in three layers, with 35 cells in each row and four columns. The total energy capacity of the battery pack is 69.888 kWh, and the system voltage is 336 V. The outer dimensions of the pack are approximately 1014 mm × 444 mm × 510 mm. Table 7 gives the final EV battery specifications.
| Parameter | Value |
|---|---|
| Configuration | 105S4P |
| Number of cells | 420 |
| Voltage | 336 V |
| Charge capacity | 208 Ah |
| Energy | 69.888 kWh |
| Dimensions | 1014 × 444 × 510 mm |
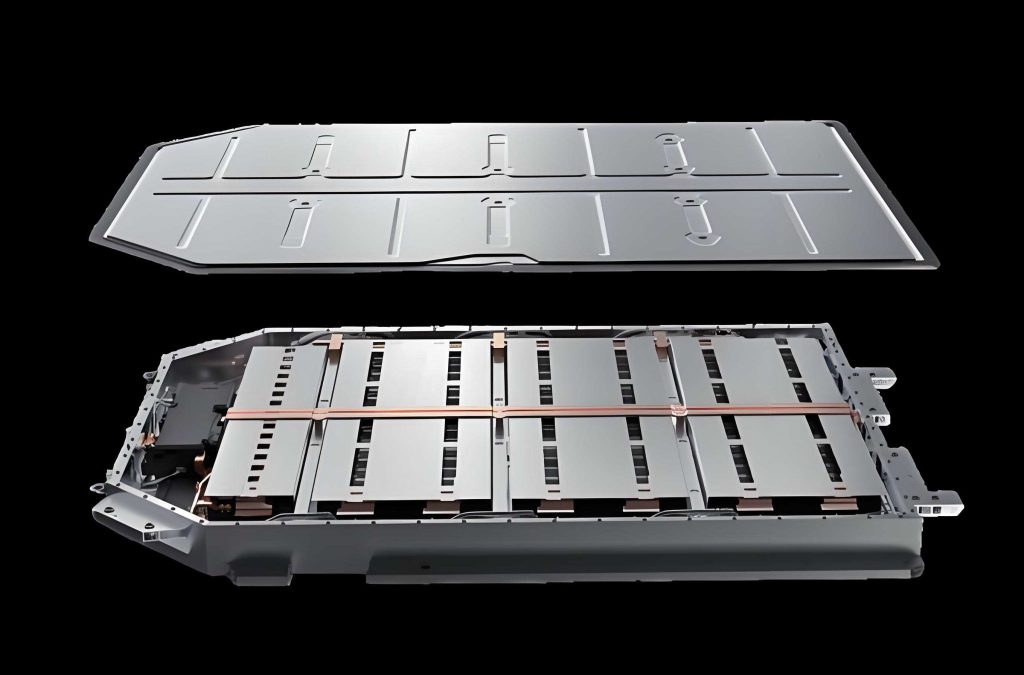
Two liquid-cooled plates are initially placed between the adjacent cell columns. The cold plate length is 1014 mm, width 444 mm and thickness 15 mm. The flow channel within the plate is a symmetric serpentine structure, which can be decomposed into four O-shaped loops connected by straight segments. The channel has a circular cross-section with a diameter of 10 mm. Each O-shaped loop has a radius of 55 mm, and the straight segments have lengths between 32 mm and 142 mm. Coolant enters and leaves the plate from ports on the same side, and two identical plates are used in the pack.
I performed a transient computational fluid dynamics (CFD) simulation of the complete battery pack in Ansys Fluent. The simulation condition assumes an ambient temperature of 27 °C and a constant discharge current of 0.25C, which represents a four-hour continuous discharge. The coolant flow rate is 10 g per second with an inlet temperature of 20 °C. The battery cooling requirement is to keep the maximum cell temperature below 35 °C and the temperature difference between cells below 5 K.
The governing equations for the fluid flow and heat transfer are the continuity, momentum and energy equations:
$$ \frac{\partial \rho}{\partial t} +
abla \cdot (\rho \mathbf{V}) = 0 ,$$
$$ \frac{\partial (\rho u)}{\partial t} +
abla \cdot (\rho u \mathbf{V}) = -\frac{\partial p}{\partial x} + \frac{\partial \tau_{xx}}{\partial x} + \frac{\partial \tau_{yx}}{\partial y} + \frac{\partial \tau_{zx}}{\partial z} + \rho f_x ,$$
$$ \frac{\partial (\rho e)}{\partial t} +
abla \cdot \left[ \mathbf{V} \left( \rho e + p \right) \right] =
abla \cdot \left( k
abla T \right) + \Phi ,$$
where \( \rho \) is the density, \( \mathbf{V} \) is the velocity vector, \( p \) is pressure, \( \tau_{ij} \) are the viscous stress components, \( e \) is the internal energy, \( k \) is thermal conductivity and \( \Phi \) is the viscous dissipation function. Since the coolant flow is turbulent, the realizable \( k-\varepsilon \) model with standard wall functions was used to close the Reynolds-averaged Navier–Stokes equations.
Before presenting the final results, I performed a grid-independence study to ensure that the numerical solution does not depend on the mesh resolution. Five different mesh densities were generated, and the pressure drop and maximum cell temperature were monitored. The results of the grid-independence check are summarized in Table 8.
| Mesh case | Number of cells (×10⁴) | Pressure drop 1 (Pa) | Pressure drop 2 (Pa) | Maximum temperature (K) |
|---|---|---|---|---|
| Case 1 | 491 | 307.4 | 307.7 | 348.8 |
| Case 2 | 688 | 304.5 | 304.0 | 310.2 |
| Case 3 | 854 | 305.1 | 305.5 | 310.3 |
| Case 4 | 1011 | 304.5 | 304.0 | 310.2 |
| Case 5 | 1247 | 304.2 | 304.0 | 310.2 |
The differences between Case 4 and Case 5 are less than 0.1 %, so Case 4 was chosen as the final mesh for all subsequent simulations.
The initial simulation showed that the original vertical plate arrangement was unable to meet the heat-dissipation requirement. Although the cells close to the cold plates were well cooled, most of the cell volume remained at a temperature above the desired threshold. The maximum cell temperature reached 310.24 K, which corresponds to 37.09 °C. The problem is caused by the high thermal resistance in the thickness direction of the side-laid cells. Heat generated at the centre of the cell cannot easily reach the vertical cold plate, because the effective thermal conductivity in that direction is only 0.9 W m⁻¹ K⁻¹.
I therefore changed the orientation of the cold plates and placed them horizontally on the upper and lower surfaces of the battery module. The improved arrangement increases the contact area and shortens the heat-conduction path from the cell centre to the cooling surface. Four cell columns are now placed between two broad cold plates, and the plate width is increased from 444 mm to 510 mm to cover the full top and bottom surfaces of the module.
The first design of the horizontal cold plate still used an O-shaped and straight-channel combination. The basic fluid domain consists of a sequence of straight segments and four O-shaped loops. This configuration is symmetrical with respect to the central line of the plate. The length of the first inlet-side straight segment was varied in several design iterations to adjust the cooling capacity along the flow path. The goal is to avoid overcooling the inlet region and to allow the coolant to absorb more heat in the central region of the EV battery. This idea led to a modified channel called the improved symmetric serpentine flow channel, in which the straight segments are moved towards the entrance so that the initial O-shaped loop is delayed.
I compared six different channel designs with the same total channel length and curvature. The differences between these designs are the arrangement of the straight and O-shaped channel segments along the length of the plate. Table 9 summarizes the simulation results for the six designs.
| Design | Maximum cell temperature (K) | Minimum cell temperature (K) | Maximum temperature difference (K) | Cell temperature standard deviation (K) | Fluid pressure drop (Pa) |
|---|---|---|---|---|---|
| Initial | 310.24 | — | — | — | 304.5 |
| Scheme 1 | 307.62 | 299.29 | 8.33 | — | 322.7 |
| Scheme 2 | 307.57 | 299.89 | 7.68 | 2.02 | 322.2 |
| Scheme 3 | 306.85 | 300.06 | 6.79 | 1.79 | 322.2 |
| Scheme 4 | 306.92 | 300.66 | 6.26 | 1.62 | 322.3 |
| Scheme 5 | 306.88 | 300.96 | 5.92 | 1.54 | 322.2 |
| Scheme 6 | 305.92 | 300.94 | 4.98 | 1.32 | 321.4 |
The improved symmetric serpentine channel of Scheme 6 meets the design requirements. The maximum cell temperature is 305.92 K, which is below 308.15 K, and the maximum temperature difference between cells is only 4.98 K, which is also below the 5 K limit. The pressure drop remains close to the value of Scheme 1, indicating that the modification does not increase cooling energy consumption. Figure 4.10 shows that the temperature distribution becomes much more uniform when the straight segments are moved closer to the inlet side. This confirms that the improved symmetric serpentine channel is an effective design for the liquid cooling of the excavator EV battery.
One-Dimensional Modelling and System Simulation
For system-level simulation of the complete thermal management architecture, I used the Siemens Amesim platform. One-dimensional simulation treats each component as a lumped-parameter model and connects the components through fluid pipes and signal lines. This approach greatly reduces the computational cost compared with three-dimensional CFD, making it suitable for long-duration simulations of the entire machine thermal system.
I first built a one-dimensional model of the EV battery liquid-cooling circuit. The electric circuit contains one series-connected battery pack model equivalent to 105 cells connected in series. Four such packs are connected in parallel and supplied with a constant discharge current of 52 A. The initial SOC is set to 100 %, and the cell resistance is represented by a constant value of 2.4 mΩ, as derived from the experiments. The coolant circuit includes a constant mass-flow source of 10 g/s at an inlet temperature of 20 °C. The flow channels are represented by pipe elements with an inner diameter of 10 mm and a total equivalent length of 4.876 m. The heat conduction between the battery cells and the cold plate is described by a thermal resistance network. The battery pack is initialized at a temperature of 27 °C.
I validated this one-dimensional model by comparing its battery-temperature prediction with the three-dimensional Fluent result for Scheme 6. The relative error between the two models remained within the range of approximately -2.6 % to 0. The final temperature error was less than 1 %. The difference is mainly explained by the simplified constant-resistance assumption in the one-dimensional model, whereas the CFD model includes the variation in resistance with SOC. Despite this deviation, the agreement is sufficiently good to confirm the reliability of the one-dimensional model.
Next, I constructed a one-dimensional model of the refrigerant loop. The compressor is a fixed-displacement scroll type with a displacement of 34 cm³ and variable speed input. The condenser is modelled as a parallel-flow micro-channel heat exchanger with four layers of tubes. The condenser fan is modelled as a humid-air source at an ambient temperature of 30 °C and a mass-flow rate of 0.55 kg/s. The expansion valve is represented by an electronically controllable variable orifice whose opening signal ranges from 0 to 1. The evaporator is a plate-fin heat exchanger with a U-shaped refrigerant path.
The compressor model is governed by the following equations:
$$ \dot m = \rho_{\text{suc}} \, V_{\text{disp}} \, N \, \eta_v ,$$
$$ h_{d} = h_{s} + \frac{h_{d,is} – h_{s}}{\eta_{is}}, $$
where \( \dot m \) is the mass-flow rate, \( \rho_{\text{suc}} \) is the suction density, \( V_{\text{disp}} \) is the displacement, \( N \) is the rotational speed, \( \eta_v \) is the volumetric efficiency, \( h_d \) is the discharge enthalpy, \( h_{d,is} \) is the isentropic discharge enthalpy, \( h_s \) is the suction enthalpy and \( \eta_{is} \) is the isentropic efficiency.
After setting up the refrigerant loop, I performed a series of simulations at different compressor speeds to determine the cooling-capacity curve. The resulting relationship between the compressor speed and the cooling capacity is non-linear. In the speed range from 1000 to 4000 rpm, the cooling capacity increases almost linearly with speed. In the range from 4000 to 8000 rpm, the rate of increase in cooling capacity gradually declines, because the refrigerant-side pressure drop and inefficiencies become more pronounced at high flow rates. At 8000 rpm, the cooling capacity reaches about 4207 W, which comfortably exceeds the total heat load of 3606 W.
The cabin model used in Amesim considers the sensible and latent heat loads of the air inside the driver cabin. In the simulation, the initial cabin temperature is set to 70 °C to represent a vehicle exposed to intense summer solar radiation. Fresh air and recirculated air are mixed in the cabin ventilation unit. The cabin volume is taken as 2.2 m³ and the wall heat capacity is 7000 J/K.
The plate heat exchanger model was calibrated using the built-in calibration tool of Amesim. I used five sets of experimental data covering different coolant and refrigerant flow rates. After iterative optimization, the relative error between the simulation and the experiments was reduced to an acceptable level. The average heat-transfer error was 1.68 %, and the maximum pressure-drop error was 1.16 %. The calibrated model therefore predicts the coupled heat exchange between the refrigerant loop and the EV battery coolant loop with satisfactory accuracy.
Simulated Driving and Hydraulic Load Profile
The electricity consumption of the thermal management system is strongly influenced by the operating state of the electric excavator. To simulate a realistic digging cycle, I extracted the pressure and flow-rate data of the hydraulic main pump from a diesel-powered excavator of the same tonnage in a field digging test. The hydraulic power is calculated as the product of the pump pressure and the pump flow rate. The output power of the drive motor is then calculated from:
$$ P_{\text{motor}} = \frac{P_{\text{hydraulic}}}{\eta_{\text{pump}} \, \eta_{\text{motor}}}, $$
where \( \eta_{\text{pump}} \) is the pump efficiency and \( \eta_{\text{motor}} \) is the motor efficiency. I took the pump efficiency as 0.90 and the motor efficiency as 0.95. The drive-motor power profile was loaded into the model as a periodic signal representing one complete excavation cycle.
In addition, the power consumption of the coolant pump, condenser fan and blower fan were taken as 30 W, 50 W and 50 W, respectively. The total auxiliary power is small compared with the compressor power but it contributes to the energy consumption of the system.
Compressor Stage Control Strategy
In the first control strategy, the compressor operates in four discrete power stages: 0, 1, 2, 3 and 4 kW. The two electronic expansion valves are controlled separately. When the cabin temperature is below 25 °C, the cabin expansion-valve signal is set to 0; when the cabin temperature exceeds 27 °C, the signal is set to 1. Between these two temperatures, the valve opening is linearly interpolated. A similar rule is applied to the EV battery side using the battery temperature limits of 30 °C and 32 °C. The sum of the two valve-opening signals determines the compressor power stage. Table 10 summarizes the staging logic.
| Sum of valve signals \(S_1+S_2\) | Compressor input power (kW) |
|---|---|
| 0 | 0 |
| 0 – 0.5 | 1 |
| 0.5 – 1.5 | 2 |
| 1.5 – 2 | 3 |
| 2 | 4 |
Using this staged strategy, the simulated cabin temperature decreases quickly from 70 °C to approximately 26 °C. The EV battery temperature initially rises and then falls after reaching a peak of about 30.55 °C. The compressor power switches frequently between the 1 kW and 2 kW stages, which causes repeated oscillation in the expansion-valve opening. Over a 7200-second simulation, the compressor consumed approximately 3670 Wh, and the battery SOC decreased to 46.38 %. The total energy consumption of the thermal system was 37.47 kWh. The compressor accounts for nearly one-tenth of the total energy drawn from the EV battery, which leaves considerable room for optimization.
Multi-mode Dynamic Switching Control Strategy
To avoid frequent switching of the compressor power and to prioritize the safety of the EV battery under high-temperature conditions, I designed a multi-mode dynamic switching control strategy combined with PID power regulation. Three operation modes are defined, as listed in Table 11.
| Mode | Entry condition | Compressor power | Valve opening \(S_1\) | Valve opening \(S_2\) |
|---|---|---|---|---|
| Battery priority mode | \(T_{bat} \ge 32^{\circ}C\) | 4000 W | 0.5 | 1.0 |
| Cabin priority mode | \(T_{cab} \ge 30^{\circ}C\) | PID controlled | 1.0 | 0.5 |
| Balanced mode | \(T_{bat}<32^{\circ}C\), \(T_{cab}<30^{\circ}C\) | PID controlled | 0.5 | 0.5 |
In the battery priority mode, the EV battery expansion valve is fully opened and the compressor operates at its maximum power. In the cabin priority mode, the cabin valve is fully opened while the compressor power is adjusted by a PID controller. In the balanced mode, both valves are half opened and the same PID controller moderates the compressor power. The mode-switching logic was implemented in Amesim using a finite-state-machine block. The PID controller input is the weighted sum of the cabin-temperature deviation from 26 °C and the battery-temperature deviation from 31 °C.
I simulated the multi-mode dynamic switching strategy under the same ambient condition of 30 °C for 7200 seconds. The results show that the cabin temperature drops below 30 °C within the first 100 seconds and then stabilizes near 25.7 °C. The EV battery temperature continues to rise slowly and reaches 31.24 °C at the end of the simulation. The compressor power increases to about 2750 W immediately after startup but then falls quickly to approximately 800 W. During the remaining time, the compressor power increases gradually to about 845 W. At the end of the 7200-second period, the compressor consumed approximately 1657 Wh. This represents a 54 % reduction in compressor energy consumption compared with the staged control strategy. The total energy consumption of the system was 35.37 kWh and the EV battery SOC decreased to 49.38 %, which corresponds to an estimated 5.94 % improvement in machine endurance.
I continued the simulation beyond 7200 seconds until the EV battery SOC reached zero. The total runtime was approximately 13755 seconds, which corresponds to 3 hours and 49 minutes. Near the end of the discharge, when the battery temperature exceeded 32 °C, the system switched to the battery priority mode and the compressor power increased to 4000 W. Because the EV battery was nearly depleted, however, the battery temperature continued to rise slightly. The cabin temperature remained stable at approximately 25.3 °C throughout the end of the test. The results indicate that the multi-mode strategy gives sufficient thermal protection to the EV battery during normal operation.
I also evaluated the system under a more severe ambient temperature of 32 °C. In this case, the system remained in the battery priority mode after the battery temperature reached the threshold. The maximum battery temperature was limited to about 32.3 °C, which is only slightly above the upper comfort threshold. The cabin temperature stabilized near 27.8 °C, which is higher than the ideal cabin temperature, but still acceptable in extremely hot weather if the ambient temperature is high. The total runtime in this harsh condition was about 11780 seconds, which is 14.4 % shorter than the runtime at 30 °C ambient. This confirms that the ambient temperature has a significant impact on both the thermal load and the energy consumption of the interactive thermal management system.
Conclusions and Future Work
In this thesis, I have presented a complete simulation framework for developing an interactive thermal management system between the EV battery and the air-conditioning loop of a small electric excavator. The main conclusions are as follows.
First, the internal resistance of a commercial prismatic lithium iron phosphate cell was measured by the HPPC method, and the specific heat capacity was derived from constant-current discharge experiments in an adiabatic environment. The measured parameters were successfully applied to a natural-convection cell model, and the simulation error remained below 10 % compared with experimental discharge temperature curves. The proposed measurement and validation procedure is therefore a reliable basis for EV battery thermal simulation.
Second, a liquid-cooling plate with an improved symmetric serpentine flow channel was designed for the EV battery pack. The improved channel, produced by relocating the straight flow segments closer to the coolant inlet, significantly improves temperature uniformity without increasing the pressure drop. After optimization, the maximum temperature difference between the cells was reduced to less than 5 K, thereby satisfying the thermal design requirements of the EV battery.
Third, the one-dimensional Amesim model of the complete interactive thermal management system was validated against the CFD result. The multi-mode dynamic switching strategy combined with PID compressor control can greatly reduce the compressor energy consumption while maintaining acceptable temperatures in both the driver cabin and the EV battery. At an ambient temperature of 30 °C, the improved control strategy reduced the compressor energy consumption by nearly half and extended the estimated endurance of the excavator by about 5.94 %.
There are several directions for future work. The proposed cooling plate and battery layout should be verified experimentally using a physical test rig. The current system only considers the cooling mode for summer conditions; winter heating and low-temperature battery insulation should be included in future research. The hydraulic oil and drive-motor heat could also be integrated into the thermal management architecture to improve waste-heat utilization. Finally, more advanced intelligent control algorithms, such as model predictive control, could further reduce the energy consumption of the compressor and the associated pumps and fans.