
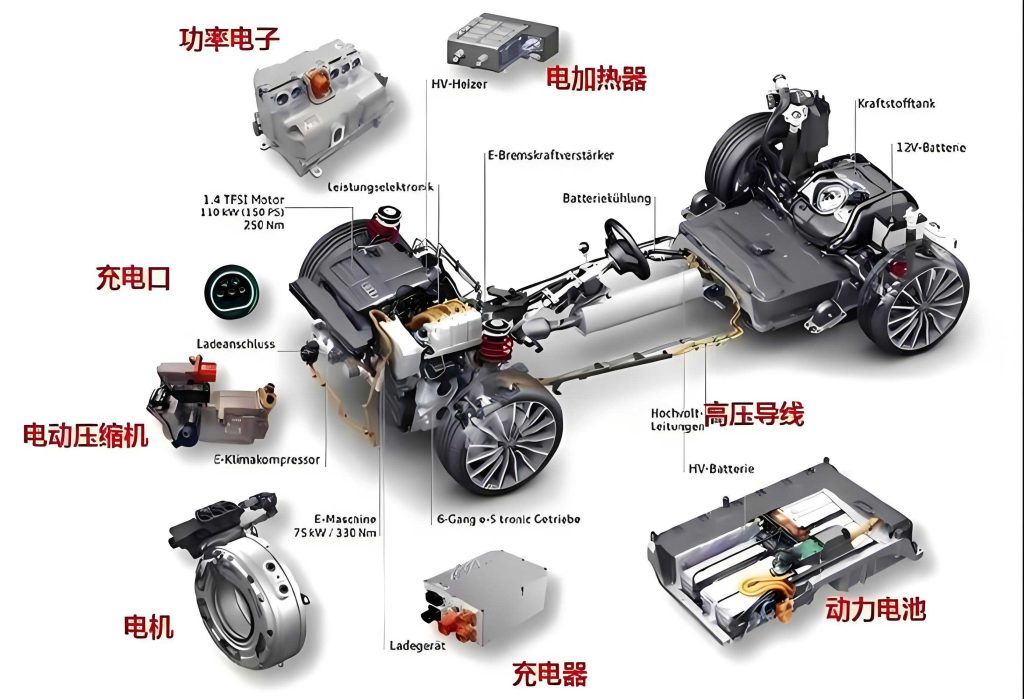
The thermal management system is a critical subsystem in a battery electric vehicle, directly impacting battery life, cabin comfort, and overall vehicle efficiency. Within this system, the compressor is the most energy-intensive component, responsible for driving the refrigeration cycle. Among various compressor technologies, the scroll compressor has emerged as the dominant choice for modern battery electric vehicle air conditioning and heat pump systems due to its inherent advantages of high efficiency, compactness, and low vibration. As the market demands higher energy efficiency, greater reliability, and improved NVH (Noise, Vibration, and Harshness) performance, a profound understanding of the internal thermodynamic processes, particularly the pressure distribution within the scroll chambers, becomes paramount for advanced design and optimization.
The compression process in a scroll compressor is inherently complex. A notable phenomenon observed in both research and practice is the asymmetric pressure distribution between the two symmetrical pairs of compression chambers. This asymmetry is not a random occurrence but is fundamentally linked to specific geometric features of the scroll wrap, such as unequal wrap termination angles, the design of discharge and pressure relief ports, and the presence of “crescent” or “bypass” slots. This asymmetric pressure distribution can be a significant source of pressure pulsations, exacerbate leakage flows, influence the dynamic loading on the orbiting scroll, and ultimately affect the compressor’s overall performance and acoustics. Therefore, a systematic investigation into the causes and characteristics of this asymmetric behavior is essential for developing next-generation, high-performance compressors for battery electric vehicle applications.
1. Mathematical Modeling Methodology
To investigate the asymmetric pressure dynamics, a comprehensive mathematical model encompassing geometric analysis and thermodynamic processes is established. The model is based on a specific scroll compressor designed for a battery electric vehicle, with its profile constructed from circle involutes and modified with symmetrical arcs at the wrap ends.
1.1 Geometric Analysis and Chamber Definition
The geometric model is founded on the classic scroll profile theory. The key parameters are defined in a coordinate system fixed on the fixed scroll. A primary source of asymmetry in the studied compressor is the difference in the inner wrap termination angles between the fixed and orbiting scrolls. The main geometric parameters are summarized in Table 1.
| Parameter | Symbol/Description | Value |
|---|---|---|
| Displacement per Revolution | $V_{s}$ | 45 cm³/rev |
| Fixed Scroll Inner Termination Angle | $\phi_{fs}$ | 760° |
| Orbiting Scroll Inner Termination Angle | $\phi_{os}$ | 710° |
| Base Circle Radius | $R_b$ | 2.6 mm |
| Orbiting Radius | $R_{or}$ | 4.7 mm |
| Wall Thickness | $t$ | 3.5 mm |
| Discharge Port Diameter | $d_d$ | 7 mm |
| Pressure Relief Port 1 Diameter | $d_{pr1}$ | 2 mm |
| Pressure Relief Port 2 Diameter | $d_{pr2}$ | 2 mm |
| Crescent Slot Diameter | $d_c$ | 8 mm |
The compressor includes a pressure relief structure consisting of two relief ports and their corresponding reed valves, connecting the scroll chambers to a common relief cavity. This design aims to mitigate over-compression under low pressure ratio conditions. The two compression chambers are defined: Chamber A is formed between the inner wrap of the fixed scroll and the outer wrap of the orbiting scroll, while Chamber B is formed between the outer wrap of the fixed scroll and the inner wrap of the orbiting scroll. The pressure relief ports are named accordingly: Relief Port 1 near the fixed scroll’s inner wrap (serving Chamber A) and Relief Port 2 near its outer wrap (serving Chamber B).
Critical orbiting angles ($\theta$) define key events in the chamber evolution:
- $\theta_0$: The innermost chamber transitions from being bounded solely by involutes to include modified arcs.
- $\theta_1$: Chamber A starts to connect with the discharge port.
- $\theta_2$: Chamber B starts to connect with the central pocket via the crescent slot.
- $\theta_3$: The final pair of mating points vanish, directly connecting Chambers A and B.
- $\theta_1^*$: Chamber B starts to connect with Relief Port 2.
- $\theta_2^*$: Chamber A starts to connect with Relief Port 1.
1.2 Thermodynamic and Flow Model
The thermodynamic model is developed with the following assumptions to balance accuracy and solvability:
- The refrigerant is in the vapor phase; lubricating oil is incompressible.
- The oil-refrigerant mixture is homogeneous with uniform pressure and temperature within a control volume.
- No slip velocity between oil and refrigerant.
- Kinetic and potential energy changes of the mixture are negligible.
- Heat transfer through the scroll walls is unaffected by the oil film.
The control volumes include individual scroll chambers, the discharge port, pressure relief ports, the valve rear chamber (representing discharge back pressure), and the motor cavity (accounting for motor heating of suction gas). The governing equations for a control volume (a scroll chamber) are as follows:
Mass Conservation:
$$ \frac{dm}{d\theta} = \frac{1}{\omega} \sum (\dot{m}_{in} – \dot{m}_{out}) $$
where $m$ is the mass within the control volume, $\omega$ is the orbital angular speed, and $\dot{m}$ represents mass flow rates.
Species Conservation (Oil Mass Fraction $x_l$, Refrigerant $x_g=1-x_l$):
$$ \frac{dx_l}{d\theta} = \frac{1}{m} \left[ \frac{1}{\omega} \sum (\dot{m}_{l,in} – \dot{m}_{l,out}) – x_l \frac{dm}{d\theta} \right] $$
Energy Conservation:
$$
\begin{aligned}
\frac{dT}{d\theta} &= \frac{1}{m (x_g c_{v,g} + x_l c_{v,l})} \left[ \frac{\dot{Q}}{\omega} + \frac{1}{\omega} \sum \dot{m}_{in}(h_{in} – h) \right. \\
&- \left. T \left( \frac{\partial p}{\partial T} \right)_{v,g} \left( \frac{dV}{d\theta} – v_g \frac{dm_g}{d\theta} – v_l \frac{dm_l}{d\theta} \right) – m \left( h_g \frac{dx_g}{d\theta} + h_l \frac{dx_l}{d\theta} \right) \right]
\end{aligned}
$$
where $T$ is temperature, $\dot{Q}$ is heat transfer rate, $h$ is specific enthalpy, $V$ is control volume, and $v$ is specific volume. Pressure $p$ is determined from refrigerant property libraries using $T$ and density.
Valve Dynamics (1D Model):
$$
\begin{aligned}
\frac{dy}{d\theta} &= u_\theta \\
\frac{du_\theta}{d\theta} &= \frac{1}{\omega^2} \left( \frac{F_g}{m_{eq}} – 2 \zeta \omega_n u_\theta + \omega_n^2 y \right)
\end{aligned}
$$
where $y$ is valve tip displacement, $u_\theta$ is tip velocity, $F_g$ is gas force, $m_{eq}$ is equivalent mass, $\zeta$ is damping ratio, and $\omega_n$ is natural frequency.
Leakage flows (flank, tip, and radial seal) are modeled as incompressible flows through narrow gaps. Chamber heat transfer is modeled using a Dittus-Boelter type correlation, enhanced to account for forced convection from orbiting motion and leakage flows. The system of differential equations is solved numerically using the Runge-Kutta-Fehlberg method.
2. Experimental Validation of the Model
The validity of the mathematical model, specifically its prediction of dynamic pressure within the scroll chambers, was confirmed through experimental testing on a scroll compressor prototype for a battery electric vehicle. Dynamic pressure sensors were installed at three strategic locations on the fixed scroll back plate to monitor low, medium, and high-pressure zones during the compression cycle. Tests were conducted on a compressor calorimeter under conditions with a pressure ratio of 5 and varying speeds, using R134a refrigerant and POE VG68 oil. The comparison between simulated and measured pressures for two speed conditions is summarized in Table 2.
| Operating Condition | Region of Comparison | Agreement Level | Noted Discrepancy & Cause |
|---|---|---|---|
| Suction Pressure: 0.3 MPa Discharge Pressure: 1.5 MPa Speed: 3,000 rpm |
Suction & Compression Phases | Excellent | None significant. |
| Initial Discharge Phase | Good | Simulated pressure slightly lower due to unmodeled gas inertia effects. | |
| Suction Pressure: 0.3 MPa Discharge Pressure: 1.5 MPa Speed: 8,000 rpm |
Suction & Compression Phases | Excellent | None significant. |
| Discharge Phase | Partial Data | Experimental high-frequency pressure data in the discharge chamber was incomplete due to sensor range limitations at high speed. Model trends remained plausible. |
The overall strong correlation between the model and experimental data confirms the model’s capability to accurately capture the fundamental thermodynamic and fluid dynamic processes, providing a reliable tool for analyzing asymmetric pressure phenomena.
3. Analysis of Asymmetric Pressure Distribution Characteristics
Using the validated model, the pressure evolution in Chambers A and B was analyzed under various operating conditions relevant to a battery electric vehicle thermal management system. The compressor’s indicated power, a key performance metric, is calculated by integrating the P-V diagram for both sides:
$$ P_{ind} = \frac{\bar{n}}{60} \sum_{i=A, B} \int_{0}^{V_{h,i}} (p_{c,i} – p_{s,i}) \, dV_i $$
where $\bar{n}$ is speed, $V_h$ is suction sealed volume, $p_c$ is compression/discharge pressure, and $p_s$ is suction pressure.
3.1 Influence of Operating Speed
The analysis at a high pressure ratio of 5 reveals the core asymmetric behavior. Due to the 50° difference in wrap termination angles, Chamber A begins compression earlier than Chamber B. During the early and mid-compression phases (before $\theta_1$), a nearly constant pressure difference of approximately 0.02 MPa is maintained, with Chamber A at a higher pressure. The fundamental asymmetry mechanism remains unchanged with speed. However, increasing the speed from 3,000 rpm to 8,000 rpm significantly increases flow resistance through inter-chamber passages (discharge port, crescent slot). This leads to prolonged pressure equalization times after chamber connections and dramatically exacerbates over-compression. The peak discharge pressure rises from about 1.7 MPa at 3,000 rpm to 2.1 MPa at 8,000 rpm, which is 0.6 MPa above the system discharge pressure, indicating severe over-compression loss at high speed—a critical concern for efficiency in a battery electric vehicle.
3.2 Influence of Pressure Ratio
The effect of pressure ratio was investigated at a constant speed of 3,000 rpm. The characteristics of asymmetry differ fundamentally between a low pressure ratio (2) and a high pressure ratio (5), as summarized in Table 3. This difference stems from the relationship between the compressor’s built-in volume ratio (approximately 2.5, defining its internal pressure ratio) and the operating external pressure ratio.
| Aspect | Low External Pressure Ratio (2) < Built-in Volume Ratio (2.5) | High External Pressure Ratio (5) > Built-in Volume Ratio (2.5) |
|---|---|---|
| Discharge Initiation | Early. Discharge valve opens before $\theta_1$. | Delayed. Significant over-compression occurs before discharge. |
| Flow Direction at $\theta_1$ | From Chamber A to the discharge port. | Reverse flow from discharge port into Chamber A. |
| Flow Direction at $\theta_2$ | From Chamber B to the central pocket via crescent slot. | From central pocket to Chamber B via crescent slot. |
| Primary Cause of Asymmetry Post-Connection | Differential compression timing and sequential sealing/opening of chambers relative to ports. | Large pressure gradients established due to over-compression, driving strong cross-flows upon connection. |
At low pressure ratio, Chamber B eventually becomes a trapped volume after losing connection to the discharge port, leading to a rapid pressure rise until it merges with Chamber A at $\theta_3$. This sequence creates a distinctly different asymmetric pressure history compared to the high pressure ratio case.
3.3 Performance of Pressure Relief Structure in Low Pressure Ratio Operation
The pressure relief structure is designed to alleviate over-compression when the external pressure ratio is lower than the built-in pressure ratio. Its effectiveness is defined by an effective built-in volume ratio range:
$$ V_{r,bp} = \left[ \frac{V_s}{V_{c,bp}^{end}}, \frac{V_s}{V_{c,bp}^{start}} \right] $$
where $V_s$ is suction volume and $V_{c,bp}$ is the chamber volume at the start/end of connection with its relief port. The structure is only active when the operating pressure ratio falls within this range.
Analysis at a pressure ratio of 2 shows limited effectiveness. The small area of the relief ports (only ~8% of the discharge port area) restricts flow. Furthermore, at high speed (8,000 rpm), increased flow resistance and greater expansion losses from the added clearance volume negate any benefit. The impact on compressor indicated power is quantified in Table 4.
| Speed (rpm) | With Relief Structure $P_{ind}$ (W) | Without Relief Structure $P_{ind}$ (W) | Relative Indicated Power | Net Effect & Primary Cause |
|---|---|---|---|---|
| 3,000 | 623.17 | 632.31 | 98.6% | Reduction of 1.4%. Benefit from reduced over-compression outweighs clearance loss. |
| 8,000 | 2562.56 | 2546.01 | 100.65% | Increase of 0.65%. Increased flow resistance cripples relief flow; larger clearance expansion loss dominates. |
This result highlights a critical design challenge for compressors in a battery electric vehicle, which must operate efficiently across a wide speed and load range. A fixed-geometry relief structure may provide benefits at low speeds but can become detrimental at high speeds.
4. Discussion: Root Causes and Design Implications
The asymmetric pressure distribution in scroll compressors is a direct consequence of intentional or inherent geometric asymmetries interacting with the sequential processes of compression, chamber connection, and discharge. For the battery electric vehicle compressor studied, the primary root cause during the main compression phase is the 50° difference in wrap termination angles. This geometric feature ensures that Chambers A and B are at different stages of compression at any given orbiting angle, creating a steady, small pressure differential.
The dynamic manifestation of this asymmetry, however, is controlled by the timing and nature of chamber interconnectivity events ($\theta_1$, $\theta_2$, $\theta_3$). These events, in turn, are governed by the relative position of ports and slots. The resulting pressure gradients drive internal flows that can be beneficial (promoting pressure equalization) or detrimental (causing pressure pulsations, increased leakage, or inefficient mixing). The model reveals that the severity of over-compression and the intensity of these internal flows are highly sensitive to operating speed due to viscous flow resistance effects.
The study of the pressure relief structure underscores a key design implication: components optimized for a narrow operating point may not perform well across the entire operational envelope of a battery electric vehicle compressor. To truly improve performance under low-load conditions, adaptive or variable geometry mechanisms for pressure relief might be necessary. Furthermore, optimizing the geometry—such as increasing relief port area, refining port location to enlarge the effective $V_{r,bp}$ range, or shaping the crescent slot—can help better manage asymmetric pressures and minimize losses.
5. Conclusion
This investigation into the asymmetric pressure distribution within an electric vehicle scroll compressor yields the following key conclusions:
- Asymmetry is Inherent and Geometric: The non-identical wrap termination angles create a consistent pressure difference between symmetric compression chambers during early and mid-compression. For the studied compressor, this difference is approximately 0.02 MPa at a suction pressure of 0.3 MPa.
- Speed Amplifies Over-compression, Not the Core Mechanism: Increasing operational speed does not alter the fundamental cause of asymmetry but drastically increases flow resistance. This leads to prolonged pressure equalization and severe over-compression at high speeds, with peak pressures exceeding the system pressure by up to 0.6 MPa, posing a significant efficiency penalty for high-speed operation in a battery electric vehicle.
- Pressure Ratio Dictates the Nature of Asymmetry: The relationship between the operating external pressure ratio and the compressor’s built-in internal pressure ratio fundamentally changes the asymmetric pressure characteristics. It determines whether discharge occurs early or late and reverses the direction of internal flows upon chamber connection, leading to two distinct regimes of asymmetric behavior.
- Fixed Pressure Relief Structures Have Limited Efficacy: In low pressure ratio conditions, a standard fixed relief structure may reduce indicated power at low speeds but can increase it at high speeds. Its effectiveness is limited by small flow areas and increased losses at high speed, highlighting a need for more advanced adaptive pressure management solutions in variable-speed battery electric vehicle compressors.
The insights and the validated modeling methodology presented provide a solid foundation for the structural design and optimization of scroll profiles for next-generation thermal management systems in battery electric vehicles. Future work should focus on multi-objective optimization of asymmetric geometric features (wrap termination, port/slot sizing and placement) to minimize losses, pressure pulsations, and dynamic forces across the entire operating range of the vehicle.