
1. Introduction and Research Motivation
In the context of the national “dual carbon” strategy, marine energy is progressively shifting toward clean energy sources, which creates substantial opportunities for the advancement of marine power batteries. The performance of a high-voltage battery is intrinsically linked to its operating temperature, making thermal management a critical factor in maintaining optimal working conditions. Through my research, I have focused on liquid cooling as the primary heat dissipation method, optimizing the internal structure of liquid-cooled plates to achieve superior cooling performance while consuming less energy.
The significance of battery thermal management cannot be overstated. Lithium-ion batteries, which are widely adopted in high-voltage battery systems due to their high energy density, low self-discharge rate, and long cycle life, are extremely sensitive to operating temperature. The optimal working temperature range for lithium-ion batteries should be maintained between 25 °C and 40 °C, with the temperature difference within the battery module controlled within 5 °C. Excessive temperatures can trigger thermal runaway, leading to fires or explosions, as evidenced by numerous incidents involving smartphones, electric vehicles, and other battery-powered devices over the past decade.
Various thermal management technologies have been investigated, including air cooling, phase change material (PCM) cooling, immersion cooling, and indirect liquid cooling. Among these approaches, indirect liquid cooling has emerged as a particularly effective solution due to the high heat transfer coefficient of liquid coolants and its compact space requirements. Within this domain, the design of flow channel structures plays a pivotal role in determining both cooling performance and pressure drop characteristics.
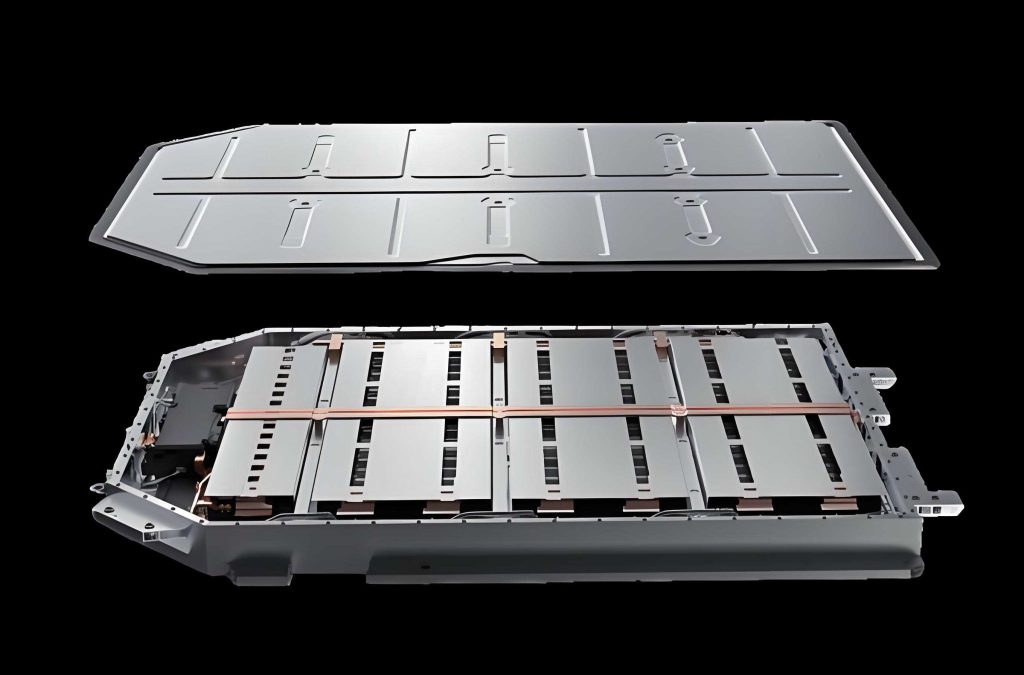
My work is motivated by the observation that while many studies propose novel liquid-cooled plate designs, they often fail to adequately address the pressure drop penalty associated with enhanced cooling. Furthermore, some comparative studies inadvertently alter inlet conditions, thereby indirectly changing the flow rate and compromising the validity of the comparison. In this research, I endeavor to develop a bionic liquid-cooled plate inspired by natural leaf veins and tree root structures, specifically designed for high-voltage battery applications in marine environments. By maintaining consistent inlet conditions throughout the optimization process, I aim to achieve superior cooling performance while simultaneously reducing the energy consumption required to drive the cooling medium.
2. Numerical Methodology and Governing Equations
Computational fluid dynamics (CFD) provides a robust framework for investigating the complex heat transfer and fluid flow phenomena within liquid-cooled plates. The numerical analysis in my research is based on the fundamental conservation laws governing fluid motion and heat transfer. The governing equations can be expressed as follows:
(1) Mass Conservation Equation:
$$ \frac{\partial \rho}{\partial t} + \frac{\partial(\rho u_x)}{\partial x} + \frac{\partial(\rho u_y)}{\partial y} + \frac{\partial(\rho u_z)}{\partial z} = 0 \tag{1} $$
For incompressible fluids where density ρ is constant, this equation simplifies to:
$$ \frac{\partial u_x}{\partial x} + \frac{\partial u_y}{\partial y} + \frac{\partial u_z}{\partial z} = 0 \tag{2} $$
(2) Momentum Conservation Equation (Navier-Stokes):
$$ \frac{\partial(\rho u_x)}{\partial t} +
abla \cdot (\rho u_x \mathbf{u}) =
abla \cdot (\mu \,
abla u_x) – \frac{\partial p}{\partial x} + S_x \tag{3a} $$
$$ \frac{\partial(\rho u_y)}{\partial t} +
abla \cdot (\rho u_y \mathbf{u}) =
abla \cdot (\mu \,
abla u_y) – \frac{\partial p}{\partial y} + S_y \tag{3b} $$
$$ \frac{\partial(\rho u_z)}{\partial t} +
abla \cdot (\rho u_z \mathbf{u}) =
abla \cdot (\mu \,
abla u_z) – \frac{\partial p}{\partial z} + S_z \tag{3c} $$
(3) Energy Conservation Equation:
$$ \frac{\partial(\rho T)}{\partial t} +
abla \cdot (\rho \mathbf{u} T) =
abla \cdot \left(\frac{\lambda}{C_p}
abla T\right) + S_t \tag{4} $$
In the above equations, u represents the fluid velocity, μ denotes the dynamic viscosity, p is pressure, T is temperature, Cp is the specific heat capacity, λ is the thermal conductivity, and S represents the source terms. These governing equations form the foundation for analyzing the thermal-hydraulic performance of the liquid-cooled plate designed for high-voltage battery thermal management.
3. Heat Generation Mechanism in High-Voltage Batteries
Understanding the heat generation mechanism of high-voltage battery systems is essential for accurate thermal management design. The total heat generation rate Q during the charge-discharge cycle can be decomposed into several components:
$$ Q = Q_R + Q_P + Q_J + Q_S \tag{5} $$
where QR represents the electrochemical reaction heat, QP is the polarization heat, QJ denotes the Joule heat (ohmic heating), and QS is the heat from side reactions. The electrochemical reaction heat can be expressed as:
$$ Q_R = \frac{N m Q I}{M F} \tag{6} $$
where N is the number of cells, m is the mass, I is the charge/discharge current, M is the molar mass, and F is the Faraday constant. The polarization heat and Joule heat are given by:
$$ Q_P = I^2 R_P \tag{7} $$
$$ Q_J = I^2 R_o \tag{8} $$
In these expressions, RP is the polarization internal resistance and Ro is the ohmic internal resistance. For typical operating conditions, the side reaction heat QS can be neglected:
$$ Q = Q_R + Q_P + Q_J \tag{9} $$
The heat generated within the high-voltage battery is transmitted through thermal conduction to the cooling plate surface, where it is subsequently removed by the convective heat transfer of the cooling medium flowing through the channels. The heat transfer mechanisms include thermal radiation, thermal conduction, and convective heat transfer, with radiation typically contributing minimally to the overall heat dissipation in liquid-cooled systems.
4. Physical Model and Geometric Configuration
Inspired by the natural world, I observed that leaf veins exhibit hexagonal-like structures that efficiently distribute water and nutrients throughout the leaf blade, while tree root systems employ complex yet orderly branching patterns to absorb and transport essential resources. Drawing upon these natural design principles, I developed a bionic liquid-cooled plate that integrates both hexagonal leaf vein structures and tree root-like arrangements to optimize coolant flow and heat transfer for high-voltage battery thermal management.
The geometric configuration of the bionic liquid-cooled plate is based on the dimensions of a marine power battery module (type EVEB21P18511) with a capacity of 16.18 kWh and an operating heat generation of 250 W. The high-voltage battery stack arrangement constrains the available space for thermal management, necessitating a compact cooling plate design. The overall dimensions of the bionic liquid-cooled plate are 773 mm × 634 mm × 6 mm, with an inlet height of 2 mm and inlet width of 32 mm.
Four key structural parameters define the internal architecture of the bionic liquid-cooled plate:
| Parameter | Symbol | Description |
|---|---|---|
| Hexagon size | a | Characteristic dimension of hexagonal elements |
| Transverse distance | b | Horizontal spacing between adjacent hexagons |
| Longitudinal distance | c | Vertical spacing between hexagon rows |
| Distance from outlet | d | Distance between hexagonal structures and outlet |
These structural parameters collectively define the enhanced heat transfer zone of the liquid-cooled plate. The hexagonal geometry combined with the tree root-like arrangement creates a unique flow path that promotes boundary layer disruption and reformation, thereby enhancing convective heat transfer for the high-voltage battery thermal management system.
5. Numerical Simulation Setup and Boundary Conditions
All numerical simulations were performed using the ANSYS Fluent software package. The simulation methodology follows several key assumptions:
(1) The cooling medium is assumed to be steady and incompressible;
(2) All boundaries, except for the heated surface, are treated as adiabatic;
(3) Thermophysical properties of materials are independent of temperature;
(4) Gravity effects and viscous dissipation are neglected;
(5) Radiation heat transfer is not considered in the analysis.
The boundary conditions were established with the inlet defined as a velocity inlet and the outlet as a pressure outlet. The initial temperature was set to 303.15 K with a coolant velocity of 0.2 m/s. The heat flux applied to the upper surface of the cooling plate was 785 W/m², corresponding to the heat generation rate of the 16.18 kWh high-voltage battery system. The Reynolds number was calculated using:
$$ Re = \frac{\rho V d}{\mu} \tag{10} $$
where d represents the hydraulic diameter of the channel. The computed Reynolds number of 680 confirms laminar flow conditions, justifying the selection of the laminar model for this simulation. Table 1 summarizes the thermophysical properties of the materials used in this study.
Table 1: Thermophysical properties of materials employed in the simulation
| Component | Material | Density (kg/m³) | Dynamic Viscosity (kg/(m·s)) | Thermal Conductivity (W/(m·K)) | Specific Heat (J/(kg·K)) |
|---|---|---|---|---|---|
| Coolant | Water | 998.2 | 0.001003 | 0.6 | 4182 |
| Plate | Aluminum | 2719 | — | 155 | 3485 |
The pressure-based solver was selected for this incompressible flow problem, employing the Coupled algorithm for pressure-velocity coupling. Spatial discretization was performed using the second-order upwind scheme. Transient simulations were conducted with a time step of 1 second, monitoring both maximum temperature and pressure drop throughout the solution process.
6. Mesh Generation and Grid Independence Verification
Structured mesh generation using ICEM software was employed from the outset. By carefully constructing blocking strategies, I created a high-quality structured grid for the bionic liquid-cooled plate, followed by stretching to generate the three-dimensional mesh. This approach leverages the advantages of structured grids, including regular node distribution, lower memory requirements, and faster computation times. The resulting three-dimensional structured mesh achieved excellent quality metrics, with 88% of elements exhibiting quality scores above 0.9.
To determine the appropriate mesh resolution for accurate numerical simulation, I performed a grid independence study using five different mesh densities. The analysis tracked both maximum temperature and pressure drop as functions of grid count. My results demonstrated that as the mesh count increased from 987,282 to 9,548,515, the maximum temperature decreased progressively before asymptotically approaching a stable value. Similarly, the pressure drop increased initially and then plateaued. At a mesh count of 4,740,770, further mesh refinement produced negligible changes in both parameters—the maximum temperature variation remained within 0.2 °C while the pressure drop exhibited virtually no change. Based on these findings, I selected 4,740,770 elements as the optimal mesh count, striking a balance between computational accuracy and simulation efficiency.
7. Model Validation
To validate the reliability of my numerical model and methodology, I conducted a comprehensive comparison between simulation results and published experimental data. The validation study employed a 6 mm thick liquid-cooled plate composed of bottom and cover plates with a 2 mm channel height. The reference experimental plate measured 154 mm × 79 mm × 6 mm, and the simulation was conducted under a 5 C discharge rate with a heat flux of 3412 W/m² on the heated surface. The inlet coolant temperature was maintained at 25 °C with flow rates of 0.5, 1, 1.5, and 2 g/s.
My numerical simulation results demonstrated close agreement with the experimental data across all tested flow rates, with maximum temperature errors consistently below 5%. This excellent correlation confirms that my model and methodology are reliable for predicting the thermal performance of liquid-cooled plates for high-voltage battery thermal management. Subsequent simulations in this research are therefore based on this validated approach, ensuring the accuracy and scientific rigor of my results.
8. Parametric Analysis of External Factors
Before conducting a detailed comparison of different cooling plate structures, I investigated the effects of two crucial external parameters: fluid domain thickness and coolant flow velocity. These factors influence not only the cooling performance but also the energy balance of the entire thermal management system for the high-voltage battery. Understanding their influence is essential for establishing appropriate fixed conditions for subsequent structure comparison studies.
8.1 Effect of Fluid Domain Thickness
While maintaining a constant total cooling plate thickness, I varied the internal fluid domain thickness through values of 1 mm, 2 mm, 3 mm, and 4 mm. All simulations were conducted under identical inlet velocity and coolant temperature conditions. The maximum temperature initially decreased with increasing thickness before rising again, revealing an optimum point at a thickness of 2 mm. This non-monotonic behavior stems from two competing effects: increasing the fluid domain thickness initially enhances cooling capacity through increased coolant mass flow, but excessive thickness also thickens the internal aluminum structure within the domain, thereby impeding thermal conduction.
Regarding pressure drop, my results showed a monotonic decrease with increasing thickness, although the rate of reduction diminished gradually. The 2 mm and 3 mm configurations both exhibited favorable performance in controlling temperature and pressure drop with respect to the alternative thicknesses. Considering that the 2 mm configuration, although presenting a pressure drop 3 Pa higher than the 3 mm counterpart, achieved a significantly lower maximum temperature by 1.5 °C, I selected the 2 mm fluid domain thickness as the optimal choice. This configuration also offers improved structural stability since the thicker upper and lower panels provide enhanced mechanical integrity to the high-voltage battery cooling plate.
8.2 Effect of Coolant Flow Velocity
With the fluid domain thickness fixed at 2 mm, I compared three different liquid-cooled plate configurations: the conventional liquid-cooled plate (CLCP), the honeycomb liquid-cooled plate (HLCP), and the bionic liquid-cooled plate (BLCP). The maximum temperature exhibited a consistent decline across all configurations as the flow velocity increased from 0.1 m/s to 0.3 m/s. This behavior can be attributed to the increased mass flow rate, which enhances the convective heat transfer capability of the cooling medium.
However, a critical observation emerged when the velocity exceeded 0.2 m/s: the temperature reduction trend became increasingly gradual, indicating diminishing returns for additional increases in flow velocity. Beyond this threshold, the additional energy consumed to further accelerate the coolant produces minimal improvement in the thermal performance of the high-voltage battery liquid-cooled plate. From an energy utilization perspective, 0.2 m/s represents the optimal balance between cooling effectiveness and energy consumption. I therefore adopted this flow velocity as a fixed parameter for subsequent comparative analyses.
9. Orthogonal Experimental Design
The internal structure of the bionic liquid-cooled plate for the high-voltage battery is governed by four distinct parameters. Given the vast number of possible parameter combinations, I employed orthogonal experimental design methodology to systematically investigate the effects of these parameters on thermal performance and pressure drop. The orthogonal approach enables efficient identification of significant factors and their optimal combination levels with minimal experimental trials.
9.1 Experimental Design Methodology
My orthogonal experimental design incorporated four factors with four levels each, yielding sixteen distinct experimental configurations. The parameter levels are summarized in Table 2:
Table 2: Orthogonal experimental factors and level assignments
| Factor | Level 1 | Level 2 | Level 3 | Level 4 |
|---|---|---|---|---|
| a (mm) | 20 | 26 | 32 | 38 |
| b (mm) | 8 | 12 | 16 | 20 |
| c (mm) | 30 | 40 | 50 | 60 |
| d (mm) | 80 | 90 | 100 | 110 |
The sixteen experimental configurations, along with their corresponding simulation results for maximum temperature and pressure drop, are presented in Table 3. All simulations were conducted at a coolant velocity of 0.2 m/s and a coolant temperature of 30 °C, maintaining constant flow conditions to isolate the effects of structural variations on the performance of the liquid-cooled plate in this high-voltage battery thermal management application.
Table 3: Orthogonal experimental results for the bionic liquid-cooled plate
| No. | a (mm) | b (mm) | c (mm) | d (mm) | Tmax (°C) | ΔP (Pa) |
|---|---|---|---|---|---|---|
| 1 | 20 | 8 | 30 | 80 | 35.43 | 173.47 |
| 2 | 20 | 12 | 40 | 90 | 36.08 | 158.21 |
| 3 | 20 | 16 | 50 | 100 | 36.14 | 157.52 |
| 4 | 20 | 20 | 60 | 110 | 36.33 | 153.46 |
| 5 | 26 | 8 | 50 | 90 | 35.46 | 171.68 |
| 6 | 26 | 12 | 60 | 80 | 35.88 | 158.92 |
| 7 | 26 | 16 | 30 | 110 | 36.06 | 157.39 |
| 8 | 26 | 20 | 40 | 100 | 36.35 | 157.34 |
| 9 | 32 | 8 | 60 | 100 | 35.45 | 167.94 |
| 10 | 32 | 12 | 50 | 110 | 35.84 | 165.11 |
| 11 | 32 | 16 | 40 | 80 | 36.16 | 170.11 |
| 12 | 32 | 20 | 30 | 90 | 36.13 | 154.75 |
| 13 | 38 | 8 | 40 | 110 | 35.47 | 180.66 |
| 14 | 38 | 12 | 30 | 100 | 35.81 | 158.73 |
| 15 | 38 | 16 | 60 | 90 | 35.91 | 158.69 |
| 16 | 38 | 20 | 50 | 80 | 35.96 | 158.38 |
Analysis of the data in Table 3 reveals a clear inverse relationship between temperature and pressure drop across the sixteen structural configurations. Configurations achieving lower maximum temperatures tend to exhibit higher pressure drops, and vice versa. This trade-off between thermal performance and hydraulic loss represents a fundamental challenge in the design of liquid-cooled plates for high-voltage battery systems, necessitating multi-objective optimization to achieve the optimal balance.
9.2 Visual Inspection of Temperature Distributions
Beyond quantitative comparison of maximum temperatures, I performed a qualitative analysis of temperature distributions across all sixteen configurations. Each structure exhibits a distinct thermal signature dictated by its particular parameter combination. Notably, the temperature distribution patterns reveal an important commonality: the highest temperature consistently appears in the two corners nearest to the outlet of the liquid-cooled plate. This characteristic arises because the coolant enters from the inlet, absorbing heat as it flows toward the outlet, resulting in elevated coolant temperatures downstream and consequently higher local plate temperatures at the outlet-side corners.
The temperature contour results also demonstrate that optimizing the internal structure of the liquid-cooled plate can achieve more than a simple reduction in peak temperature. By implementing carefully designed structural configurations, the overall temperature distribution becomes more uniform across the heated surface of the high-voltage battery cooling plate. This improved temperature uniformity is highly desirable since it reduces thermal gradients within the battery cells, contributing to more consistent electrochemical performance and prolonged service life.
9.3 Extreme Difference Analysis
To determine the relative significance of each structural parameter on maximum temperature and pressure drop, I employed the range analysis (extreme difference) method. This analytical technique calculates the range R, defined as the difference between the maximum and minimum average responses at different levels for each factor. The factor with the largest R value exhibits the strongest influence on the response variable. Table 4 presents the detailed results of this analysis.
Table 4: Range analysis results for maximum temperature and pressure drop
| Ta | Tb | Tc | Td | Pa | Pb | Pc | Pd | |
|---|---|---|---|---|---|---|---|---|
| k1 | 143.98 | 141.81 | 143.43 | 143.43 | 642.66 | 693.75 | 644.34 | 660.88 |
| k2 | 143.75 | 143.61 | 144.06 | 143.58 | 645.33 | 640.97 | 666.32 | 643.33 |
| k3 | 143.58 | 143.27 | 143.40 | 143.75 | 657.91 | 643.71 | 652.69 | 641.53 |
| k4 | 143.15 | 144.77 | 143.57 | 143.70 | 656.46 | 623.93 | 639.01 | 656.62 |
| K1 | 36.00 | 35.45 | 35.86 | 35.86 | 160.67 | 173.44 | 161.09 | 165.22 |
| K2 | 35.94 | 35.90 | 36.02 | 35.90 | 161.33 | 160.24 | 166.58 | 160.83 |
| K3 | 35.90 | 36.07 | 35.85 | 35.94 | 164.48 | 160.93 | 163.17 | 160.38 |
| K4 | 35.79 | 36.19 | 35.89 | 35.93 | 164.12 | 155.98 | 159.75 | 164.16 |
| R | 0.21 | 0.74 | 0.17 | 0.08 | 3.81 | 17.46 | 6.83 | 4.84 |
From the range analysis for maximum temperature, the significance ranking follows the order Rb > Ra > Rc > Rd, indicating that parameter b (the transverse distance between hexagons) exerts the strongest influence on temperature, followed by the hexagonal size, the longitudinal distance, and finally the distance from the outlet. Regarding pressure drop, the significance order is Rb > Rc > Ra > Rd, again demonstrating the dominant role of parameter b on the pressure characteristics of the bionic liquid-cooled plate employed for high-voltage battery cooling.
10. Multi-Objective Optimization
10.1 Optimization Algorithm Selection
A key challenge in my design process was selecting the optimal structural parameters to achieve a balance between cooling effectiveness and energy efficiency. Since higher cooling rates necessitate greater flow resistance within the liquid-cooled plate for high-voltage battery thermal management, this optimization involves a fundamental conflict between thermal and hydraulic objectives. To resolve this contradiction optimally, I employed a multi-objective optimization algorithm.
Among the various optimization methods, the Non-dominated Sorting Genetic Algorithm II (NSGA-II) distinguishes itself through its fast computation speed, low complexity, and improved selection mechanism built upon the basic genetic algorithm. NSGA-II stratifies individuals according to their dominance relationships, enabling simultaneous optimization of competing objectives without the need for aggregation weights. The algorithm’s capability to generate a diverse Pareto front makes it particularly well-suited for optimizing the trade-off between maximum temperature and pressure drop.
10.2 Parameter Fitting and Pareto Optimization
Prior to conducting the optimization, I established polynomial fitting relationships correlating the four structural parameters with the two objective variables. During fitting, the four parameters (a, b, c, d) were designated as independent variables (x₁, x₂, x₃, x₄). This yielded the following fitted response equations for pressure drop and maximum temperature:
$$ \Delta P = 0.224917 x_1 – 1.292 x_2 – 0.07405 x_3 – 0.03645 x_4 + 181.0079 \tag{11} $$
$$ T_{max} = -0.01108 x_1 + 0.059625 x_2 – 0.0006 x_3 + 0.00245 x_4 + 35.18467 \tag{12} $$
To assess the validity of the fitted model, I used the coefficient of determination represented as \(r^2\):
$$ r^2 = 1 – \sum_{i=1}^{n} \frac{Z_i – Z_{i,CFD}}{Z_{i,CFD}}^2 \tag{13} $$
The computed coefficient of determination values are \(r^2\) = 0.81 for maximum temperature and \(r^2\) = 0.63 for pressure drop. These values confirm the reliability of the fitted equations for supporting multi-objective optimization. In executing the optimization, the domain ranges for all four independent variables were constrained as follows: 20 ≤ x₁ ≤ 38, 8 ≤ x₂ ≤ 20, 30 ≤ x₃ ≤ 60, and 80 ≤ x₄ ≤ 110. The multi-objective optimization problem is formally expressed as:
$$ \min F(x_1, x_2, x_3, x_4) = \lbrace^{\min f_1(x_1, x_2, x_3, x_4)}_{\min f_2(x_1, x_2, x_3, x_4)} \quad \text{subject to} \begin{cases} 20 \le x_1 \le 38 \\ 8 \le x_2 \le 20 \\ 30 \le x_3 \le 60 \\ 80 \le x_4 \le 110 \end{cases} \tag{14} $$
The NSGA-II parameters were set with a population size of 50, a maximum evolution of 150 generations, and a fitness deviation of 0.0001. Following the optimization, the Pareto front provides a visualization of the trade-off between maximum temperature and pressure drop for the high-voltage battery liquid-cooled plate. The results confirm that lower maximum temperatures consistently correspond to higher pressure drops across the design space of bionic liquid-cooled plates.
Given the energy consumption perspective, the input flow rate is held constant since neither the inlet geometry nor the velocity is altered by modifying the internal structural parameters. Thus the power consumed by the pump is directly proportional to the pressure drop. From an array of possible solutions represented by the Pareto front, I selected the compromise point corresponding to a maximum temperature of 35.49 °C and a pressure drop of 170.08 Pa. The associated structural parameters are a = 30 mm, b = 8 mm, c = 50 mm, and d = 90 mm.
To verify the reliability of the optimization outcome, I constructed a model featuring the optimized structure, which was simulated under the same conditions and then compared with the algorithm prediction. A table of comparison follows in Table 5.
Table 5: Comparison between CFD simulation results and algorithm predictions
| Parameter | Predicted value | Simulated value | Error |
|---|---|---|---|
| Maximum temperature (°C) | 35.49 | 35.51 | 0.00056 |
| Pressure drop (Pa) | 170.08 | 163.79 | 0.038 |
The discrepancies between the predicted and simulated results are exceptionally minimal for both objective functions: the maximum temperature error is merely 0.00056 while the pressure drop error is only 0.038. This outstanding correlation confirms the validity of the optimized structure for high-performance thermal management of the high-voltage battery cooling plate.
11. Comparative Analysis with Conventional Liquid-Cooled Plates
The structural concept of the bionic liquid-cooled plate emerges as an advancement over both conventional liquid-cooled plates (CLCP) and honeycomb liquid-cooled plates (HLCP). In this section, I perform a rigorous comparison under identical boundary conditions—coolant temperature of 30 °C, inlet velocity of 0.2 m/s, and heat generation of 785 W/m²—to highlight the advantages offered by my optimized design for high-voltage battery thermal management. The flow rate, inlet height, and inlet width all remain identical across the three geometries, ensuring that any observed performance differences must be attributed solely to changes in the internal plate structure.
11.1 Pressure Drop Analysis
Pressure drop within the cooling channel directly affects the energy consumption of the entire thermal management loop for a high-voltage battery. Across the internal channels of the liquid-cooled plate, a reduction in pressure drop translates into lower pumping power.
From the simulation results, the conventional liquid-cooled plate has a pressure drop of 190.91 Pa, the honeycomb liquid-cooled plate reports 165.66 Pa, while the bionic liquid-cooled plate has the lowest at 163.79 Pa. Therefore, my proposed bionic liquid-cooled plate reduces the pressure drop by 14.2 % compared with a conventional design and 2.13 Pa compared to a honeycomb design.
The improvement in pressure drop is a direct result of incorporating hexagonal structures whose acute angles align with the direction of incoming fluid flow. This geometric feature greatly reduces flow resistance. Unlike conventional plates that use simple rectangular dividers creating straight, parallel channels, both the honeycomb and bionic plates break the channel into diverging and converging segments. The fluid encounters the sharp leading edge of each hexagonal column, then gradually spreads around the column and recombines behind it, resulting in a smoother, more distributed pressure field.
11.2 Temperature Analysis
In comparing the temperature fields, conventional liquid-cooled plates exhibit a maximum temperature of 36.20 °C, while the bionic liquid-cooled plate achieves a maximum temperature of 35.51 °C. This represents a 0.69 °C improvement—significant in the context of high-voltage battery operation, where the thermal window is narrow. The pressure drop field correlates with temperature performance results.
The thermal analysis of a contour plot, shown in the figures, reveals the formation of hot spots near the two outlet-side corners of all plates. But the magnitude and distribution of these hot spots vary. In the conventional design, isotherms in the downstream region of the plate bulge forward in a convex pattern, indicating non-uniform heat extraction. In the bionic liquid-cooled plate, however, the isotherms are concave, suggesting much more uniform temperature gradients.
For closer inspection, I divided the heated surface into equal-width sections perpendicular to the flow. Specifically, I sampled a temperature line every 170 mm along the direction of flow and computed the average temperature for each strip. Analyzing those mean temperature plots reveals that the conventional liquid-cooled plate exhibits better cooling performance close to the inlet region. This superiority is short-lived because the bionic plate confines its enhanced heat transfer geometry to the central and downstream portions of the surface.
When the coolant reaches the zone of hexagonal elements, the tree-root arrangement activates, and heat extraction becomes drastically more effective. For the rest of the flow path, the bionic liquid-cooled plate consistently maintains lower temperatures than the conventional plate. When examining the temporal response, the transient evolution shows that both plates initially experience sharp temperature rises, but the bionic plate reaches steady state faster and at a lower terminal temperature. In the first 50 seconds, the conventional plate demonstrates a faster rate of heat removal, as reflected by a smaller slope on the temperature versus time curve. However, after this initial period, the bionic plate outperforms the conventional one. This result suggests that the bionic structure can suppress the rate of temperature rise more effectively in the long run and achieve better temperature uniformity across the surface of the high-voltage battery.
11.3 Velocity Field Analysis
The velocity field provides direct evidence explaining simultaneous improvements in heat transfer and pressure loss. In the conventional liquid-cooled plate, the rectangular vanes channel the entire flow into five straight passages, within which the coolant moves at a relatively constant velocity of about 0.07 m/s and maintains direction parallel to the inlet. There are no obstacles within each passage to disturb the flow or disrupt the developing thermal boundary layer.
In the bionic liquid-cooled plate, the velocity field splits the domain into two distinct regions. The region between the hexagonal enhanced heat transfer zone and the outer walls features relatively fast flow, like the conventional channels, but with variable direction. Within the hexagonal arrangement, fluid velocities are much lower, yet more thermally effective.
The blunted forward edges of the hexagonal columns force the coolant to divide and flow around the columns, while the trailing edges create low-velocity wake regions. These wakes encourage local fluid recirculation, which in turn refreshes the thermal boundary layer—a critical mechanism for augmenting heat transfer in channels of a high-voltage battery thermal management system.
Thus the velocity profile inside the bionic liquid-cooled plate is not merely slower—it is carefully orchestrated to produce local mixing and boundary-layer restarting at the expense of less pressure drop.
11.4 Synergy Angle Analysis
Field synergy theory, pioneered by Professor Zeng-Yuan Guo, states that convective heat transfer can be intensified by aligning the fluid velocity vector with the temperature gradient vector. Since the heat transfer rate depends strongly on the dot product of these vectors, minimising the synergy angle between them—ideally to below 90 degrees—has a dramatic impact on thermal performance. The synergy angle formula can be expressed as follows:
$$ \cos \beta = \frac{\mathbf{u} \cdot
abla T}{|\mathbf{u}| \cdot |
abla T|} \tag{15} $$
By processing the CFD results in CFD-POST with this formula, I generated synergy angle contours for both the conventional and bionic liquid-cooled plate designs. The results show that the regions with synergy angles below 90° appear adjacent to the front and rear ends of each flow obstruction, whether rectangular or hexagonal. The corner regions of the plates also produce good field synergy because of the low-velocity recirculation zones there.
Given that the enhanced heat transfer zone contains many more hexagons than conventional plates contain rectangular spacers, the total area characterized by synergy angles of less than 90° is far larger in the bionic liquid-cooled plate than in the conventional design. From a boundary-layer perspective, each obstruction destroys the developing boundary layer. The coolant then must restart the boundary layer as it flows around the obstruction. In the hexagon tree-root arrangement, this cycle of boundary-layer breakup and regeneration occurs repeatedly until the coolant leaves the enhanced heat transfer zone. These repeated disruptions produce significantly higher heat transfer coefficients near the walls. Thus, the synergy angle distribution provides a physically grounded explanation for why the bionic liquid-cooled plate produces better cooling performance and temperature uniformity for the high-voltage battery system.
12. Effect of Cooling Medium Temperature
To fully characterize the bionic liquid-cooled plate’s thermal behavior across realistic usage conditions, I systematically varied key operational parameters while holding all other variables constant. In the first set of runs, the heat generation was fixed at 785 W/m² and the coolant velocity at 0.2 m/s, while the coolant inlet temperature was set to 25 °C, 30 °C, and 35 °C. I recorded both the temperature distributions at increasing distances from the inlet and the transient temperature response over a 300 s period.
Figure 7 reveals that the temperature increases progressively along the coolant flow direction. In the initial section before the enhanced heat transfer zone, heat is absorbed gradually. Once the coolant enters the hexagonal region, the enhanced heat transfer draws more heat from the surrounding solid, causing the coolant temperature to rise further. The temperature increases along the flow path possessed similar slopes for all three inlet temperatures.
Crucially, the difference between the outlet and inlet temperatures remained nearly identical across all three cases at approximately 4.17 °C. This matching temperature increase suggests that, provided the inlet flow rate is constant, the amount of heat the coolant can absorb is largely independent of the initial temperature. The actual outlet temperature, therefore, is offset by the different inlet temperatures: for a coolant inlet temperature of 25 °C, the plate operates around 29.17 °C; for 30 °C, around 34.17 °C; and for 35 °C, around 39.17 °C. All within the acceptable operating window for a high-voltage battery, but indicating that managing the inlet temperature can shift the overall operating point.
The transient temperature contours demonstrate that inlet temperature has a strong impact not only on the terminal temperature but also on the thermal stabilization time. A coolant inlet temperature of 25 °C reaches steady state at about 150 seconds, whereas 30 °C requires about 200 seconds, and 35 °C requires about 250 seconds. With a 25 °C inlet temperature, the plate initially cools down before rising to an equilibrium value. With a 35 °C inlet temperature, the plate warms up continuously. The 30 °C case holds the plate near its initial value before stabilization, which makes it the most attractive for practical implementation in marine power systems.
13. Effect of Cooling Medium Flow Velocity
The second external parameter I investigated was coolant velocity, set to 0.1, 0.2, and 0.3 m/s at a fixed inlet temperature of 30 °C and heat flux of 785 W/m². Our earlier study had already shown that increasing velocity reduces the maximum temperature. In this analysis, I focused on quantifying the effect on temperature distribution along the flow direction and the transient thermal behavior.
With increasing coolant velocity, the temperature rise from inlet to outlet decreased. More specifically, at 0.1 m/s, the temperature increased by about 8 °C along the plate. At 0.2 m/s, the temperature increase was only 4.17 °C. At 0.3 m/s, the temperature increase shrank further to 2.84 °C. This trend makes physical sense: because the heat generation rate is constant, the cooling capacity is dominated by the mass flow rate, which scales linearly with velocity. As velocity increases, more coolant flows through the plate per unit time, each element of coolant absorbing proportionally less heat, leading to a smaller increase in coolant temperature along the plate.
The transient temperature contours show that higher velocities also accelerate the time to reach steady state. At 0.3 m/s, the plate reaches equilibrium in about 100 seconds; at 0.2 m/s, it takes about 150 seconds; at 0.1 m/s, it takes about 250 seconds. For the high-voltage battery thermal management system, quicker stabilization is beneficial because it reduces the time the battery spends outside its preferred thermal operating window during load transients.
From a control perspective, higher velocities allow a much more responsive thermal management strategy. The 0.2 m/s configuration controls the battery plate temperature near 34.17°C at thermal steady state, and the 0.3 m/s configuration brings it to 32.84°C. Both of these values fall comfortably within the acceptable operating range for high-performance high-voltage battery packs. However, the incremental cooling benefit from increasing the velocity is offset by increased pumping power. Therefore, in engineering practice the desired coolant velocity must be selected by balancing the marginal cooling benefit against the energy cost. In a typical marine battery environment, operating with a velocity of 0.2 m/s appears to give good thermal control while maintaining reasonable energy consumption.
14. Effect of Heat Generation Rate
In addition to operating conditions of the cooling loop, the heat generation rate of the high-voltage battery itself varies as a function of the discharge C-rate and ambient temperature. To assess the capacity of the bionic liquid-cooled plate to handle variable thermal loads, I performed simulations at heat fluxes of 400, 600, 785, 1000, and 1200 W/m². The coolant inlet temperature was maintained at 30 °C and the velocity at 0.2 m/s.
The temperature along the flow direction increases as expected for each heat flux value. However, the temperature rise along the plate scales directly with heat generation. At 400 W/m², the temperature increase is only 2.12 °C, while at 1200 W/m² the temperature increase reaches 6.37 °C. The temperature rise appears to scale almost perfectly linearly with the heat flux level. This linear trend confirms that the bionic liquid-cooled plate’s cooling capability under fixed flow conditions is predominantly determined by the heat input.
In terms of transient behavior, differences in the heat generation rate affect the thermal stabilization time only when exceeding a certain threshold. For heat generation rates between 400 and 785 W/m², the plate reaches steady state in about 150 seconds. At 1000 and 1200 W/m², however, steady state requires roughly 200 seconds. This suggests that at higher heat loads the plate must accumulate more heat before reaching a balanced state, prolonging the transient period.
Importantly, the maximum temperatures remain within safe operating limits for the high-voltage battery across the entire range of tested heat generation rates, up to and including 1200 W/m². This thermal robustness stems from the effective heat spreading and enhanced convective heat transfer present in the hexagonal tree-root region. The bionic liquid-cooled plate therefore offers a robust solution for high-voltage battery thermal management even under aggressive discharge conditions.
15. Conclusions and Design Guidelines
From this comprehensive investigation of a bionic liquid-cooled plate for marine high-voltage battery thermal management, I have drawn several key conclusions and practical design guidelines:
(1) The combination of hexagonal geometry and tree-root-like packing significantly improves thermal performance. A properly designed bionic enhanced heat transfer zone reduces the maximum temperature by 0.7 °C and greatly improves temperature uniformity when compared with a conventional liquid-cooled plate design. By comparing both conventional and bionic designs under identical inlet and outlet conditions, I have confirmed that the measured benefits stem directly from the internal structure of the plate rather than from any change in inlet conditions.
(2) The bionic liquid-cooled plate reduces pressure drop substantially. In optimized configurations, the bionic liquid-cooled plate reduces pressure drop by 14.2 % compared with a conventional liquid-cooled plate. Because the coolant flow rate is identical among the designs tested, lower pressure drop directly implies lower pump power consumption—therefore, this plate is expected to enable energy savings for a given cooling duty.
(3) Excellent synergy between the velocity field and temperature gradient field is a key enabler of heat-transfer enhancement. The field synergy angle analysis shows that grid of hexagons creates many more zones with a synergy angle below 90°, which helps to maximize the effectiveness of convective heat transfer. Each hexagonal column also functions as a boundary-layer trip, periodically interrupting the thermal boundary layer and restarting it, which further intensifies heat transfer.
(4) The inlet coolant temperature does not affect the achievable temperature rise across the cooling plate; it simply shifts the absolute operating temperature. For a given heat load and flow rate, the temperature increase along the plate is constant, around 4.17 °C. A lower coolant inlet temperature improves the maximum temperature and shortens the time required for the plate to reach steady state.
(5) Increasing coolant flow velocity enhances heat transfer but with diminishing returns. In our tests, flow velocity exerts the strongest influence on the temperature distribution during the initial transient phase, while the steady-state temperature is only marginally affected. Since the pump energy scales steeply with velocity, an optimal operating point occurs near 0.2 m/s for the examined thermal management system.
(6) The heat generation rate of a high-voltage battery determines the total temperature rise along the liquid-cooled plate. The relationships reveal that the temperature rise along the flow direction is proportional to the heat generation rate. For heat loads up to 1200 W/m², the proposed bionic liquid-cooled plate is capable of maintaining the plate temperature within the safe operating range for lithium-ion batteries, offering broad applicability for battery thermal management.
In conclusion, the bionic liquid-cooled plate presented in this thesis provides a reliable and effective thermal management solution for marine high-voltage battery modules. The tree-root inspired arrangement of hexagonal columns creates an internal structure that simultaneously improves the cooling capability and reduces the pumping power needed relative to a conventional liquid-cooled plate. These advantages can be directly applied in the design of future marine battery thermal management systems, with positive implications for both battery longevity and system energy efficiency.