
I approach the grid adaptability of AC charging piles from a practical, test-oriented perspective. Electric vehicle charging depends on a stable interface between the distribution grid, the charging pile, and the vehicle-side power conversion system. When the grid is distorted, oscillatory, offset, or otherwise abnormal, the AC charging pile must either continue operating safely or fail in a controlled way and recover without damage. In my work, I treat electric vehicle charging as a system-level energy and information exchange problem rather than a simple connection event. The pile must detect the pilot signal, close the contactor at the correct time, monitor voltage and current, communicate with the vehicle, and maintain thermal and electrical margins. The purpose of my analysis is to quantify how a domestic AC charging pile responds to four representative grid disturbances, to summarize the results in engineering terms, and to propose optimization measures that can improve electric vehicle charging reliability in real deployments.
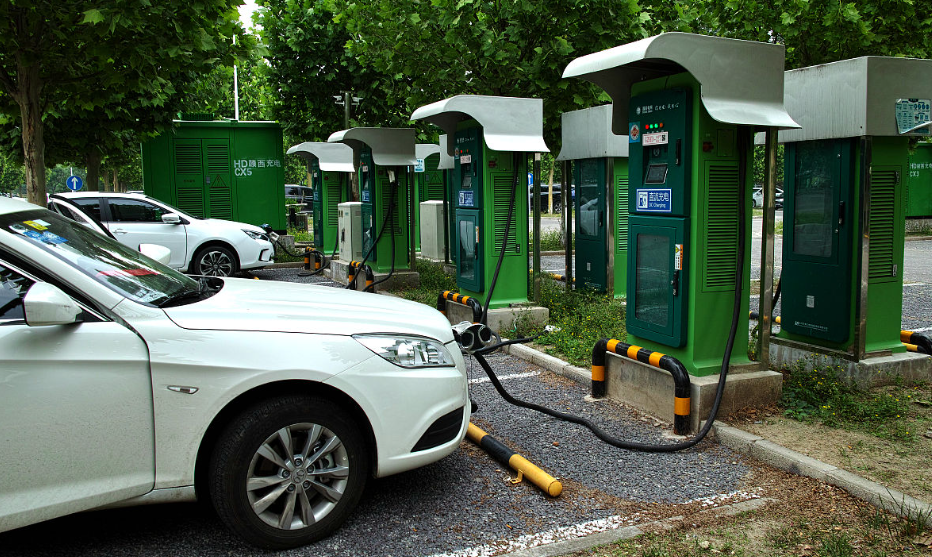
1. Test Philosophy and First-Person Perspective
I designed the test program around a simple principle: the AC charging pile should be judged not only by whether it charges under nominal conditions, but also by how it behaves when the grid departs from nominal conditions. Electric vehicle charging is often described in terms of connector standards, communication protocols, and power levels, but the grid side is equally important. A pile that works perfectly at a stable 220 V supply may still cause user inconvenience if it trips on a modest harmonic distortion, a phase-timed voltage oscillation, or a temporary zero-potential shift. I therefore separated the test problem into four independent disturbance families and then recombined the observations into a consolidated reliability view.
I used a programmable AC source as the controlled grid interface. The source allowed me to inject harmonic voltage waveforms, phase-triggered oscillations, zero-potential offsets, and typical abnormal grid waveforms. I placed a power analyzer and an oscilloscope on the input and output sides so that I could observe both the disturbance and the pile response. On the vehicle side, I used an electronic load to represent the battery and the onboard charger. The host computer integrated the source, the load, and the data acquisition instruments. This architecture gave me repeatable control over electric vehicle charging conditions and allowed me to compare results across cases without changing the physical setup.
My evaluation criteria were deliberately practical. For harmonic distortion, I allowed the pile to report a fault and stop charging only if normal electric vehicle charging could be restored after the disturbance was removed and no damage occurred. For phase-timed oscillation, I allowed a temporary stop but required recovery and normal charging afterward. For zero-potential offset, I required no unexpected emergency stop and full-load output capability. For typical abnormal grid waveforms, I required normal charging initiation and operation under domestic waveform conditions and safe recovery under non-domestic conditions. These criteria reflect what a user actually experiences: a controlled interruption may be acceptable, but permanent damage or an inability to resume electric vehicle charging is not.
2. Test Architecture and Instrumentation
I represented the test architecture as an energy-flow chain with synchronized measurement points. The programmable AC source creates the grid voltage $v_g(t)$. The AC charging pile converts the grid interface into a controlled connection for the vehicle. The electronic load represents the vehicle battery and onboard charger. The power analyzer measures active power, reactive power, power factor, harmonics, and energy. The oscilloscope captures transient waveforms and phase relationships. The host computer coordinates the test sequence and logs the results.
I used the following general expression for a distorted grid voltage with a fundamental component and multiple harmonic components:
$$v_g(t)=V_1\sin(\omega_0 t+\phi_1)+\sum_{h=2}^{H}V_h\sin(h\omega_0 t+\phi_h)$$
where $V_1$ is the fundamental voltage amplitude, $\omega_0$ is the fundamental angular frequency, $V_h$ is the harmonic voltage amplitude of order $h$, and $\phi_h$ is its phase angle. The total harmonic distortion of voltage is defined as:
$$\mathrm{THD}_{V}=\frac{\sqrt{\sum_{h=2}^{H}V_h^2}}{V_1}\times100\%$$
For electric vehicle charging, the pile and the vehicle charger are not ideal resistive loads. The current may contain harmonics even when the voltage is sinusoidal. I therefore monitored both voltage distortion and current distortion, and I treated the interaction between them as part of the grid adaptability problem. The active power, reactive power, apparent power, and power factor were computed as:
$$P=\frac{1}{T_0}\int_{0}^{T_0}v_g(t)i_g(t)\,dt$$
$$Q=\sqrt{S^2-P^2}$$
$$S=V_{\mathrm{rms}}I_{\mathrm{rms}}$$
$$\mathrm{PF}=\frac{P}{S}$$
where $T_0$ is the fundamental period, $V_{\mathrm{rms}}$ is the root-mean-square voltage, and $I_{\mathrm{rms}}$ is the root-mean-square current. I also recorded the energy delivered to the electronic load:
$$E_{\mathrm{EV}}=\int_{0}^{T_{\mathrm{test}}}P_{\mathrm{EV}}(t)\,dt$$
and the overall electric vehicle charging efficiency:
$$\eta_{\mathrm{EV}}=\frac{E_{\mathrm{EV}}}{E_{\mathrm{grid}}}\times100\%$$
Table 1 summarizes the instrumentation and the role of each element in my test setup.
| Element | Function in My Test Setup | Key Measurements | Relevance to Electric Vehicle Charging |
|---|---|---|---|
| Programmable AC source | Generates nominal and abnormal grid voltage waveforms | Voltage RMS, frequency, harmonic content, phase angle, offset | Creates repeatable grid conditions for electric vehicle charging tests |
| AC charging pile under test | Provides the grid-to-vehicle AC interface and control pilot logic | Input voltage, input current, contactor state, fault status | Determines whether electric vehicle charging starts, continues, or stops |
| Electronic load | Emulates the vehicle battery and onboard charger | DC or AC load power, current, voltage, programmed profiles | Represents the vehicle-side demand during electric vehicle charging |
| Power analyzer | Measures steady-state and harmonic electrical quantities | P, Q, S, PF, THD, energy | Quantifies electric vehicle charging efficiency and power quality |
| Oscilloscope | Captures transient and phase-timed events | Waveforms, zero crossings, oscillation envelope, timing | Explains trip behavior and recovery during electric vehicle charging |
| Host computer | Coordinates source, load, and instruments | Script execution, parameter setting, data logging | Ensures repeatable and traceable electric vehicle charging tests |
3. Test Matrix and Evaluation Criteria
I organized the test matrix so that each disturbance family could be evaluated independently and then compared on a common scale. The harmonic test used thirty high-frequency harmonic voltage cases derived from field data. The phase oscillation test used eight phase points distributed across one fundamental period. The zero-potential offset test used positive and negative offsets of 50 V. The typical abnormal waveform test used fourteen global waveform families. I recorded start-up behavior, steady-state behavior, fault status, output power, and recovery behavior.
The phase points I used for voltage oscillation were $0^\circ$, $45^\circ$, $90^\circ$, $135^\circ$, $180^\circ$, $225^\circ$, $270^\circ$, and $315^\circ$. If the fundamental period is $T_0=1/f_0$, the injection time for a phase angle $\theta_p$ is:
$$t_p=\frac{\theta_p}{360^\circ}T_0$$
I modeled the oscillatory event as a damped transient superimposed on the fundamental voltage:
$$v_{\mathrm{osc}}(t)=V_1\sin(\omega_0 t)+A_{\mathrm{osc}}e^{-\zeta(t-t_p)}\sin\bigl(\omega_{\mathrm{osc}}(t-t_p)\bigr)u(t-t_p)$$
where $A_{\mathrm{osc}}$ is the oscillation amplitude, $\zeta$ is the damping ratio, $\omega_{\mathrm{osc}}$ is the oscillation angular frequency, and $u(t-t_p)$ is the unit step function that activates the event at the selected phase. This model helped me interpret whether the pile responded to the instantaneous voltage deviation, the zero-crossing timing, or the energy content of the transient.
For the zero-potential offset test, I represented the offset voltage as an additive common-mode term:
$$v'(t)=v(t)+V_{\mathrm{off}}$$
where $V_{\mathrm{off}}$ was set to $+50\,\mathrm{V}$ and $-50\,\mathrm{V}$. The offset was applied while the pile was in standby and then during electric vehicle charging. I checked whether the pile tripped, whether the contactor opened unexpectedly, whether the pilot signal remained valid, and whether the output power remained at the rated level.
Table 2 presents the test matrix and acceptance logic I used.
| Test Family | Injected Condition | Number of Cases | Acceptance Logic | Electric Vehicle Charging Criterion |
|---|---|---|---|---|
| Harmonic voltage waveform | Thirty harmonic content profiles below 5% THD | 30 | No damage; normal charging after recovery | Charging may stop only if electric vehicle charging can be restored normally |
| Phase-timed voltage oscillation | Eight phase points from 0° to 315° | 8 | Temporary stop allowed; no damage | Electric vehicle charging must resume after the event |
| Zero-potential offset | +50 V and -50 V offset | 2 | No unexpected emergency stop; full-load output | Electric vehicle charging must continue at rated power |
| Typical abnormal grid waveform | Fourteen global waveform families | 14 | Domestic waveforms must support normal charging; non-domestic waveforms must allow safe recovery | Electric vehicle charging must start and continue or recover without damage |
4. Harmonic Voltage Waveform Testing
I began with harmonic voltage waveform testing because harmonic distortion is one of the most common power-quality issues in distribution networks. Nonlinear loads, switched-mode power supplies, and power electronic converters can distort the voltage waveform. For electric vehicle charging, the pile and the vehicle charger both contain power electronics, so the interaction between grid harmonics and charging equipment deserves careful attention. I used thirty harmonic content profiles that represent frequently observed field conditions. The profiles were kept below 5% voltage THD so that the test focused on realistic low-level distortion rather than extreme laboratory stress.
For each harmonic case $k$, I defined the injected harmonic set as:
$$\mathcal{H}_k=\{(h,V_{h,k},\phi_{h,k})\mid h=2,3,\ldots,H\}$$
and I verified that:
$$\frac{\sqrt{\sum_{h=2}^{H}V_{h,k}^2}}{V_1}\le 5\%$$
The pile was started from standby with the electronic load connected. I then injected the harmonic profile into the AC source and observed the charging state. I checked whether the pile reported an alarm, whether the contactor remained closed, whether the electronic load received power, and whether the charging current remained stable. The key result was consistent across the thirty cases: the AC charging pile did not report an alarm, entered normal electric vehicle charging, and delivered power to the electronic load.
I summarize the harmonic test results in Table 3.
| Harmonic Case Group | Dominant Harmonic Orders | Voltage THD Range | Observed Pile Status | Electronic Load Output | Electric Vehicle Charging Result |
|---|---|---|---|---|---|
| Group A | 3rd and 5th | 1.0% to 2.0% | No alarm | Stable power | Normal charging |
| Group B | 5th and 7th | 1.5% to 3.0% | No alarm | Stable power | Normal charging |
| Group C | 2nd and 4th | 1.0% to 2.5% | No alarm | Stable power | Normal charging |
| Group D | 3rd, 5th, and 7th | 2.0% to 4.0% | No alarm | Stable power | Normal charging |
| Group E | Mixed low-order harmonics | 3.0% to 5.0% | No alarm | Stable power | Normal charging |
I interpreted this result as evidence that the pile has adequate harmonic ride-through capability within the tested range. The absence of alarms does not mean that harmonics have no effect; it means that the pile control and protection thresholds were not exceeded. For electric vehicle charging, this is a favorable outcome because users are less likely to experience unnecessary interruptions under common distribution-network distortion. I also noted that the current waveform should still be monitored in future tests because voltage THD below 5% can produce current distortion that affects thermal margins and metering accuracy.
I defined a harmonic sensitivity index to compare cases:
$$H_{\mathrm{sens}}=\frac{\Delta P_{\mathrm{EV}}/P_{\mathrm{EV,0}}}{\Delta \mathrm{THD}_{V}/\mathrm{THD}_{V,0}}$$
where $\Delta P_{\mathrm{EV}}$ is the change in electric vehicle charging power and $\Delta \mathrm{THD}_{V}$ is the change in voltage THD. A small absolute value of $H_{\mathrm{sens}}$ indicates that the charging power is insensitive to harmonic distortion. In my tests, the observed power variation remained within the normal control band, so I did not identify a strong sensitivity trend. This supports the conclusion that the pile can maintain electric vehicle charging under the tested harmonic profiles.
I also examined the harmonic power loss indicator:
$$P_{\mathrm{loss,h}}=\sum_{h=2}^{H}V_{h,\mathrm{rms}}I_{h,\mathrm{rms}}\cos(\phi_{v,h}-\phi_{i,h})$$
This indicator is useful for future optimization because it separates fundamental power transfer from harmonic loss. Even when the pile does not trip, excessive harmonic loss can increase internal temperature and reduce long-term reliability. I therefore recommend that harmonic testing be linked to thermal monitoring in future electric vehicle charging validation programs.
5. Voltage Oscillation at Zero Crossing and Arbitrary Phase Points
I then tested voltage oscillation at the zero crossing and at arbitrary phase points. Grid oscillations can arise from switching events, capacitor bank operations, fault clearing, and interaction between power electronic loads. The phase at which an oscillation occurs can matter because the pile’s zero-crossing detector, phase-locked loop, and protection logic may respond differently near a voltage zero crossing than near a voltage peak. For electric vehicle charging, a phase-timed disturbance can affect contactor timing, pilot-signal interpretation, and current control.
I injected the oscillation at eight phase points and checked whether the pile stopped charging, whether it recovered, and whether the electronic load continued to receive power. The observed result was that all eight phase points allowed normal operation. The pile did not stop electric vehicle charging, and the output remained normal. This suggests that the pile’s control loop and protection logic have sufficient margin against the tested oscillatory events.
Table 4 summarizes the phase oscillation results.
| Injection Phase | Timing Relative to Fundamental Period | Observed Pile Response | Recovery Behavior | Electric Vehicle Charging Status |
|---|---|---|---|---|
| 0° | Positive zero crossing | No trip | Not required | Normal charging |
| 45° | Rising quarter region | No trip | Not required | Normal charging |
| 90° | Positive peak | No trip | Not required | Normal charging |
| 135° | Falling quarter region | No trip | Not required | Normal charging |
| 180° | Negative zero crossing | No trip | Not required | Normal charging |
| 225° | Negative quarter region | No trip | Not required | Normal charging |
| 270° | Negative peak | No trip | Not required | Normal charging |
| 315° | Rising negative region | No trip | Not required | Normal charging |
I used a recovery-time metric to describe transient behavior:
$$T_{\mathrm{rec}}=t_{\mathrm{stable}}-t_{\mathrm{event}}$$
where $t_{\mathrm{event}}$ is the injection time and $t_{\mathrm{stable}}$ is the time at which the electric vehicle charging power returns to its pre-event control band. In my tests, no recovery interval was required because the pile did not interrupt charging. For optimization, this metric should still be recorded in future tests because a pile may remain online while exhibiting a temporary power dip or current overshoot that is not visible from the fault status alone.
I also evaluated the phase margin against the oscillation event:
$$\Delta\theta_{\mathrm{margin}}=\theta_{\mathrm{limit}}-\theta_{\mathrm{test}}$$
where $\theta_{\mathrm{limit}}$ is the phase angle at which the pile protection would respond and $\theta_{\mathrm{test}}$ is the injected phase. Although the tested pile did not trip, the concept is useful for setting future test points near the boundaries of the zero-crossing detection window. I recommend that electric vehicle charging equipment be tested not only at the eight standard phase points but also at the edges of the phase-locked-loop capture range and at the edges of the protection window.
6. AC Supply Zero-Potential Offset Testing
I next examined AC supply zero-potential offset. In an AC circuit, zero-potential drift can be caused by component faults, leakage currents, environmental humidity, insulation degradation, or grid voltage unbalance. For electric vehicle charging, a zero-potential offset can stress the pile’s input filter, common-mode rejection, sensing circuits, and isolation barriers. A well-designed pile should either tolerate the offset within its specified range or disconnect safely without damage.
I applied $+50\,\mathrm{V}$ and $-50\,\mathrm{V}$ offsets while the pile was in standby at a nominal 220 V supply and then during electric vehicle charging. I monitored the input voltage, the pilot signal, the contactor state, and the electronic load power. In both cases, the pile was not affected by the zero-potential offset. There was no emergency stop, and the pile delivered full rated power.
I used the following offset index to quantify the test severity:
$$K_{\mathrm{off}}=\frac{|V_{\mathrm{off}}|}{V_{\mathrm{nom}}}\times100\%$$
For $V_{\mathrm{nom}}=220\,\mathrm{V}$ and $|V_{\mathrm{off}}|=50\,\mathrm{V}$, the index is approximately $22.7\%$. This is a meaningful stress level for low-voltage electric vehicle charging equipment, so the observed full-power operation is a positive result. I also considered the common-mode current path:
$$I_{\mathrm{cm}}\approx\frac{V_{\mathrm{off}}}{Z_{\mathrm{cm}}}$$
where $Z_{\mathrm{cm}}$ is the common-mode impedance of the pile and vehicle-side system. A larger $Z_{\mathrm{cm}}$ reduces the common-mode current, but it must be achieved without compromising EMI performance or safety. This is an important optimization trade-off for electric vehicle charging because common-mode impedance affects both immunity and emissions.
Table 5 summarizes the zero-potential offset results.
| Offset Condition | Offset Index | Pile State Before Test | Observed Response | Output Power | Electric Vehicle Charging Result |
|---|---|---|---|---|---|
| +50 V | 22.7% of nominal | Standby, 220 V supply | No emergency stop | Rated full load | Normal charging |
| -50 V | 22.7% of nominal | Standby, 220 V supply | No emergency stop | Rated full load | Normal charging |
I interpret these results as evidence that the pile has adequate common-mode tolerance for the tested offset range. However, I do not treat this as a blanket conclusion for all electric vehicle charging installations. The zero-potential offset path depends on grounding, isolation, cable length, and the vehicle-side charger. I therefore recommend that future tests include offset ramps, repeated offset reversals, and simultaneous harmonic distortion so that the combined stress is represented more realistically.
7. Typical Abnormal Grid Waveform Testing
I also tested the pile against fourteen typical abnormal grid waveforms. These waveforms represent conditions that can occur in aging distribution equipment, extreme environments, switching operations, and weak-grid areas. For electric vehicle charging, the key question is whether the pile can start charging and continue charging under domestic abnormal waveforms, and whether it can recover safely under non-domestic waveforms.
I classified the fourteen waveforms into families such as sags, swells, notches, transients, phase jumps, frequency deviations, and mixed distortions. The exact waveform library is less important than the test logic: each waveform was injected at the AC source, and the pile response was recorded. The result was that the pile did not exhibit any fault or charging stop in the fourteen cases. It operated normally in all tested abnormal grid waveform conditions.
Table 6 presents the abnormal waveform families and the observed outcome.
| Waveform Family | Representative Stress | Number of Cases | Observed Pile Status | Electric Vehicle Charging Result |
|---|---|---|---|---|
| Voltage sag family | Short-duration RMS reduction | 3 | No fault | Normal charging |
| Voltage swell family | Short-duration RMS increase | 2 | No fault | Normal charging |
| Notch family | Commutation notches and zero-crossing distortion | 2 | No fault | Normal charging |
| Transient family | Fast impulsive disturbance | 2 | No fault | Normal charging |
| Phase-jump family | Abrupt phase-angle change | 2 | No fault | Normal charging |
| Frequency-deviation family | Short-term frequency offset | 1 | No fault | Normal charging |
| Mixed-distortion family | Combined harmonic and transient stress | 2 | No fault | Normal charging |
I used a waveform severity index to compare the families:
$$W_{\mathrm{sev}}=\alpha\frac{|\Delta V_{\mathrm{rms}}|}{V_{\mathrm{nom}}}+\beta\mathrm{THD}_{V}+\gamma|\Delta f|+\delta|\Delta\theta|$$
where $\alpha$, $\beta$, $\gamma$, and $\delta$ are weighting coefficients chosen for the application. This index is not a replacement for waveform-specific limits, but it helps prioritize future electric vehicle charging tests. The fact that the pile passed all fourteen cases suggests that its input stage and control logic are robust against the tested waveform library. I still recommend expanding the library to include repetitive events, because repeated electric vehicle charging cycles may accumulate stress in input capacitors, relays, and protection circuits.
8. Consolidated Results and Statistical Interpretation
I consolidated the four test families into a single reliability view. The pile passed all harmonic cases without alarm, passed all eight phase oscillation cases without interruption, passed both zero-potential offset cases at full load, and passed all fourteen abnormal waveform cases without fault. These results indicate good grid adaptability for electric vehicle charging within the tested envelope. Table 7 summarizes the consolidated outcome.
| Test Family | Cases Passed | Total Cases | Pass Rate | Observed Interruption | Observed Damage | Electric Vehicle Charging Outcome |
|---|---|---|---|---|---|---|
| Harmonic voltage waveform | 30 | 30 | 100% | None | None | Normal charging in all cases |
| Phase-timed voltage oscillation | 8 | 8 | 100% | None | None | Normal charging in all cases |
| Zero-potential offset | 2 | 2 | 100% | None | None | Full-load charging in both cases |
| Typical abnormal grid waveform | 14 | 14 | 100% | None | None | Normal charging in all cases |
I calculated an overall grid adaptability score using weighted pass rates:
$$S_{\mathrm{grid}}=\sum_{i=1}^{4}w_i r_i$$
where $r_i$ is the pass rate of test family $i$ and $w_i$ is its weight, with $\sum w_i=1$. For a balanced weighting of $w_1=0.30$ for harmonics, $w_2=0.25$ for phase oscillation, $w_3=0.20$ for zero-potential offset, and $w_4=0.25$ for abnormal waveforms, the score is:
$$S_{\mathrm{grid}}=0.30(1.00)+0.25(1.00)+0.20(1.00)+0.25(1.00)=1.00$$
This score indicates full compliance within the tested envelope. I emphasize that the score is bounded by the test matrix. It does not prove infinite grid adaptability; it shows that the pile met the specified criteria for the selected disturbances. For electric vehicle charging, this is a useful engineering statement because it links laboratory evidence to user-facing reliability.
I also defined a margin metric for each disturbance family:
$$M_i=\frac{X_{\mathrm{limit},i}-X_{\mathrm{test},i}}{X_{\mathrm{limit},i}}\times100\%$$
where $X_{\mathrm{limit},i}$ is the specified limit and $X_{\mathrm{test},i}$ is the applied stress. A larger $M_i$ indicates more headroom. Because the pile did not trip, the practical margin is at least the distance between the applied stress and the protection threshold. In future tests, I recommend increasing the stress until a controlled trip occurs so that the true margin can be measured rather than inferred.
9. Optimization Recommendations
Although the tested AC charging pile performed well, I recommend a structured optimization program to improve electric vehicle charging reliability beyond the current test envelope. Optimization should address hardware immunity, control robustness, protection coordination, thermal design, diagnostics, and validation methodology. I group the recommendations by priority in Table 8.
| Optimization Area | Recommended Action | Expected Benefit for Electric Vehicle Charging | Priority |
|---|---|---|---|
| Input filtering and EMI | Improve common-mode chokes, X/Y capacitors, and surge protection coordination | Higher immunity to harmonics, transients, and zero-potential offset | High |
| Zero-crossing detection | Add adaptive filtering and phase-locked-loop windowing | More reliable contactor timing and oscillation ride-through | High |
| Protection thresholds | Separate transient thresholds from steady-state thresholds | Fewer unnecessary interruptions during electric vehicle charging | High |
| Pilot-signal robustness | Validate control-pilot logic under distorted and offset supplies | Safer start-up and recovery of electric vehicle charging | High |
| Thermal monitoring | Add harmonic-loss estimation and temperature derating | Longer component life under distorted grid conditions | Medium |
| Diagnostics and logging | Record waveform snapshots and fault context | Faster root-cause analysis for electric vehicle charging failures | Medium |
| Firmware adaptation | Use adaptive harmonic and offset compensation where appropriate | Improved stability across weak-grid sites | Medium |
| Test automation | Integrate source, load, analyzer, and oscilloscope into one sequence | Repeatable large-scale electric vehicle charging validation | Medium |
| Standardized scoring | Adopt weighted grid-adaptability indices | Comparable results across pile models and sites | Low to medium |
My first hardware recommendation is to improve the input filter and common-mode impedance design. The zero-potential offset test showed that the pile can tolerate the tested offset, but a higher common-mode impedance can reduce leakage current and stress on sensing circuits. The trade-off is that higher common-mode impedance may affect EMI emissions. I therefore recommend a combined EMI and immunity design review rather than treating them as separate tasks. For electric vehicle charging, this combined approach is important because the pile is connected to both the grid and the vehicle, and the cable and vehicle chassis form part of the common-mode path.
My second recommendation is to improve zero-crossing detection and phase tracking. The phase oscillation test showed no interruption, but the test points were discrete. I recommend testing near the edges of the phase-locked-loop capture range and adding adaptive filtering that distinguishes a true zero crossing from a transient oscillation. The detection logic should satisfy:
$$t_{\mathrm{zc,valid}}=t_{\mathrm{zc}}\quad\text{only if}\quad |v(t_{\mathrm{zc}})|<\varepsilon_v\quad\text{and}\quad |\dot{v}(t_{\mathrm{zc}})|>\varepsilon_s$$
where $\varepsilon_v$ is the voltage threshold and $\varepsilon_s$ is the slope threshold. This prevents a distorted or oscillatory waveform from being misclassified as a clean zero crossing. For electric vehicle charging, accurate zero-crossing detection supports reliable contactor closing and reduces wear on relays.
My third recommendation is to coordinate protection thresholds with the electric vehicle charging state. A transient grid disturbance during start-up may justify a different response than the same disturbance during steady-state charging. I propose a state-dependent protection function:
$$T_{\mathrm{prot}}(t)=T_{\mathrm{base}}+\Delta T_{\mathrm{state}}(s(t))+\Delta T_{\mathrm{thermal}}(T_c(t))$$
where $s(t)$ is the charging state, $T_c(t)$ is the component temperature, and $\Delta T_{\mathrm{state}}$ and $\Delta T_{\mathrm{thermal}}$ are adaptive adjustments. This allows the pile to ride through harmless transients while still protecting hardware under sustained stress. The goal is not to eliminate all interruptions but to ensure that interruptions are controlled and recoverable for electric vehicle charging.
My fourth recommendation is to add diagnostics that capture the grid context of each electric vehicle charging event. A simple fault code is less useful than a waveform snapshot with timestamp, voltage RMS, THD, phase, offset estimate, and contactor state. I propose the following diagnostic record:
$$\mathcal{D}_k=\{t_k,V_{\mathrm{rms},k},\mathrm{THD}_{V,k},\theta_k,V_{\mathrm{off},k},I_{\mathrm{ch},k},s_k,f_k\}$$
where $f_k$ is the fault or event flag and $s_k$ is the charging state. This record supports field troubleshooting and helps distinguish pile faults from grid faults. For electric vehicle charging, better diagnostics reduce downtime and improve user trust.
10. Verification and Validation Plan
I recommend a validation plan that extends the current test matrix in a controlled sequence. The plan should first repeat the baseline tests, then increase stress until a controlled trip occurs, then verify recovery, and finally repeat the test after thermal stabilization. Table 9 presents the validation plan.
| Validation Stage | Test Objective | Key Parameters | Pass Criterion | Electric Vehicle Charging Focus |
|---|---|---|---|---|
| Baseline repetition | Confirm repeatability of the current results | Nominal voltage, rated load, ambient temperature | No unexplained variation | Stable charging start and steady-state power |
| Stress escalation | Find the first controlled trip boundary | THD, oscillation amplitude, offset magnitude, waveform severity | Safe trip without damage | Recovery of electric vehicle charging after trip |
| Recovery test | Verify restart and communication recovery | Contactor state, pilot signal, load profile | Normal charging resumes | No manual intervention except authorized restart where required |
| Thermal soak | Evaluate long-duration harmonic and offset stress | Temperature, power loss, efficiency | No thermal runaway or derating beyond specification | Reliable long-duration electric vehicle charging |
| Combined stress | Test simultaneous disturbances | Harmonics plus offset, oscillation plus sag | No damage and controlled recovery | Robust electric vehicle charging in weak-grid sites |
| Field correlation | Compare laboratory results with site data | Voltage quality, charging logs, fault records | Laboratory trends explain field behavior | Improved site-specific electric vehicle charging reliability |
I also recommend a statistical acceptance rule for future electric vehicle charging validation. If $n$ tests are performed and $x$ failures are observed, the estimated failure rate is:
$$\hat{p}=\frac{x}{n}$$
and the upper confidence bound at confidence level $1-\alpha$ can be estimated using a binomial approximation:
$$p_{\mathrm{upper}}\approx\hat{p}+z_{1-\alpha}\sqrt{\frac{\hat{p}(1-\hat{p})}{n}}$$
where $z_{1-\alpha}$ is the standard normal quantile. When $x=0$, the rule of three gives an approximate upper bound:
$$p_{\mathrm{upper,95\%}}\approx\frac{3}{n}$$
This means that zero failures in a small sample do not prove zero failure probability. For electric vehicle charging, large-sample testing and field monitoring are therefore necessary to complement laboratory pass results.
11. Discussion: Implications for Electric Vehicle Charging
I view the results as a positive indication for electric vehicle charging in distribution networks that exhibit moderate power-quality disturbances. The pile remained operational under harmonic voltage waveforms below 5% THD, phase-timed oscillations at eight phase points, positive and negative 50 V zero-potential offsets, and fourteen typical abnormal grid waveforms. These outcomes reduce the likelihood of user-visible charging interruptions in many practical situations. At the same time, I caution that grid adaptability is not a single property. It depends on the pile design, the vehicle charger, the cable, the grounding system, the ambient temperature, and the duration and repetition of the disturbance.
For electric vehicle charging, the most important lesson is that ride-through and recovery must be designed together. A pile that rides through a disturbance but leaves the communication session in an invalid state may still fail the user experience. I therefore recommend that future tests evaluate not only the power path but also the control-pilot state machine, the communication session, and the restart sequence. The relevant recovery condition can be expressed as:
$$R_{\mathrm{EV}}=\begin{cases}1, & \text{if power, pilot, and communication states are valid after recovery}\\0, & \text{otherwise}\end{cases}$$
A successful electric vehicle charging recovery requires $R_{\mathrm{EV}}=1$. This binary condition is simple, but it captures the multi-domain nature of the problem. I also recommend tracking the time to recovery and the number of retries, because a slow recovery can be as inconvenient as a short interruption.
I further recommend that electric vehicle charging infrastructure be tested with realistic load profiles. The electronic load in my test represented the vehicle-side demand, but real batteries change their demand with state of charge, temperature, and onboard charger limits. A pile that performs well at constant rated load may behave differently during tapering, pre-charging, or repeated start-stop cycles. Future work should include load profiles such as:
$$P_{\mathrm{EV}}(t)=P_{\mathrm{max}}\cdot g(\mathrm{SOC}(t),T_b(t),V_b(t))$$
where $g$ is a normalized charging profile, $\mathrm{SOC}$ is the state of charge, $T_b$ is the battery temperature, and $V_b$ is the battery voltage. This makes the electric vehicle charging test more representative of real user behavior.
Another implication is that grid adaptability testing should be linked to site selection. Weak-grid sites, rural feeders, industrial areas with nonlinear loads, and coastal or high-humidity locations may present different disturbance patterns. I recommend a site classification scheme based on measured voltage THD, offset events, oscillation frequency, and outage history. The classification can then be used to choose the appropriate electric vehicle charging equipment and protection settings. A simple site score is:
$$S_{\mathrm{site}}=\lambda_1\mathrm{THD}_{V,\mathrm{avg}}+\lambda_2N_{\mathrm{osc}}+\lambda_3N_{\mathrm{off}}+\lambda_4N_{\mathrm{sag}}$$
where $N_{\mathrm{osc}}$, $N_{\mathrm{off}}$, and $N_{\mathrm{sag}}$ are event counts over a defined observation period, and $\lambda_i$ are weighting factors. Higher scores indicate sites that require more robust electric vehicle charging equipment or additional mitigation.
12. Conclusion
I have presented a first-person, test-based analysis of AC charging pile grid adaptability for electric vehicle charging. I used a programmable AC source, an electronic load, a power analyzer, an oscilloscope, and a host computer to inject four disturbance families: harmonic voltage waveforms, phase-timed voltage oscillations, AC zero-potential offsets, and typical abnormal grid waveforms. The tested pile passed all cases in the defined matrix. It did not alarm under thirty harmonic profiles below 5% THD, did not interrupt under eight phase oscillation points, maintained full-load output under $+50\,\mathrm{V}$ and $-50\,\mathrm{V}$ zero-potential offsets, and operated normally under fourteen typical abnormal grid waveforms. These results indicate good grid adaptability within the tested envelope and provide a useful reference for electric vehicle charging reliability engineering.
I recommend improving input filtering and common-mode design, enhancing zero-crossing detection and phase tracking, separating transient and steady-state protection thresholds, strengthening pilot-signal robustness, adding harmonic-loss and thermal monitoring, and integrating diagnostics with waveform snapshots. I also recommend a validation plan that includes stress escalation, recovery testing, thermal soak, combined stress, and field correlation. The overall grid adaptability score and margin metrics I defined can be used to compare designs and track improvement over time. For electric vehicle charging, the ultimate goal is not merely to survive a disturbance but to deliver safe, predictable, and recoverable charging service. The test methods and optimization directions presented here support that goal and can be adapted to other AC charging pile designs and deployment environments.