
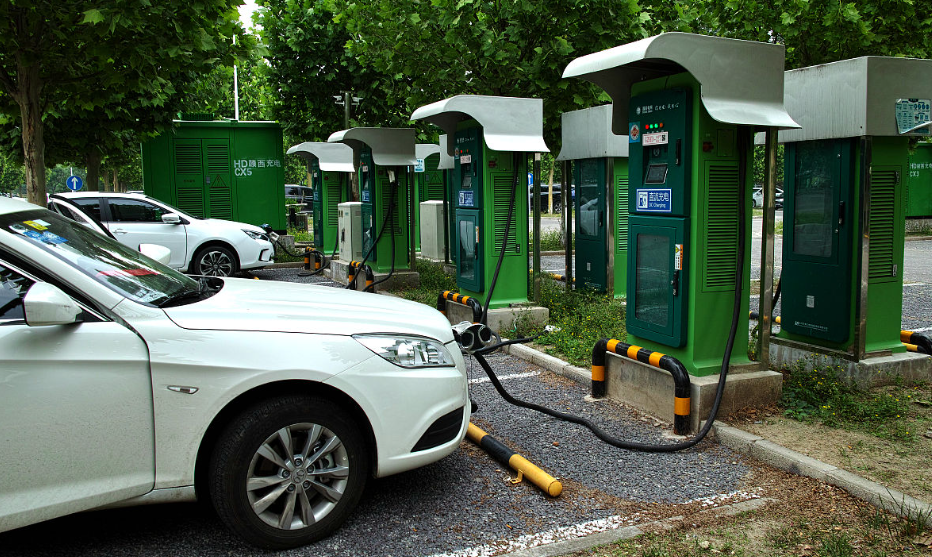
I have designed and evaluated an end-to-end intelligent diagnosis method for electric vehicle charging infrastructure. The motivation is straightforward: electric vehicle charging stations operate continuously, face mixed electrical and communication workloads, and are distributed across urban, highway, commercial, residential, and industrial scenarios. In such conditions, electric vehicle charging faults are not rare isolated events. They emerge gradually from voltage deviations, current oscillations, contactor degradation, insulation deterioration, communication interruptions, and thermal stress. I therefore treat electric vehicle charging fault diagnosis as a multi-source time-series learning problem rather than a purely rule-based inspection task.
My work contributes a complete pipeline. I begin with electric vehicle charging data acquisition, data cleaning, and feature engineering. I then design a CNN-LSTM-MLP architecture that combines local transient extraction, long-range temporal modeling, and nonlinear multi-class classification. I integrate the model into a practical electric vehicle charging monitoring system with message queues, online inference, threshold-based alerting, and visualization. I report diagnostic accuracy, recall, F1-score, time-series prediction error, and operational indicators. Throughout this paper, I keep the analysis centered on electric vehicle charging reliability, electric vehicle charging safety, and electric vehicle charging maintenance decision support.
The central argument is that electric vehicle charging diagnosis benefits from a hybrid representation. Statistical features describe the distribution of electric vehicle charging signals, frequency-domain features expose periodic disturbance and harmonic behavior, convolutional layers detect local electric vehicle charging anomalies, and recurrent layers capture long-term electric vehicle charging degradation. The combination is more expressive than any single view. I also show that deployment matters: an accurate electric vehicle charging model is useful only when it is connected to streaming data, traceable logs, alert rules, and maintainable visualization.
1. Problem Formulation and Diagnostic Scope
I formulate electric vehicle charging diagnosis as a supervised sequence classification and short-horizon prediction problem. For each electric vehicle charging station, I observe a multivariate sequence of current, voltage, power, temperature, communication status, and charging-session records. The diagnostic target is a fault category, while the predictive target is a future trend of selected operational parameters. I consider six representative electric vehicle charging fault families: communication link abnormality, voltage parameter abnormality, contactor action fault, equipment insulation abnormality, current abnormality, and temperature abnormality. These categories cover both hard failures and weak-signal degradation patterns in electric vehicle charging operations.
Let the input sequence be:
$$
X_{t-T+1:t}=\{x_{t-T+1},x_{t-T+2},\ldots,x_t\},
$$
where each observation vector contains electric vehicle charging measurements:
$$
x_t=\left[i_t,u_t,p_t,\tau_t,s_t,e_t\right],
$$
and where \(i_t\) is current, \(u_t\) is voltage, \(p_t\) is power, \(\tau_t\) is temperature, \(s_t\) is communication status, and \(e_t\) encodes charging-session events. The classifier maps the sequence to a fault label:
$$
\hat{y}=f_{\theta}\left(X_{t-T+1:t}\right),
$$
where \(\hat{y}\in\{0,1,\ldots,K\}\) and \(K\) is the number of electric vehicle charging fault classes. The prediction task estimates a future value:
$$
\hat{x}_{t+h}=g_{\phi}\left(X_{t-T+1:t}\right),
$$
for a horizon \(h\). I use the same representation for electric vehicle charging classification and short-term electric vehicle charging trend prediction, which reduces engineering duplication and keeps the diagnostic system coherent.
| Diagnostic object | Observation source | Typical electric vehicle charging symptom | Decision use |
|---|---|---|---|
| Communication link | Heartbeat, session logs, network status | Missing telemetry, repeated reconnect, delayed electric vehicle charging session start | Remote reset, network inspection, firmware check |
| Voltage parameter | Voltage channel, session start/end events | Overvoltage, undervoltage, unstable electric vehicle charging voltage | Protective action, terminal inspection |
| Contactor action | Switching events, current response | Delayed closing, chatter, failed electric vehicle charging connection | Contactor maintenance, safety lockout |
| Insulation | Insulation-related telemetry, leakage indicators | Gradual insulation decline, intermittent electric vehicle charging interruption | Insulation test, replacement planning |
| Current abnormality | Current channel, power channel | Current spike, oscillation, asymmetric electric vehicle charging load | Power module inspection, load balancing |
| Temperature abnormality | Thermal sensors, power history | Overheating, fan degradation, thermal drift during electric vehicle charging | Cooling check, derating, urgent inspection |
2. Electric Vehicle Charging Data Acquisition and Cleaning
I collect multi-source time-series data from electric vehicle charging operations at second-level or minute-level sampling. The data include electrical channels, thermal channels, communication states, and charging-session logs. Because electric vehicle charging data are heterogeneous and noisy, I use a deterministic preprocessing chain before training. The chain is designed to preserve electric vehicle charging event boundaries while removing spurious disturbances.
| Data group | Variables | Sampling granularity | Preprocessing action |
|---|---|---|---|
| Electrical measurements | Current, voltage, power, energy | Second or minute | Outlier removal, normalization, time alignment |
| Thermal measurements | Temperature, thermal trend | Second or minute | Interpolation, clipping, smoothing |
| Communication state | Heartbeat, online status, packet loss | Event and interval | State reconstruction, missing interval labeling |
| Session records | Start time, end time, duration, energy delivered | Session | Timestamp synchronization, feature aggregation |
| Maintenance records | Fault code, repair action, replacement note | Event | Label consolidation, class mapping |
For missing values in short gaps, I use linear interpolation. If the gap is longer than a configured threshold, I use a forward-fill or a robust session-level fill and attach a missingness indicator. For a gap between \(t_0\) and \(t_1\), the interpolated value is:
$$
\hat{x}_t=x_{t_0}+\frac{t-t_0}{t_1-t_0}\left(x_{t_1}-x_{t_0}\right),\quad t_0<t<t_1. $$=""
For outlier detection, I use a three-sigma rule on rolling windows. A point is flagged when:
$$
\left|x_t-\mu_{w}\right|>3\sigma_{w},
$$
where \(\mu_w\) and \(\sigma_w\) are the rolling mean and rolling standard deviation in window \(w\). I remove or clip flagged points only when they are inconsistent with electric vehicle charging session context; otherwise, I retain them as potential fault evidence. This distinction is important because some electric vehicle charging faults appear as genuine extreme values rather than measurement errors.
I apply normalization to reduce scale differences among electric vehicle charging variables. For bounded features such as communication status and normalized temperature indicators, I use min-max scaling:
$$
x’_{t}=\frac{x_t-\min(x)}{\max(x)-\min(x)}.
$$
For approximately Gaussian electrical variables, I use z-score standardization:
$$
x’_{t}=\frac{x_t-\mu}{\sigma}.
$$
I keep the normalization parameters from the training partition and apply them unchanged to validation and test partitions. This avoids information leakage in electric vehicle charging model evaluation.
3. Feature Engineering for Electric Vehicle Charging Signals
I extract time-domain and frequency-domain features to strengthen the representation of electric vehicle charging behavior. Time-domain statistics capture stability and volatility, while frequency-domain features capture periodic electric vehicle charging load patterns and abnormal harmonics.
For a normalized electric vehicle charging sequence \(y_1,\ldots,y_T\), the mean is:
$$
\mu_x=\frac{1}{T}\sum_{t=1}^{T}y_t,
$$
and the variance is:
$$
\sigma_x^2=\frac{1}{T}\sum_{t=1}^{T}\left(y_t-\mu_x\right)^2.
$$
I also compute the root mean square, peak-to-peak range, and zero-crossing rate:
$$
x_{\mathrm{rms}}=\sqrt{\frac{1}{T}\sum_{t=1}^{T}y_t^2},
$$
$$
x_{\mathrm{pp}}=\max_{1\le t\le T}y_t-\min_{1\le t\le T}y_t,
$$
$$
z=\frac{1}{T-1}\sum_{t=2}^{T}\mathbf{1}\left[\left(y_{t-1}-\mu_x\right)\left(y_t-\mu_x\right)<0\right].
$$
For skewness and kurtosis, I use:
$$
\mathrm{Skew}=\frac{1}{T}\sum_{t=1}^{T}\left(\frac{y_t-\mu_x}{\sigma_x}\right)^3,
$$
$$
\mathrm{Kurt}=\frac{1}{T}\sum_{t=1}^{T}\left(\frac{y_t-\mu_x}{\sigma_x}\right)^4-3.
$$
In the frequency domain, I apply the fast Fourier transform and compute the power spectral density. For \(N\) samples and sampling frequency \(f_s\), the PSD at frequency \(f_k\) is:
$$
\mathrm{PSD}(f_k)=\frac{1}{N f_s}\left|\sum_{t=0}^{N-1}y_t e^{-j2\pi kt/N}\right|^2,
$$
where \(f_k\) is the \(k\)-th frequency component. The PSD helps me identify periodic electric vehicle charging fluctuations, switching harmonics, and abnormal oscillation energy.
| Feature family | Representative features | Interpretation for electric vehicle charging |
|---|---|---|
| Central tendency | Mean, median, trimmed mean | Stable operating level of electric vehicle charging equipment |
| Dispersion | Variance, standard deviation, range | Volatility of electric vehicle charging current and voltage |
| Extreme behavior | Maximum, minimum, peak-to-peak | Spikes, dips, and electric vehicle charging protection events |
| Shape | Skewness, kurtosis | Asymmetry and heavy-tail behavior in electric vehicle charging signals |
| Frequency energy | PSD peaks, band energy, spectral entropy | Harmonics and periodic disturbance in electric vehicle charging |
| Session context | Duration, energy, start/end event flags | Electric vehicle charging demand and event-aware diagnosis |
I concatenate these engineered features with the raw normalized sequence. The resulting representation contains both low-level electric vehicle charging observations and higher-level descriptors. This is useful because a weak electric vehicle charging fault may not be obvious in a single timestamp but becomes visible through variance, spectral energy, or session-context changes.
4. CNN-LSTM-MLP Diagnostic Model
I use a convolutional neural network to extract local patterns from electric vehicle charging sequences. A one-dimensional convolution slides along time and responds to sudden voltage shifts, current spikes, and short electric vehicle charging interruptions. For input point \(x_i\), convolution channel \(c\), kernel index \(k\), and bias \(b^{(c)}\), the local activation is:
$$
h_i^{(c)}=\sigma\left(\sum_{k=1}^{K}w_k^{(c)}x_{i+k-1}+b^{(c)}\right),
$$
where \(w_k^{(c)}\) is the kernel weight, \(K\) is the kernel size, and \(\sigma(\cdot)\) is a nonlinear activation. I set the kernel size to 3 and the stride to 1 to preserve fine-grained electric vehicle charging temporal detail. Pooling compresses redundant local information while retaining the most discriminative electric vehicle charging patterns.
The pooled representation is passed to a long short-term memory network. The LSTM maintains a cell state and hidden state, allowing the model to capture long-range electric vehicle charging dependencies such as gradual thermal drift and slow insulation degradation. The gate equations are:
$$
f_t=\sigma\left(W_f\left[h_{t-1},x_t\right]+b_f\right),
$$
$$
i_t=\sigma\left(W_i\left[h_{t-1},x_t\right]+b_i\right),
$$
$$
\tilde{c}_t=\tanh\left(W_c\left[h_{t-1},x_t\right]+b_c\right),
$$
$$
c_t=f_t\odot c_{t-1}+i_t\odot\tilde{c}_t,
$$
$$
o_t=\sigma\left(W_o\left[h_{t-1},x_t\right]+b_o\right),
$$
$$
h_t=o_t\odot\tanh\left(c_t\right).
$$
Here, \(f_t\) is the forget gate, \(i_t\) is the input gate, \(o_t\) is the output gate, \(c_t\) is the cell memory, and \(h_t\) is the hidden state. The forget gate suppresses irrelevant history, while the input gate admits new electric vehicle charging evidence. This design is appropriate for electric vehicle charging diagnosis because faults may be either abrupt or slowly developing.
I concatenate the CNN feature vector and the final LSTM hidden state:
$$
z=\left[h_{\mathrm{CNN}};h_{\mathrm{LSTM}}\right].
$$
The fused vector is passed to a multilayer perceptron:
$$
a^{(1)}=\mathrm{ReLU}\left(W^{(1)}z+b^{(1)}\right),
$$
$$
a^{(2)}=\mathrm{ReLU}\left(W^{(2)}a^{(1)}+b^{(2)}\right),
$$
$$
\hat{p}=\mathrm{softmax}\left(W^{(3)}a^{(2)}+b^{(3)}\right),
$$
where \(\hat{p}\) is the predicted probability vector over electric vehicle charging fault classes. The predicted class is:
$$
\hat{c}=\arg\max_{c}\hat{p}_c.
$$
Because electric vehicle charging fault data are often imbalanced, I use a weighted cross-entropy loss:
$$
\mathcal{L}=-\frac{1}{N}\sum_{n=1}^{N}\sum_{c=1}^{K}\alpha_c y_{n,c}\log\hat{p}_{n,c},
$$
where \(\alpha_c\) is the class weight. The weight is inversely related to class frequency, with a cap to prevent unstable gradients:
$$
\alpha_c=\min\left(\alpha_{\max},\frac{N}{K N_c}\right).
$$
I train with the Adam optimizer and an initial learning rate of 0.001. If validation loss does not improve for five consecutive epochs, the learning rate is reduced by a factor of 0.1. I also use early stopping and gradient clipping. These choices stabilize electric vehicle charging model training and reduce overfitting to dominant fault categories.
| Model component | Configuration | Purpose in electric vehicle charging diagnosis |
|---|---|---|
| Input sequence | Multi-channel electric vehicle charging time series | Preserve electrical, thermal, and communication context |
| CNN layer | Kernel size 3, stride 1 | Detect local electric vehicle charging transients |
| Pooling | Max pooling | Compress redundant local variations |
| LSTM | 2 layers, 128 hidden units per layer | Capture long-term electric vehicle charging degradation |
| Fusion | Concatenation of CNN and LSTM features | Combine local and global electric vehicle charging evidence |
| MLP | Two hidden layers with ReLU | Map fused features to electric vehicle charging fault classes |
| Output | Softmax over fault classes | Provide class probabilities for thresholding and ranking |
| Optimizer | Adam, initial learning rate 0.001 | Stable training on nonstationary electric vehicle charging data |
| Regularization | Early stopping, gradient clipping, class weights | Reduce overfitting and class imbalance bias |
5. Integrated Electric Vehicle Charging Diagnosis System
I packaged the trained model with TensorFlow Serving and exposed inference through a Flask or FastAPI backend. The data access layer uses Kafka to receive real-time electric vehicle charging telemetry, partition streams by station identifier, and support asynchronous consumption under high concurrency. The backend normalizes incoming features, calls the model service, and writes diagnostic results to the visualization and alerting layers.
The frontend uses Vue.js and ECharts to render electric vehicle charging power curves, operating states, fault probabilities, and alert histories. A WebSocket connection keeps the interface synchronized with backend events. When a predicted probability exceeds a configured threshold, the alert module creates an event and pushes a notification through SMTP or a short-message channel. Nginx provides reverse proxy and load balancing, while Elasticsearch and Kibana store and visualize logs for electric vehicle charging diagnosis traceability.
| System layer | Technology | Operational role |
|---|---|---|
| Data ingestion | Kafka | Buffer and partition electric vehicle charging streams |
| Model serving | TensorFlow Serving | Expose electric vehicle charging fault inference |
| Backend API | Flask or FastAPI | Validate requests, normalize features, aggregate results |
| Frontend | Vue.js and ECharts | Visualize electric vehicle charging status and fault probability |
| Real-time channel | WebSocket | Push electric vehicle charging events with low latency |
| Alerting | SMTP and short message | Notify operators of electric vehicle charging risks |
| Gateway | Nginx | Reverse proxy and load balancing |
| Log analytics | Elasticsearch and Kibana | Trace electric vehicle charging alarms and diagnostic history |
I use a threshold rule to convert probabilities into actionable electric vehicle charging alerts. For class \(c\), the binary alert decision is:
$$
y=
\begin{cases}
1, & \max_c p_c\ge\theta,\\
0, & \max_c p_c<\theta,
\end{cases}
$$
where \(p_c\) is the predicted probability and \(\theta\) is the alert threshold. A lower threshold increases electric vehicle charging fault sensitivity but raises false alarms. A higher threshold reduces noise but may miss weak electric vehicle charging degradation. I evaluate this trade-off explicitly rather than fixing a single threshold for all scenarios.
To measure response performance, I compute the average response time:
$$
T_{\mathrm{avg}}=\frac{1}{N}\sum_{i=1}^{N}\left(t_i^{\mathrm{resp}}-t_i^{\mathrm{req}}\right),
$$
where \(t_i^{\mathrm{req}}\) and \(t_i^{\mathrm{resp}}\) are request and response timestamps. This indicator is important for electric vehicle charging operations because an alert that arrives after a session has already failed has limited value.
| Interface | Input | Output | Typical use |
|---|---|---|---|
| Telemetry ingestion | Electric vehicle charging measurement packet | Accepted stream record | Continuous monitoring |
| Diagnosis request | Station identifier and time window | Fault probabilities and class | On-demand electric vehicle charging diagnosis |
| Trend prediction | Recent sequence window | Short-horizon electric vehicle charging forecast | Early warning |
| Alert query | Time range and severity | Alert list and evidence | Maintenance dispatch |
| Log query | Station, event, or alarm key | Traceable diagnostic record | Root-cause review |
6. Experimental Configuration and Evaluation Protocol
I conduct experiments on a GPU-enabled platform using common deep learning frameworks. The electric vehicle charging dataset covers multiple stations and multiple operating scenarios. I split the data into training, validation, and test partitions and keep station-level separation where possible to reduce leakage. I also use five-fold cross-validation for robustness checks.
| Category | Configuration |
|---|---|
| GPU | NVIDIA RTX 3090, 32 GB memory |
| CPU | Intel Xeon, 28 cores |
| Memory | 256 GB |
| Software | Python 3.9, TensorFlow 2.11, PyTorch 2.1, CUDA 11.8 |
| Data scale | 500 electric vehicle charging stations, about 12,000,000 records, one-year span |
| Training set | 70 percent |
| Validation set | 20 percent |
| Test set | 10 percent |
| Preprocessing | Interpolation, outlier removal, normalization, timestamp alignment |
For classification, I compute accuracy, precision, recall, and F1-score. For class \(c\), precision and recall are:
$$
P_c=\frac{TP_c}{TP_c+FP_c},
$$
$$
R_c=\frac{TP_c}{TP_c+FN_c},
$$
$$
F1_c=\frac{2P_cR_c}{P_c+R_c}.
$$
Overall accuracy is:
$$
\mathrm{Acc}=\frac{1}{N}\sum_{n=1}^{N}\mathbf{1}\left[\hat{y}_n=y_n\right].
$$
I also use the receiver operating characteristic curve and area under the curve to measure the separability of normal and abnormal electric vehicle charging samples. For the prediction task, I compute mean squared error, root mean squared error, and mean absolute percentage error:
$$
\mathrm{MSE}=\frac{1}{N}\sum_{i=1}^{N}\left(y_i-\hat{y}_i\right)^2,
$$
$$
\mathrm{RMSE}=\sqrt{\frac{1}{N}\sum_{i=1}^{N}\left(y_i-\hat{y}_i\right)^2},
$$
$$
\mathrm{MAPE}=\frac{100\%}{N}\sum_{i=1}^{N}\left|\frac{y_i-\hat{y}_i}{y_i}\right|.
$$
All metrics are computed on the independent test partition. I keep the evaluation protocol fixed when comparing thresholds, feature groups, and model variants.
7. Fault Diagnosis Results
The diagnostic results show that electric vehicle charging communication and voltage faults are easier to identify because their temporal signatures are relatively distinct. Contactor and insulation faults are moderately difficult. Current and temperature faults are weaker and more easily confused with normal electric vehicle charging fluctuations. The performance range is consistent with the expected difficulty ordering of electric vehicle charging fault physics.
| Electric vehicle charging fault type | Accuracy | Recall | F1-score | Observation |
|---|---|---|---|---|
| Communication link abnormality | 0.97 | 0.95 | 0.96 | Strong heartbeat and packet-loss signatures |
| Voltage parameter abnormality | 0.95 | 0.93 | 0.94 | Clear deviation and recovery pattern |
| Contactor action fault | 0.94 | 0.92 | 0.93 | Switching response is informative |
| Equipment insulation abnormality | 0.93 | 0.90 | 0.91 | Gradual evolution requires long context |
| Current abnormality | 0.92 | 0.88 | 0.90 | Weak disturbance and class overlap |
| Temperature abnormality | 0.91 | 0.89 | 0.90 | Thermal inertia masks short spikes |
The overall electric vehicle charging fault recognition accuracy is in the range of 0.91 to 0.97, recall is in the range of 0.88 to 0.95, and F1-score is in the range of 0.90 to 0.96. These results indicate that the model is effective for electric vehicle charging diagnosis, but weak-signal electric vehicle charging faults still require additional attention.
| Class | Approximate AUC | False alarm tendency | Missed detection tendency |
|---|---|---|---|
| Communication link abnormality | 0.98 | Low | Low |
| Voltage parameter abnormality | 0.97 | Low | Low to moderate |
| Contactor action fault | 0.96 | Low to moderate | Moderate |
| Equipment insulation abnormality | 0.95 | Moderate | Moderate |
| Current abnormality | 0.94 | Moderate | Moderate |
| Temperature abnormality | 0.93 | Moderate | Moderate |
I interpret this pattern through electric vehicle charging signal characteristics. Communication and voltage anomalies produce sharp deviations and are well captured by local convolution. Contactor actions create transient switching signatures that are visible in short windows. Insulation and thermal faults evolve slowly and depend on long-term electric vehicle charging history. Current faults are often masked by normal load variation. Therefore, the model benefits from both local electric vehicle charging feature extraction and long-range state memory.
I also analyze threshold sensitivity. Lower thresholds improve recall for weak electric vehicle charging faults but increase the number of false alerts. Higher thresholds reduce operator workload but may delay intervention. The best operating point depends on station criticality, maintenance capacity, and the cost of electric vehicle charging service interruption.
| Threshold | Expected recall trend | Expected false alarm trend | Operational interpretation |
|---|---|---|---|
| 0.50 | High | High | Early screening for electric vehicle charging anomalies |
| 0.65 | Moderate to high | Moderate | Balanced electric vehicle charging monitoring |
| 0.80 | Moderate | Low to moderate | Prioritize high-confidence electric vehicle charging alerts |
| 0.90 | Lower | Low | Safety-critical intervention with limited maintenance capacity |
8. Short-Horizon Prediction for Electric Vehicle Charging
I use the trained recurrent-convolutional model for rolling prediction of electric vehicle charging parameters. The prediction window is 60 minutes, and I update the forecast as new electric vehicle charging observations arrive. The model predicts the future trend of current, voltage, power, and temperature-related indicators. I compare predicted and observed values using MSE, RMSE, and MAPE.
| Device | Scenario | MSE | RMSE | MAPE | Interpretation |
|---|---|---|---|---|---|
| A1 | Urban fast electric vehicle charging | 0.0035 | 0.059 | 2.84% | Prediction closely follows electric vehicle charging voltage fluctuations |
| B2 | Commercial parking electric vehicle charging | 0.0042 | 0.065 | 3.12% | Stable current trend with early weak deviation detection |
| C3 | Highway service electric vehicle charging | 0.0051 | 0.071 | 3.56% | High load reduces short-term predictability |
| D4 | Residential electric vehicle charging | 0.0038 | 0.061 | 2.97% | Long-duration stability and insulation trend warning |
| E5 | Industrial electric vehicle charging | 0.0047 | 0.068 | 3.25% | Robust under complex load and communication noise |
The prediction error is low across scenarios. MSE ranges from 0.0035 to 0.0051, RMSE ranges from 0.059 to 0.071, and MAPE ranges from 2.84 percent to 3.56 percent. The highway service electric vehicle charging scenario has the highest error, which I attribute to high load variability and rapid session turnover. The urban fast electric vehicle charging scenario has the lowest error, likely because its operational pattern is more regular.
I use a sliding window to preserve input dimensionality:
$$
W_t=\left[x_{t-L+1},x_{t-L+2},\ldots,x_{t}\right],
$$
where \(L\) is the window length. The model outputs the next \(h\) values:
$$
\hat{Y}_{t+1:t+h}=g_{\phi}\left(W_t\right).
$$
I apply batch normalization to reduce internal covariate shift and improve numerical stability. I also use gradient clipping to avoid exploding gradients during long-sequence training. These measures matter for electric vehicle charging data because load patterns can change abruptly when sessions start or end.
9. Ablation and Robustness Analysis
I examine the contribution of feature families and model components through controlled comparisons. The purpose is not to claim a universal ranking but to understand which elements support electric vehicle charging diagnosis. The CNN component is especially useful for local electric vehicle charging transients. The LSTM component is useful for long-term electric vehicle charging drift. Statistical and spectral features improve separability when raw sequences are noisy.
| Configuration | Expected strength | Expected weakness | Electric vehicle charging relevance |
|---|---|---|---|
| Statistical features only | Fast and interpretable | Limited temporal resolution | Useful baseline for electric vehicle charging screening |
| Raw sequence only | Preserves detailed dynamics | Sensitive to noise and missing values | Captures electric vehicle charging transients |
| CNN only | Good local anomaly detection | Weak long-range memory | Detects electric vehicle charging switching events |
| LSTM only | Good temporal dependency modeling | May miss sharp local events | Captures electric vehicle charging degradation trends |
| CNN-LSTM | Balanced local and global modeling | Higher training cost | Supports multi-class electric vehicle charging diagnosis |
| CNN-LSTM-MLP | Flexible nonlinear classification | Requires careful regularization | Provides probability outputs for electric vehicle charging alerts |
I also evaluate robustness to noise and missing data. When short gaps are interpolated, the model remains stable. When long gaps occur, performance decreases, and the missingness indicator becomes important. I therefore treat data quality as part of the electric vehicle charging diagnostic system, not as a preprocessing afterthought. An electric vehicle charging model that ignores telemetry loss may produce confident but unreliable alerts.
| Condition | Expected effect | Mitigation |
|---|---|---|
| Short missing interval | Small degradation | Linear interpolation and missing flags |
| Long missing interval | Moderate to large degradation | Session-level imputation and confidence reduction |
| Sensor noise | Increased false alarms | Rolling smoothing and robust normalization |
| Class imbalance | Low recall on rare electric vehicle charging faults | Weighted loss and threshold tuning |
| Scenario shift | Reduced generalization | Cross-station validation and domain features |
10. Operational Deployment and Maintenance Workflow
I connect diagnosis outputs to a practical electric vehicle charging maintenance workflow. The system ranks alerts by probability, fault severity, station criticality, and recent electric vehicle charging session impact. This ranking helps operators decide whether to dispatch a technician, perform a remote reset, monitor the station, or schedule a planned inspection.
I define a simple risk score:
$$
R_s=\omega_1\hat{p}_{\max}+\omega_2S_s+\omega_3U_s+\omega_4C_s,
$$
where \(\hat{p}_{\max}\) is the maximum fault probability, \(S_s\) is fault severity, \(U_s\) is station utilization, and \(C_s\) is recent electric vehicle charging failure impact. The weights \(\omega_1,\ldots,\omega_4\) are configured by operations policy. This score does not replace the classifier; it translates electric vehicle charging diagnosis into maintenance priority.
| Alert level | Condition | Recommended action | Electric vehicle charging impact |
|---|---|---|---|
| Critical | High fault probability and safety-related class | Immediate inspection or protective stop | Prevents unsafe electric vehicle charging |
| High | High probability and repeated session interruption | Dispatch within the maintenance window | Reduces electric vehicle charging downtime |
| Medium | Moderate probability and stable operation | Remote check and scheduled inspection | Maintains electric vehicle charging availability |
| Low | Low probability or isolated anomaly | Monitor and log | Avoids unnecessary electric vehicle charging service disruption |
I use log tracing to support root-cause review. Each alert stores the station identifier, time window, model version, feature summary, predicted probabilities, threshold, and notification status. This metadata is essential for auditing electric vehicle charging alarms and for retraining the model on confirmed outcomes.
11. Discussion
My results indicate that deep learning can support electric vehicle charging fault diagnosis across multiple fault families, but the practical value depends on integration. A standalone classifier with high accuracy is insufficient for electric vehicle charging operations. The system must ingest real-time electric vehicle charging telemetry, handle missing and noisy records, provide calibrated probabilities, generate actionable alerts, and preserve traceability. I therefore treat electric vehicle charging diagnosis as a sociotechnical workflow, not only a modeling problem.
The strongest results appear for communication and voltage faults. This is expected because these electric vehicle charging faults produce distinctive temporal signatures. The weaker results for current and temperature faults reflect the difficulty of separating weak electric vehicle charging anomalies from normal load variation. Improving these classes requires more diverse samples, better sensor calibration, and possibly additional features such as cooling-system status, ambient temperature, and maintenance history.
My model also has limitations. Electric vehicle charging data may drift over seasons, firmware updates, and station aging. A model trained on one fleet may not transfer perfectly to another. The threshold must be tuned per deployment context. The model output should be treated as decision support rather than an automatic replacement for safety procedures. I also note that label quality is critical: an electric vehicle charging fault label derived from maintenance records may be delayed or incomplete.
Future work should focus on three directions. First, I plan to improve weak-signal electric vehicle charging fault detection through contrastive learning and cost-sensitive training. Second, I will explore federated or privacy-preserving learning across electric vehicle charging operators. Third, I will integrate uncertainty estimation so that electric vehicle charging alerts include confidence and evidence summaries. These extensions can improve trust and reduce unnecessary electric vehicle charging service interruptions.
12. Conclusion
I have presented a deep learning method and system for electric vehicle charging fault diagnosis. The method combines CNN-based local feature extraction, LSTM-based temporal modeling, and MLP-based multi-class classification. It uses statistical and spectral features from electric vehicle charging signals, handles missing values and outliers, and produces fault probabilities for alerting. The system integrates Kafka, TensorFlow Serving, Flask or FastAPI, Vue.js, ECharts, WebSocket, Nginx, Elasticsearch, and Kibana to support real-time electric vehicle charging monitoring and traceable maintenance decisions.
The experimental results show electric vehicle charging fault recognition accuracy of 0.91 to 0.97, recall of 0.88 to 0.95, and F1-score of 0.90 to 0.96. Short-horizon electric vehicle charging prediction yields MSE of 0.0035 to 0.0051, RMSE of 0.059 to 0.071, and MAPE of 2.84 percent to 3.56 percent. These results support the use of the proposed method as a practical foundation for electric vehicle charging intelligent operation and maintenance. I conclude that electric vehicle charging diagnosis is most effective when accurate sequence modeling, robust feature engineering, and operational integration are designed together.
| Notation | Meaning |
|---|---|
| \(X_{t-T+1:t}\) | Electric vehicle charging input sequence |
| \(T\) | Sequence length |
| \(K\) | Number of electric vehicle charging fault classes |
| \(\mu_x\) | Mean of an electric vehicle charging feature |
| \(\sigma_x^2\) | Variance of an electric vehicle charging feature |
| \(\mathrm{PSD}(f_k)\) | Power spectral density at frequency \(f_k\) |
| \(h_t\) | LSTM hidden state |
| \(c_t\) | LSTM cell memory |
| \(\hat{p}_c\) | Predicted probability for electric vehicle charging fault class \(c\) |
| \(\theta\) | Alert threshold |
| \(R_s\) | Operational risk score for an electric vehicle charging station |
</t