
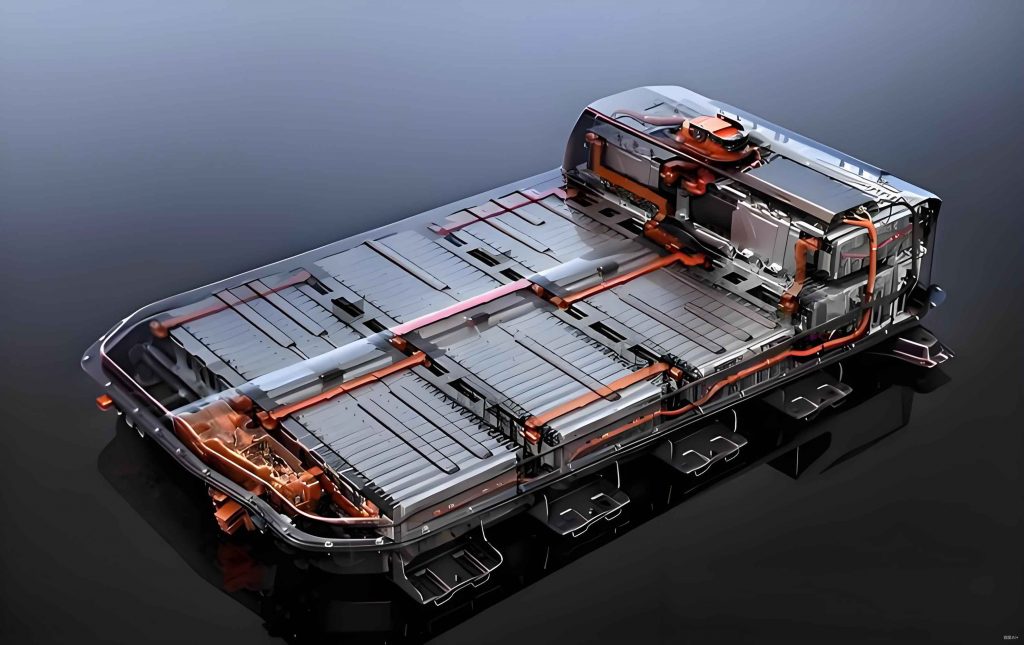
The rapid development of the new energy vehicle industry has brought significant attention to the performance and safety of power batteries, which serve as the core power source. As the number of charge-discharge cycles increases, lithium-ion batteries exhibit an irreversible degradation in electrochemical performance. This degradation not only reduces user experience but also poses potential safety risks. The State of Health (SOH) of power batteries is a critical parameter indicating the degree of performance degradation, directly affecting the driving range and safety of electric vehicles. Therefore, accurate prediction of power battery SOH is essential for improving the driving experience and safety of electric vehicles.
Current methods for predicting power battery SOH can be broadly categorized into three types: model-based methods, data-driven methods, and hybrid methods. Model-based approaches, such as those using Kalman filters or equivalent circuit models, rely on accurate electrochemical models. However, these methods are highly dependent on model precision and can be affected by aging, operating conditions, and environmental factors, leading to insufficient prediction accuracy. Data-driven methods, leveraging advancements in big data and artificial intelligence, monitor key parameters like voltage, current, and temperature to build nonlinear mapping models between input features and SOH. Techniques like Long Short-Term Memory (LSTM) networks and Convolutional Neural Networks (CNNs) have shown promise in SOH prediction. Nevertheless, these methods often struggle with small-sample learning, poor generalization, and lack of physical interpretability. Hybrid methods combine multiple data-driven approaches to enhance prediction performance. For instance, integrating LSTM and Gated Recurrent Unit (GRU) networks can leverage their respective strengths in handling high-dimensional data and large datasets. However, Backpropagation (BP) neural networks, while simple and computationally efficient, are sensitive to initial parameters and prone to local optima, limiting their feature extraction capabilities.
To address these limitations, this study proposes a hybrid method based on Wavelet Packet Decomposition (WPD), Genetic Algorithm (GA), and BP neural network (WPD-GA-BP) for predicting the SOH of China EV battery systems. The method involves three main steps: First, feature parameters are extracted using Incremental Capacity Analysis (ICA), and key features correlated with SOH are selected via Pearson correlation coefficient. Second, to enrich the feature set, WPD is applied to reconstruct the label values at multiple scales. Finally, GA optimizes the initial weights and thresholds of the BP neural network, enabling global optimization and avoiding local optima. This approach enhances the accuracy and stability of SOH prediction for EV power batteries.
The data used in this study are sourced from a vehicle monitoring platform of an automotive company, collecting key operational parameters such as data acquisition time, mileage, State of Charge (SOC), total voltage, total current, single-cell voltage, single-cell temperature, and charging status. The data preprocessing involves handling missing values by filling them with adjacent rows, detecting outliers using the boxplot method, and removing abnormal samples to ensure data quality. Charging segments with a duration greater than 10 minutes are selected for analysis. The SOH is defined based on capacity fade, calculated using the ampere-hour integral method. The formula for SOH is given by:
$$SOH = \frac{C_P}{C_R} \times 100\%$$
where \(C_P\) is the current maximum available capacity and \(C_R\) is the rated capacity. The capacity \(C_P\) is computed as:
$$C_P = \frac{\int I \, dt}{\Delta SOC}$$
where \(I\) is the current and \(\Delta SOC\) is the change in State of Charge during the charging segment. To improve accuracy, the SOH is corrected using a method based on real vehicle charging data, selecting the maximum capacity within specific voltage intervals.
Feature extraction is performed using ICA, which analyzes the incremental capacity curve derived from the charging data. The IC curve is obtained by calculating the derivative of capacity with respect to voltage:
$$\frac{dQ}{dV} = \frac{\Delta Q}{\Delta V}$$
where \(\Delta Q\) is the capacity increment and \(\Delta V\) is the voltage change. To reduce noise, Savitzky-Golay (S-G) filtering is applied with a window size of 43 and a polynomial order of 2. Key features such as peak and valley values of the IC curve are extracted. The Pearson correlation coefficient is used to evaluate the relationship between these features and SOH:
$$r = \frac{\sum (x_i – \bar{x})(y_i – \bar{y})}{\sqrt{\sum (x_i – \bar{x})^2 \sum (y_i – \bar{y})^2}}$$
where \(x_i\) and \(y_i\) are the feature values and SOH, respectively, and \(\bar{x}\) and \(\bar{y}\) are their means. Features with a correlation coefficient greater than 0.7 are selected as model inputs.
To augment the feature set, WPD is employed to decompose the SOH signal into multiple frequency components. The decomposition is carried out using a three-level WPD, resulting in eight sub-sequences that capture different frequency characteristics. The transformation is defined as:
$$d_{i,j,2m} = \sum_k h(k-2i) d_{i-1,j,m}(k)$$
$$d_{i,j,2m+1} = \sum_k g(k-2i) d_{i-1,j,m}(k)$$
where \(d_{i,j,2m}\) and \(d_{i,j,2m+1}\) are the wavelet packet coefficients, and \(h\) and \(g\) are the low-pass and high-pass filters, respectively.
The WPD-GA-BP model integrates the extracted features and decomposed sub-sequences. The BP neural network consists of an input layer, two hidden layers with seven nodes each, and an output layer. The ReLU activation function is used in the hidden layers, and the mean squared error (MSE) is adopted as the loss function. The GA optimizes the initial weights and thresholds of the BP network by encoding them as chromosomes. The fitness function is defined as the root mean square error (RMSE) between predicted and actual SOH values. The GA parameters include a population size of 100, crossover probability of 0.7, and mutation probability of 0.04. The optimization process involves selection, crossover, and mutation operations to evolve the population toward better solutions.
The performance of the WPD-GA-BP model is evaluated using metrics such as coefficient of determination (R²), mean absolute error (MAE), and root mean square error (RMSE):
$$R^2 = 1 – \frac{\sum (y_i – \hat{y}_i)^2}{\sum (y_i – \bar{y})^2}$$
$$MAE = \frac{1}{n} \sum |y_i – \hat{y}_i|$$
$$RMSE = \sqrt{\frac{1}{n} \sum (y_i – \hat{y}_i)^2}$$
where \(y_i\) is the actual value, \(\hat{y}_i\) is the predicted value, and \(\bar{y}\) is the mean of actual values.
The dataset is split into training and testing sets with an 80:20 ratio. The model is trained on data from three vehicles and tested on additional vehicles to validate its generalization capability. The results demonstrate that the WPD-GA-BP model outperforms baseline models such as WPD-BP, BP, Support Vector Regression (SVR), and LSTM in terms of prediction accuracy and stability.
| Vehicle ID | Model | R² | MAE | RMSE |
|---|---|---|---|---|
| 4 | WPD-GA-BP | 0.987 | 0.001 | 0.002 |
| WPD-BP | 0.927 | 0.003 | 0.006 | |
| BP | 0.741 | 0.007 | 0.011 | |
| SVR | 0.386 | 0.015 | 0.019 | |
| LSTM | 0.122 | 0.017 | 0.021 | |
| 5 | WPD-GA-BP | 0.981 | 0.002 | 0.004 |
| WPD-BP | 0.945 | 0.006 | 0.007 | |
| BP | 0.868 | 0.008 | 0.010 | |
| SVR | 0.735 | 0.011 | 0.013 | |
| LSTM | -1.383 | 0.041 | 0.049 | |
| 6 | WPD-GA-BP | 0.979 | 0.001 | 0.004 |
| WPD-BP | 0.927 | 0.003 | 0.008 | |
| BP | 0.599 | 0.011 | 0.016 | |
| SVR | 0.562 | 0.015 | 0.018 | |
| LSTM | -2.847 | 0.025 | 0.028 |
The table above summarizes the prediction performance of different models on test vehicles. The WPD-GA-BP model achieves the highest R² values and the lowest MAE and RMSE across all vehicles, indicating superior accuracy and robustness. For instance, in Vehicle 4, the WPD-GA-BP model attains an R² of 0.987, while the LSTM model only reaches 0.122. The maximum prediction error of the WPD-GA-BP model is less than 1.5%, demonstrating its effectiveness in capturing the nonlinear degradation trends of China EV battery systems.
The integration of WPD for feature expansion and GA for optimization significantly enhances the BP neural network’s capability to handle complex, non-stationary signals from EV power batteries. The multi-scale decomposition provided by WPD allows the model to capture both high-frequency fluctuations and low-frequency degradation patterns, while GA ensures global optimization of network parameters, avoiding local minima. This combination addresses the limitations of traditional BP networks, such as sensitivity to initial conditions and limited feature extraction.
In conclusion, the proposed WPD-GA-BP method offers a reliable solution for predicting the SOH of electric vehicle power batteries. By leveraging ICA for feature extraction, WPD for data augmentation, and GA for network optimization, the model achieves high prediction accuracy and stability. Future work will focus on incorporating additional parameters, such as internal resistance and capacity, to further improve the model’s precision and applicability in real-world scenarios. The advancements in SOH prediction for China EV battery systems contribute to the overall safety and efficiency of electric vehicles, supporting the sustainable development of the new energy automotive industry.