
In recent years, the transition to electric vehicles (EVs) has gained significant momentum as part of global efforts to reduce carbon emissions in the transportation sector. Electric buses, in particular, offer a promising solution for urban public transit systems due to their zero tailpipe emissions and potential for lower operational costs. However, the widespread adoption of electric buses faces several challenges, including high initial investment costs, limited driving range, and inefficiencies in charging infrastructure. One critical issue is the optimization of scheduling and charging strategies for multiple bus lines, especially when EV charging station availability is constrained. This paper addresses the multi-line coordination and scheduling problem for pure electric buses, considering factors such as non-uniform departure timetables, nonlinear charging curves, time-of-use electricity pricing, and limited charging facilities. By developing a bi-objective optimization model, we aim to maximize passenger transfer coordination while minimizing total operational costs, including fleet and charging expenses. The model is solved using a differential evolution algorithm combined with a lexicographic method, ensuring efficient convergence within reasonable computation time.
The core of this research lies in integrating real-world operational constraints into the scheduling framework. Unlike traditional diesel buses, electric buses require careful planning of charging activities to avoid disruptions in service. The limited number of EV charging station slots adds complexity, as buses must compete for charging resources during peak hours. Moreover, passenger experience is heavily influenced by transfer efficiency between different bus lines. Inefficient transfers, characterized by long waiting times, can deter riders from using public transit. Thus, our approach focuses on synchronizing bus arrivals at transfer points to reduce wait times, while simultaneously optimizing vehicle usage and charging schedules to cut costs. This dual-objective model not only enhances service quality but also supports the economic viability of electric bus fleets.
To illustrate the problem, consider a network of bus lines where each line has its own timetable and route. Buses need to recharge at designated EV charging station facilities, which have a finite number of charging piles. The charging process follows a nonlinear pattern, typical of lithium-ion batteries, where the charging rate decreases as the battery approaches full capacity. Additionally, electricity costs vary throughout the day, making it economical to charge during off-peak hours. Our model incorporates these elements to generate an optimized schedule that balances passenger convenience and operational efficiency. The following sections detail the problem formulation, mathematical model, solution algorithm, and a case study based on real data from Beijing’s bus system.
Problem Description and Mathematical Modeling
The multi-line electric bus scheduling problem involves determining the optimal departure times for buses on multiple routes, ensuring that transfers at common stations are coordinated, and that charging needs are met without exceeding EV charging station capacity. Let I denote the set of bus lines, N the set of stations, K the set of charging stations, and B the set of transfer stations. The planning horizon S is discretized into minutes, and each bus trip is characterized by its departure time, travel time, and energy consumption. The primary decision variables are the departure times for each trip, denoted as \( x_p^i \) for trip p on line i.
The first objective is to maximize the number of coordinated transfers at stations in B. A transfer is considered coordinated if the arrival times of two buses from different lines at a transfer station fall within a predefined time window. Formally, let \( A_p^{i,b} \) be the arrival time of trip p on line i at transfer station b, and \( Y_{pq}^{ijb} \) be a binary variable that equals 1 if the time difference between arrivals of trips p and q from lines i and j at station b is within \( [w_{pq}^{ijb}, W_{pq}^{ijb}] \). The objective function is:
$$ \max Y = \sum_{i \in I} \sum_{j \in I, j \neq i} \sum_{b \in B} \sum_{p=1}^{f_i} \sum_{q=1}^{f_j} Y_{pq}^{ijb} $$
where \( f_i \) and \( f_j \) are the total trips on lines i and j, respectively. The arrival time \( A_p^{i,b} \) is computed as \( A_p^{i,b} = x_p^i + T_p^{i,b} \), where \( T_p^{i,b} \) is the travel time from the origin to station b.
The second objective is to minimize total operational costs, which include fleet costs and charging costs. Fleet costs are proportional to the number of buses required, which is determined by constructing trip chains where consecutive trips are served by the same bus. Let \( Z_{ipjq} \) be a binary variable indicating whether trip p on line i is connected to trip q on line j in a trip chain. The number of buses needed is given by the maximum number of such chains, and the fleet cost is \( C_F = c_F \sum_{i \in I} \sum_{j \in I} F_{ij} \), where \( c_F \) is the daily cost per bus and \( F_{ij} \) is the number of chains between lines i and j.
Charging costs depend on the electricity consumed during charging sessions at the EV charging station. The energy required for each charging event is a function of the battery’s state of charge (SOC) and the charging duration. Using a piecewise linear function \( f(\chi) \) to approximate the nonlinear charging curve, the charging percentage \( w_{pc}^i \) for bus after trip p on line i is:
$$ w_{pc}^i = f(t_{pc}^i + \Delta t) – f(t_{pc}^i) $$
where \( t_{pc}^i \) is the start time of charging and \( \Delta t \) is the charging duration. The charging cost is then \( C_C = \sum_{i \in I} \sum_{s \in S} c_s w_{pc}^i R \), where \( c_s \) is the electricity price at time s, and R is the battery capacity. The overall cost minimization objective is:
$$ \min TC = C_F + C_C $$
Constraints include departure time intervals, transfer time windows, trip connectivity, and charging station capacity. For example, the departure time between consecutive trips on the same line must satisfy minimum and maximum headways:
$$ h_i \leq x_p^i – x_{p-1}^i \leq H_i \quad \forall i \in I, p \in f_i $$
Transfer coordination constraints ensure that \( Y_{pq}^{ijb} = 1 \) only if \( w_{pq}^{ijb} \leq A_p^{i,b} – A_q^{j,b} \leq W_{pq}^{ijb} \). Trip connectivity constraints require that each trip is connected to at most one preceding and one succeeding trip, and that the connection is feasible considering travel and charging times. Charging constraints ensure that the SOC never falls below a minimum level \( S_{\min} \) and that the number of buses charging at any time does not exceed the available EV charging station capacity \( C_s^k \) for station k at time s:
$$ C_s^k – Q_s^k \geq 0 \quad \forall k \in K, s \in S $$
where \( Q_s^k \) is the number of buses requiring charging at time s. The SOC dynamics are modeled as:
$$ S_p^i[D] = S_p^i[x] – \frac{e_p^i(x)}{R} \times 100\% $$
with energy consumption \( e_p^i(x) \) estimated using a regression model based on distance, vehicle weight, travel time, and temperature deviation.
Solution Algorithm: Differential Evolution with Lexicographic Ordering
Given the complexity of the bi-objective mixed-integer linear programming model, we employ a differential evolution (DE) algorithm combined with a lexicographic method to solve it efficiently. DE is a population-based optimization technique well-suited for high-dimensional problems, while lexicographic ordering handles multiple objectives by prioritizing them based on importance. In this case, transfer coordination is prioritized over cost minimization, as improving passenger experience is a key goal.
The algorithm begins by initializing a population of candidate solutions, where each solution represents a set of departure time adjustments for all trips across all lines. The population size is set to 30, and each individual is encoded as a vector of integer values, with each gene corresponding to a departure time adjustment in minutes. For example, a value of -1 indicates advancing the departure by one minute, while +1 denotes a delay. The initial population is generated randomly within the feasible search space defined by the constraints.
During each iteration, the DE algorithm performs mutation, crossover, and selection operations to evolve the population. Mutation creates new candidate solutions by combining existing ones. For a target individual \( x_{i,G} \) at generation G, a mutant vector \( v_{i,G+1} \) is generated as:
$$ v_{i,G+1} = x_{r1,G} + F \cdot (x_{r2,G} – x_{r3,G}) $$
where \( r1, r2, r3 \) are distinct random indices, and F is the mutation factor. Crossover then blends the mutant vector with the target vector to produce a trial vector \( u_{i,G+1} \). Each component of the trial vector is set to the mutant vector’s component with probability CR (crossover rate), or to the target vector’s component otherwise. Selection compares the trial vector to the target vector using the lexicographic method: if the trial vector improves the primary objective (transfer coordination) or matches it while improving the secondary objective (cost), it replaces the target vector in the next generation.
The lexicographic method evaluates solutions by first comparing the number of coordinated transfers. If two solutions have the same number, their total costs are compared. This ensures that solutions with better transfer efficiency are favored, even if they have slightly higher costs. The algorithm terminates after a fixed number of generations (e.g., 100), and the best solution found is output. This approach efficiently explores the solution space, balancing exploration and exploitation to find high-quality schedules.
Case Study: Beijing Bus Lines
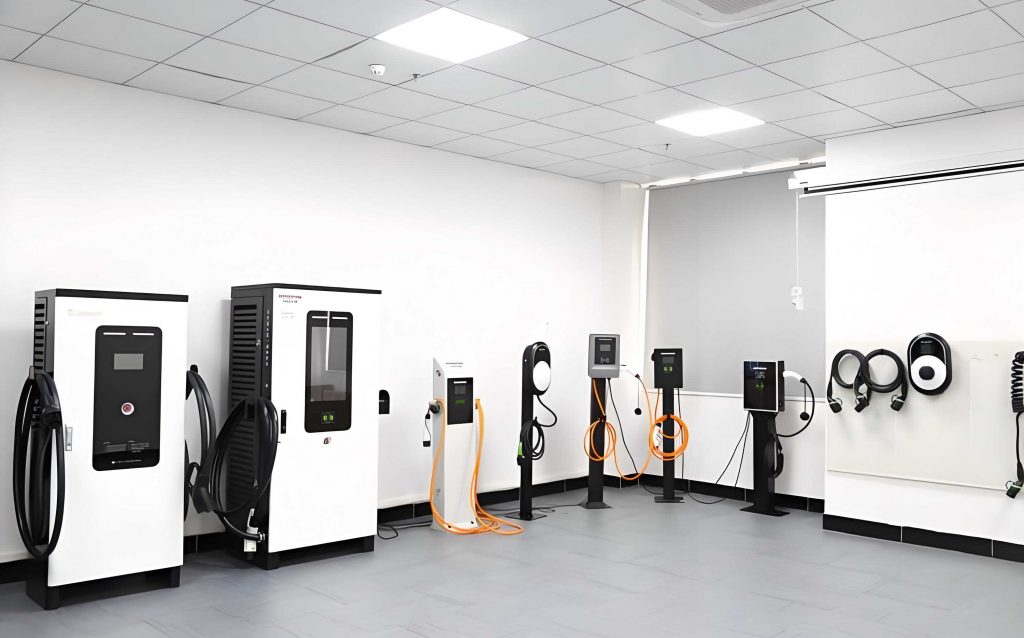
To validate the model and algorithm, we applied them to two electric bus lines in Beijing: Line 425 and Line 653. Line 425 operates between Xiaoying Bus Depot and Nanwu, covering 19 km with 30 stations in the upward direction and 31 in the downward direction. Line 653 runs between Haidian Wuluju and Beiyuan Jiayuan, spanning 28 km with 41 stations in both directions. Both lines use GTQ6131BEVST3 pure electric double-decker buses, with a curb weight of 20,150 kg and a battery capacity of 139 kWh. The SOC is maintained between 30% and 80% for battery health. The EV charging station for Line 653 has 16 fast-charging piles with 90 kW power, while Line 425’s station has 32 piles of the same capacity.
Operational data, including departure intervals, travel times, and passenger counts, were collected from December 20, 2021. The planning horizon spans a full day, divided into off-peak, mid-peak, and peak periods. Time-of-use electricity pricing applies, with rates highest during 10:00-15:00 and 18:00-21:00. The charging curve is approximated using a piecewise linear function with three segments, reflecting the constant-current and constant-voltage phases. Energy consumption is estimated using the regression model:
$$ e_p^i(x) = \beta_0 + \beta_1 \ln(L_p + L_{pc}) + \beta_2 \ln(G_p) + \beta_3 \ln(T_p) + \beta_4 \ln(|\xi_p – \xi^*|) $$
where \( L_p \) is trip distance, \( L_{pc} \) is deadhead distance to the EV charging station, \( G_p \) is vehicle weight, \( T_p \) is travel time, and \( \xi_p \) is ambient temperature.
The initial schedule resulted in 385 coordinated transfers and a total operational cost of 29,820.527 CNY, using 54 buses. After optimization, the coordinated transfers increased to 426 (a 10.65% improvement), and the total cost decreased to 27,760.291 CNY (a 6.91% reduction). The number of buses required dropped to 46, reducing fleet costs, while charging costs increased slightly due to more efficient but costlier charging sessions. The table below summarizes the results:
| Line | Number of Buses | Fleet Cost (CNY) | Charging Cost (CNY) | Total Cost (CNY) |
|---|---|---|---|---|
| 425 | 24 | 7,638.72 | 7,407.262 | 27,760.291 |
| 653 | 22 | 7,002.16 | 5,712.149 |
The optimization also generated detailed charging schedules, allocating charging piles efficiently at each EV charging station. For instance, during peak hours, charging sessions were staggered to avoid congestion, and buses were directed to charge during lower-rate periods when possible. The convergence of the DE algorithm was smooth, reaching near-optimal solutions within 50 iterations, as shown in the objective function plot over generations.
Conclusion and Future Research
This study presents a comprehensive framework for optimizing multi-line electric bus scheduling under limited EV charging station capacity. By integrating transfer coordination with cost minimization, the model addresses key challenges in electric bus operations, such as nonlinear charging behavior and time-varying electricity prices. The differential evolution algorithm with lexicographic ordering proves effective in solving the complex bi-objective problem, delivering significant improvements in both passenger service and economic efficiency.
Future work could explore dynamic scheduling adjustments in real-time, incorporating uncertainty in travel times and passenger demand. Additionally, integrating renewable energy sources into EV charging station operations could further reduce costs and environmental impact. The model can also be extended to include multiple vehicle types and charging technologies, such as wireless charging, to enhance flexibility. Overall, this research provides a practical tool for transit agencies to enhance electric bus network performance, supporting sustainable urban mobility.