
In the rapidly evolving field of electric vehicle (EV) technology, thermal management of battery systems is paramount to ensuring performance, longevity, and safety. As an integral component, the EV battery pack generates significant heat during charge and discharge cycles, necessitating efficient cooling strategies. Among emerging solutions, direct immersion cooling has garnered considerable attention due to its potential to surpass traditional indirect cold plate methods in heat transfer efficiency and temperature uniformity. In my research, I delve into the critical factors affecting the thermal behavior of immersed EV battery packs, aiming to provide a systematic analysis that guides future design and optimization. This study focuses on three pivotal aspects: the type of coolant, the heat generation rate of battery cells, and the influence of flow channel structures. Through detailed numerical simulations, I explore how these elements shape the temperature distribution, maximum temperature, and thermal gradients within an EV battery pack. The findings underscore the superiority of immersion cooling, particularly for high-power applications, and offer practical insights for selecting coolants and designing flow pathways. Throughout this article, I will consistently refer to the EV battery pack as the central subject, emphasizing its role in advancing EV technology.
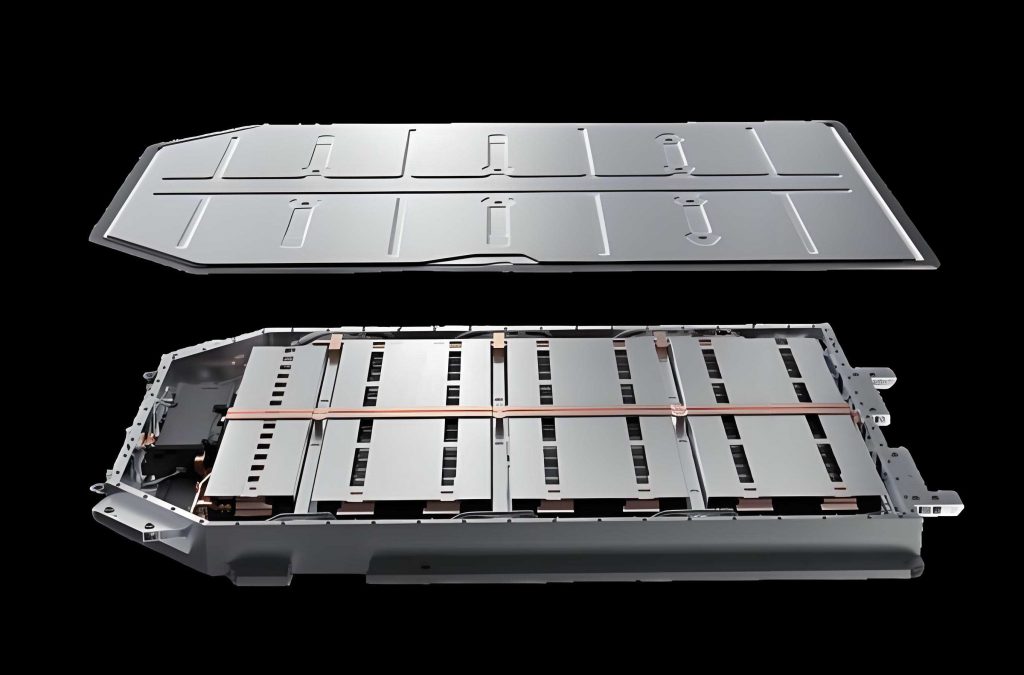
To establish a foundation, I first describe the immersed EV battery pack system used in this investigation. The pack comprises 52 prismatic lithium iron phosphate (LFP) cells, each with a capacity of 280 Ah, arranged in a configuration that allows complete submersion in a dielectric coolant. The coolant circulates through inlet and outlet ports, with a dedicated flow channel structure featuring injection nozzles to enhance distribution. The geometry is defined by key dimensions: the pack height is denoted as H, the nozzle diameter as D, with nozzle length set to 4D, cell gaps at 0.5D, module gaps at 1.4D, and a bottom clearance of 3D. This design ensures efficient fluid interaction with every cell surface, maximizing heat extraction. For visualization, consider the following representation of a typical EV battery pack system:
The thermal management of an EV battery pack relies heavily on the coolant’s properties, as it directly contacts the cells. In this study, I evaluate three common coolant types: fluorinated liquid, silicone oil, and mineral oil. Their thermophysical parameters at 20°C are summarized in Table 1. These properties, including kinematic viscosity, density, thermal conductivity, and specific heat capacity, play a crucial role in determining the cooling efficacy. For instance, kinematic viscosity affects fluid flow and heat transfer coefficients, which can be expressed through the Reynolds number (Re) and Nusselt number (Nu) relationships. In general, the heat transfer rate per unit area for convection is given by Newton’s law of cooling:
$$ q = h \cdot (T_{\text{surface}} – T_{\text{fluid}}) $$
where \( q \) is the heat flux, \( h \) is the convective heat transfer coefficient, and \( T \) denotes temperatures. The coefficient \( h \) depends on fluid properties and flow conditions, often correlated with dimensionless numbers. For forced convection in channels, I utilize the Dittus-Boelter equation for turbulent flow:
$$ Nu = 0.023 \cdot Re^{0.8} \cdot Pr^{0.4} $$
where \( Nu = \frac{h \cdot L}{k} \), \( Re = \frac{\rho \cdot v \cdot L}{\mu} \), and \( Pr = \frac{c_p \cdot \mu}{k} \). Here, \( L \) is a characteristic length, \( v \) is velocity, \( \rho \) is density, \( \mu \) is dynamic viscosity, \( c_p \) is specific heat, and \( k \) is thermal conductivity. The kinematic viscosity \( \nu = \frac{\mu}{\rho} \) is a key parameter, as lower values promote higher Re and better mixing. This directly impacts the EV battery pack’s thermal performance.
| Coolant | Kinematic Viscosity (mm²/s) | Density (kg/m³) | Thermal Conductivity (W/(m·K)) | Specific Heat Capacity (J/(kg·K)) |
|---|---|---|---|---|
| Fluorinated Liquid | 0.32 | 1400 | 0.075 | 1300 |
| Silicone Oil | 10 | 940 | 0.134 | 1800 |
| Mineral Oil | 20 | 805 | 0.136 | 2150 |
Another critical factor is the heat generation rate of the EV battery pack cells, which varies with charge-discharge rates. In my analysis, I consider three typical rates: 0.25 C, 0.5 C, and 1 C, corresponding to low, medium, and high heat outputs. The maximum heat generation values for a single cell under these conditions are listed in Table 2. These values are derived from experimental measurements and are essential for simulating realistic operational scenarios. The heat generation within an EV battery pack can be modeled using the energy balance equation:
$$ \rho c_p \frac{\partial T}{\partial t} = \nabla \cdot (k \nabla T) + \dot{q} $$
where \( \dot{q} \) is the volumetric heat generation rate. For steady-state simulations, as conducted here, the time derivative is zero, simplifying the analysis. The total heat dissipation from the EV battery pack must match the coolant’s heat absorption, which depends on flow rate and temperature rise.
| Rate | Maximum Heat Generation per Cell (W) |
|---|---|
| 0.25 C | 4.1 |
| 0.5 C | 12.1 |
| 1 C | 39.2 |
The flow channel structure within the EV battery pack is a design element that significantly influences coolant distribution. I compare two configurations: one without a dedicated flow channel and another with an integrated channel featuring injection nozzles. The presence of these nozzles alters the flow lines, potentially enhancing uniformity and reducing hot spots. To quantify this, I employ computational fluid dynamics (CFD) simulations, using a steady-state, turbulent flow model with the Realizable k-ε turbulence closure. The solver settings include second-order upwind discretization and the Coupled algorithm for stability. The mesh independence is verified through a grid sensitivity study, as shown in Table 3. Based on this, I select a mesh with approximately 1.72 million elements for all simulations, ensuring accuracy while managing computational cost. The boundary conditions are set with a coolant inlet flow rate of 5 L/min at 20°C and a pressure outlet, mimicking typical operating conditions for an EV battery pack.
| Mesh Scheme | Number of Elements (thousands) | Average Cell Temperature (°C) |
|---|---|---|
| Scheme 1 | 723 | 23.12 |
| Scheme 2 | 1251 | 24.87 |
| Scheme 3 | 1722 | 25.32 |
| Scheme 4 | 2238 | 25.34 |
To assess thermal performance, I define three key metrics: the maximum temperature within the EV battery pack (\( T_{\text{max}} \)), the maximum temperature difference across the pack (\( \Delta T_{\text{max}} \)), and the maximum temperature difference between the top and bottom surfaces of the cells (\( \Delta T_{\text{top-bottom}} \)). These indicators provide insights into overall temperature levels, uniformity, and vertical gradients, which are critical for preventing thermal runaway and ensuring cell longevity. In the following sections, I present and discuss the results for each factor, supported by tables and formulas.
Beginning with coolant type, the simulations reveal distinct thermal behaviors. Using fluorinated liquid, the EV battery pack exhibits excellent temperature control, with \( T_{\text{max}} \) at 25.83°C, \( \Delta T_{\text{max}} \) at 1.69°C, and \( \Delta T_{\text{top-bottom}} \) at 1.06°C. In contrast, silicone oil yields higher values: \( T_{\text{max}} = 31.99°C \), \( \Delta T_{\text{max}} = 9.47°C \), and \( \Delta T_{\text{top-bottom}} = 7.59°C \). Mineral oil performs the worst, with \( T_{\text{max}} = 40.03°C \), \( \Delta T_{\text{max}} = 19.50°C \), and \( \Delta T_{\text{top-bottom}} = 19.86°C \). The relative improvements can be quantified as percentages. For \( T_{\text{max}} \), silicone oil and mineral oil show increases of 23.85% and 54.97%, respectively, compared to fluorinated liquid. For \( \Delta T_{\text{max}} \), the increases are 5.60-fold and 11.54-fold, and for \( \Delta T_{\text{top-bottom}} \), 7.16-fold and 18.74-fold. These disparities stem primarily from kinematic viscosity, as lower viscosity enhances fluid mobility and heat transfer. The thermal conductivity differences are less impactful; for example, fluorinated liquid has a conductivity around 0.075 W/(m·K), while silicone and mineral oils are about 0.134-0.136 W/(m·K), only 1.8 times higher. However, their viscosities are orders of magnitude greater, impeding flow. This relationship can be expressed through the Prandtl number (\( Pr \)), which influences the Nusselt number. For fluorinated liquid, \( Pr \) is relatively low due to low viscosity, leading to higher \( Nu \) and better cooling. Thus, when selecting a coolant for an immersed EV battery pack, kinematic viscosity should be prioritized over thermal conductivity.
To generalize, the heat transfer coefficient \( h \) can be approximated for each coolant using empirical correlations. For forced convection in a packed bed or similar geometry, I adapt the Whitaker correlation for spheres, though adjusted for prismatic cells:
$$ Nu = 2 + 0.4 \cdot Re^{1/2} \cdot Pr^{1/3} $$
Given the fixed flow rate, \( Re \) is proportional to \( \frac{1}{\nu} \). Thus, for fluorinated liquid with \( \nu = 0.32 \, \text{mm}^2/\text{s} \), \( Re \) is high, resulting in a larger \( h \). This directly reduces the thermal resistance between the cell surface and coolant, as per:
$$ R_{\text{conv}} = \frac{1}{h \cdot A} $$
where \( A \) is the surface area. Lower \( R_{\text{conv}} \) facilitates faster heat removal, keeping the EV battery pack temperatures in check. Additionally, the specific heat capacity affects the coolant’s ability to absorb heat, but its impact is secondary to flow dynamics in this context.
Moving to heat generation rates, I compare immersion cooling with traditional cold plate cooling across the three rates. The results are summarized in Table 4. For the EV battery pack under immersion cooling, \( T_{\text{max}} \) values are 22.18°C at 0.25 C, 25.83°C at 0.5 C, and 38.47°C at 1 C. In contrast, cold plate cooling yields 24.78°C, 34.13°C, and 65.73°C, respectively. The reductions due to immersion are 2.60°C, 8.30°C, and 27.26°C, showing that the advantage amplifies with higher heat loads. Similarly, for \( \Delta T_{\text{max}} \), immersion cooling achieves 0.19°C, 0.76°C, and 1.76°C lower than cold plate, and for \( \Delta T_{\text{top-bottom}} \), the reductions are 3.35°C, 11.55°C, and 32.03°C. This demonstrates that immersion cooling is particularly beneficial for high-power EV battery packs, where thermal management is most challenging. The improvement can be attributed to the direct contact between coolant and cells, eliminating the thermal resistance of cold plates. In mathematical terms, the overall thermal resistance for cold plate cooling includes conductive resistances through the plate and interfacial contacts, whereas immersion cooling minimizes these. Assuming one-dimensional heat transfer, the total resistance for cold plate is:
$$ R_{\text{total, cold plate}} = R_{\text{cond, cell}} + R_{\text{contact}} + R_{\text{cond, plate}} + R_{\text{conv, plate}} $$
For immersion, it simplifies to:
$$ R_{\text{total, immersion}} = R_{\text{cond, cell}} + R_{\text{conv, direct}} $$
Since \( R_{\text{conv, direct}} \) is often lower than the sum of other resistances, especially with high-velocity flow, the EV battery pack experiences better cooling. Moreover, the temperature uniformity improves because the coolant envelops each cell, reducing lateral gradients. This is crucial for avoiding localized hot spots that can degrade an EV battery pack over time.
| Metric | 0.25 C (Immersion) | 0.25 C (Cold Plate) | 0.5 C (Immersion) | 0.5 C (Cold Plate) | 1 C (Immersion) | 1 C (Cold Plate) |
|---|---|---|---|---|---|---|
| \( T_{\text{max}} \) (°C) | 22.18 | 24.78 | 25.83 | 34.13 | 38.47 | 65.73 |
| \( \Delta T_{\text{max}} \) (°C) | 0.95 | 1.14 | 1.69 | 2.45 | 3.50 | 5.26 |
| \( \Delta T_{\text{top-bottom}} \) (°C) | 1.05 | 4.40 | 1.06 | 12.61 | 4.31 | 36.34 |
The third factor, flow channel structure, proves to be a significant design element. Without a flow channel, the EV battery pack exhibits localized high-temperature regions, particularly on the top and bottom surfaces, with \( T_{\text{max}} = 29.17°C \), \( \Delta T_{\text{max}} = 4.34°C \), and \( \Delta T_{\text{top-bottom}} = 2.60°C \). With the integrated flow channel, these metrics improve to \( T_{\text{max}} = 25.83°C \), \( \Delta T_{\text{max}} = 1.69°C \), and \( \Delta T_{\text{top-bottom}} = 1.06°C \), representing reductions of 3.34°C, 2.65°C, and 1.54°C, respectively. The flow channel works by redirecting coolant streams through nozzles, creating a more uniform velocity field. This can be analyzed using the continuity and momentum equations. For incompressible flow:
$$ \nabla \cdot \mathbf{v} = 0 $$
$$ \rho (\mathbf{v} \cdot \nabla) \mathbf{v} = -\nabla p + \mu \nabla^2 \mathbf{v} $$
where \( \mathbf{v} \) is the velocity vector and \( p \) is pressure. The nozzles increase local velocities, enhancing mixing and reducing stagnant zones. The resulting flow lines spread evenly across the EV battery pack, ensuring that each cell receives adequate cooling. Without the channel, flow tends to concentrate in central regions, leaving edges undercooled. This disparity leads to higher thermal gradients, which can be quantified using the standard deviation of temperature across the pack:
$$ \sigma_T = \sqrt{\frac{1}{N} \sum_{i=1}^{N} (T_i – \bar{T})^2 } $$
where \( N \) is the number of cell nodes, and \( \bar{T} \) is the average temperature. With the flow channel, \( \sigma_T \) decreases, indicating better uniformity. Additionally, the pressure drop across the EV battery pack may increase slightly due to the nozzles, but this trade-off is acceptable given the thermal benefits. In practice, optimizing the nozzle diameter and arrangement can further enhance performance, but that lies beyond the scope of this study.
To synthesize the findings, I develop a generalized model for predicting the maximum temperature in an immersed EV battery pack. Combining heat generation and cooling effects, the energy balance can be written as:
$$ \dot{Q}_{\text{gen}} = \dot{m} \cdot c_p \cdot (T_{\text{out}} – T_{\text{in}}) $$
where \( \dot{Q}_{\text{gen}} \) is the total heat generation from all cells, \( \dot{m} \) is the coolant mass flow rate, and \( T_{\text{in}} \) and \( T_{\text{out}} \) are inlet and outlet temperatures. For a given coolant and flow rate, \( T_{\text{out}} \) relates to the average pack temperature. Assuming linearity, \( T_{\text{max}} \) can be approximated as:
$$ T_{\text{max}} = T_{\text{in}} + \frac{\dot{Q}_{\text{gen}}}{\dot{m} \cdot c_p} + \Delta T_{\text{gradient}} $$
Here, \( \Delta T_{\text{gradient}} \) accounts for internal thermal resistances and depends on coolant properties and flow distribution. From my data, for fluorinated liquid at 0.5 C, \( \dot{Q}_{\text{gen}} = 52 \times 12.1 \, \text{W} = 629.2 \, \text{W} \), \( \dot{m} = 5 \, \text{L/min} \times 1.4 \, \text{kg/L} / 60 = 0.1167 \, \text{kg/s} \) (using fluorinated liquid density), and \( c_p = 1300 \, \text{J/(kg·K)} \). The temperature rise \( \frac{\dot{Q}_{\text{gen}}}{\dot{m} \cdot c_p} \approx 4.15°C \). With \( T_{\text{in}} = 20°C \), the average outlet temperature would be around 24.15°C, close to the simulated \( T_{\text{max}} \) of 25.83°C, considering gradients. This model helps in sizing cooling systems for various EV battery pack configurations.
Furthermore, I explore the impact of variable coolant properties with temperature. As shown in Table 5, kinematic viscosity decreases with temperature for all coolants, but the relative differences persist. For instance, at 40°C, fluorinated liquid has \( \nu = 0.28 \, \text{mm}^2/\text{s} \), silicone oil 4.65 mm²/s, and mineral oil 9.81 mm²/s. This means that even at elevated temperatures, fluorinated liquid maintains its flow advantage, ensuring consistent cooling for the EV battery pack. Thermal conductivity also changes slightly, but as established, viscosity dominates. Therefore, when operating an EV battery pack under dynamic conditions, selecting a coolant with low viscosity across a wide temperature range is advisable.
| Temperature (°C) | Fluorinated Liquid (mm²/s) | Silicone Oil (mm²/s) | Mineral Oil (mm²/s) |
|---|---|---|---|
| 0 | 0.42 | 24.38 | 50.76 |
| 20 | 0.32 | 9.96 | 19.75 |
| 40 | 0.28 | 4.65 | 9.81 |
In terms of practical implications, my research highlights several guidelines for designing immersed EV battery packs. First, fluorinated liquids are superior for high-performance applications due to their low viscosity and reasonable thermal properties. However, cost and environmental factors may influence final choices. Second, immersion cooling is especially advantageous for EV battery packs subjected to high charge-discharge rates, such as in fast-charging scenarios or high-power electric vehicles. The reduction in top-bottom temperature differences is particularly beneficial for cell longevity, as it minimizes mechanical stresses from thermal expansion. Third, incorporating flow channels with nozzles is a simple yet effective way to boost temperature uniformity, making it a recommended feature in immersed EV battery pack designs.
To extend the analysis, I consider potential limitations and future work. My simulations assume steady-state conditions, but real-world EV battery packs experience transient loads. Dynamic simulations could reveal how quickly the system responds to changes. Additionally, two-phase immersion cooling, where the coolant boils, offers even higher heat transfer coefficients but introduces complexity in pressure control and fluid management. Exploring such advanced techniques could further improve EV battery pack thermal management. Moreover, the interaction between cell aging and cooling efficiency warrants investigation, as degraded cells may generate more heat or have altered thermal properties.
In conclusion, this comprehensive study underscores the importance of key factors in shaping the thermal characteristics of immersed EV battery packs. Through numerical simulations, I demonstrate that coolant type, specifically kinematic viscosity, is a primary driver of performance, with fluorinated liquid yielding the best results. Heat generation rates amplify the benefits of immersion cooling over cold plate methods, particularly at high powers. Flow channel structures enhance temperature uniformity by optimizing coolant distribution. These insights provide a foundation for optimizing immersed EV battery pack designs, contributing to safer, more efficient electric vehicles. As the demand for high-energy-density EV battery packs grows, immersion cooling stands out as a promising solution, and this work offers valuable guidelines for its implementation. Future efforts should focus on experimental validation and cost-benefit analyses to translate these findings into real-world applications.