
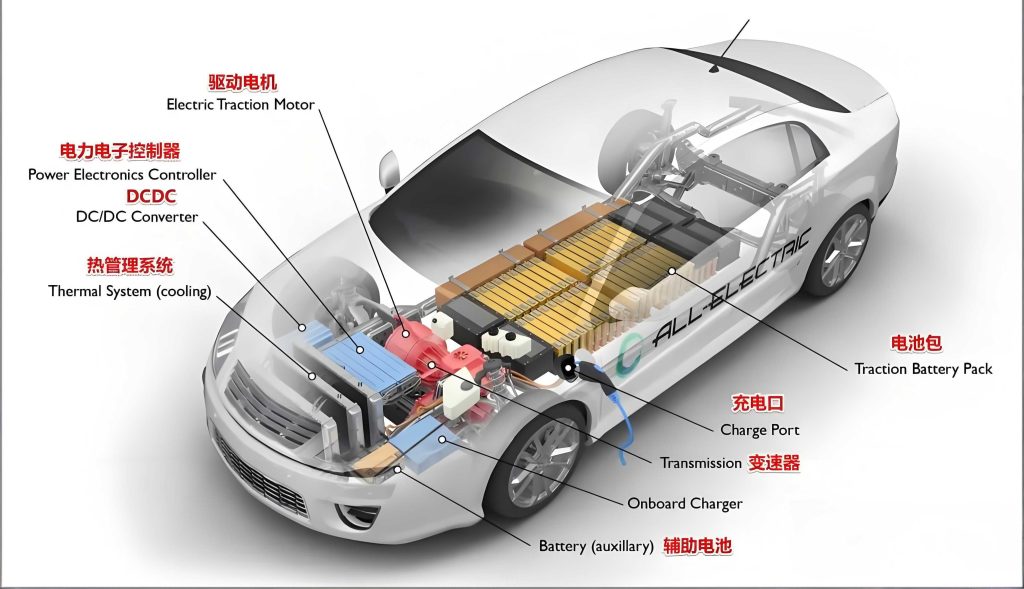
The global shift in energy structure and the deepening of environmental consciousness have propelled the battery electric car into the spotlight. Characterized by zero tailpipe emissions, lower energy consumption, and high efficiency, the battery electric car is rapidly becoming a market favorite. As a critical link in this transportation revolution, the charging infrastructure—specifically, the network of Electric Vehicle Supply Equipment (EVSE) or charging piles—faces unprecedented scrutiny. The importance of aligning market supply with genuine user demand and superior service quality has never been more pronounced. This article aims to conduct a thorough analysis of user requirements for battery electric car charging piles and propose corresponding strategies for service quality enhancement, providing valuable insights for policymakers, industry investors, and researchers.
The proliferation of the battery electric car has catalyzed the rapid development of the charging pile market. However, the construction and management of this essential infrastructure are fraught with challenges. Issues such as uneven geographical distribution of charging stations, slow charging speeds, and inconsistent service quality significantly hamper the user experience and, consequently, the broader adoption of the battery electric car. Therefore, a methodical analysis of user needs and the formulation of targeted service improvement strategies are paramount for the sustainable growth of the electric vehicle industry.
I. Comprehensive User Demand Analysis
Understanding the multifaceted needs of the battery electric car owner is the first step toward building a successful charging ecosystem. These demands can be categorized into four primary dimensions, each with quantifiable and qualitative aspects.
1. Convenience Demand
Convenience is the cornerstone of user satisfaction with charging infrastructure for a battery electric car. Users expect a seamless, hassle-free charging experience that integrates effortlessly into their daily lives and long-distance travels.
- Spatial Ubiquity and Optimal Layout: The demand is for a dense, well-planned network. This includes coverage in urban cores, residential communities, commercial districts, workplaces, and along inter-city highways. The absence of charging points in any of these areas creates “range anxiety” and limits the utility of the battery electric car. A common metric for this is charging station density per square kilometer or per capita within a given region.
- Operational Simplicity and Digital Integration: The charging process must be intuitive. This encompasses easy-to-use physical interfaces, clear status indicators, and seamless digital integration. Mobile applications for locating available piles, initiating sessions, monitoring progress, and automated payment (via QR code, RFID, or direct carrier billing) are now considered standard. Smart features like reservation systems for public fast-chargers are highly valued to guarantee access and minimize waiting time.
We can model the perceived convenience \( C_i \) for a user at location \( i \) as a function of network density and accessibility:
$$C_i = \frac{\sum_{j=1}^{N} w_{ij} \cdot e^{-\beta d_{ij}}}{\sum_{j=1}^{N} e^{-\beta d_{ij}}}$$
Where \( N \) is the total number of charging stations, \( d_{ij} \) is the distance from user \( i \) to station \( j \), \( \beta \) is a distance decay parameter, and \( w_{ij} \) is a weight factor representing the station’s service level (e.g., power output, number of connectors).
| Indicator | Description | Benchmark Target |
|---|---|---|
| Station Density (Urban) | Number of public charging points per 1000 battery electric cars | 10 – 15 |
| Highway Coverage | Maximum distance between fast-charging stations | ≤ 50 km |
| Process Time | Time from arrival to charge initiation | < 2 minutes |
| Digital Payment Success Rate | Percentage of successful digital transactions | > 99.5% |
2. Safety Demand
Safety is a non-negotiable prerequisite for any infrastructure interacting with high-voltage electricity and public users. Owners of a battery electric car must have absolute confidence in the physical, electrical, and data security of the charging process.
- Electrical and Physical Safety: Charging piles must comply with stringent international standards (e.g., IEC 61851, UL 2594). They require robust protection against over-current, over-voltage, short circuits, leakage, and overheating. Physical construction must be vandal-resistant, weatherproof (IP54 minimum for outdoors), and equipped with emergency stop mechanisms. Regular safety inspections and certifications are vital.
- Cybersecurity and Data Privacy: As connected devices, charging piles are potential targets for cyber-attacks. Secure communication protocols (e.g., TLS/SSL), encrypted data transmission, and secure authentication are mandatory to protect user personal data, payment information, and the grid’s integrity from unauthorized access or manipulation.
- Proactive Safety Management: Beyond passive protection, systems should include real-time remote monitoring, fault diagnostics, and predictive maintenance alerts. This ensures potential hazards are identified and rectified before they impact users.
The reliability and safety of a charging pile can be expressed through its failure rate \( \lambda(t) \) and Mean Time Between Failures (MTBF). The probability of a pile operating without a critical safety failure for a time \( t \) is given by the reliability function \( R(t) \):
$$R(t) = e^{-\int_0^t \lambda(\tau) d\tau}$$
For a constant failure rate, this simplifies to \( R(t) = e^{-\lambda t} \). A high MTBF (low \( \lambda \)) is a key safety performance indicator.
3. Compatibility Demand
The diverse landscape of battery electric car models necessitates universal compatibility. Users expect that any public charging pile will work with their vehicle, regardless of its make, model, or place of manufacture.
- Connector and Protocol Standardization: Support for major global and regional standards is essential. This includes:
- CCS (Combined Charging System): Widely adopted in North America and Europe for DC fast charging.
- CHAdeMO: A popular DC fast-charging standard, especially for Japanese-manufactured vehicles.
- GB/T: The Chinese national standard for AC and DC charging.
- Type 2 (Mennekes): The standard AC connector in Europe.
The ideal charging station, especially high-power DC units, features multiple cable connectors or universal systems to cater to all standards.
- Power Level Flexibility: Compatibility extends beyond the physical plug. Charging piles should intelligently communicate with the battery electric car to deliver the optimal power level the vehicle’s Battery Management System (BMS) can accept, ranging from slow AC charging (e.g., 7 kW) to ultra-fast DC charging (e.g., 350 kW+).
The compatibility \( K \) of a charging station network can be modeled as the probability that a randomly selected battery electric car will find a functionally compatible charger. If \( p_m \) is the market share of vehicles using standard \( m \), and \( q_m \) is the proportion of chargers supporting that standard, then:
$$K = \sum_{m=1}^{M} p_m \cdot q_m$$
where \( M \) is the total number of connector standards in the market. The goal is to maximize \( K \), ideally approaching 1.
| Standard | Primary Region | Charging Type | Max Power (Typical) | Key Vehicle Brands |
|---|---|---|---|---|
| CCS Combo 1 (SAE J1772) | North America | DC Fast | 350 kW+ | GM, Ford, VW Group, etc. |
| CCS Combo 2 | Europe | DC Fast | 350 kW+ | BMW, Mercedes, Volvo, etc. |
| CHAdeMO | Japan, Global | DC Fast | 400 kW (v2.0) | Nissan, Mitsubishi, Kia |
| GB/T 20234 | China | AC/DC | 250 kW (DC) | All Chinese domestic brands |
| Type 2 (IEC 62196) | Europe | AC | 22 kW (3-phase) | All European brands |
4. Economic Demand
The total cost of ownership for a battery electric car is heavily influenced by charging costs. Users seek transparent, fair, and competitive pricing that makes electric driving economically advantageous over internal combustion engine vehicles.
- Cost Transparency and Structure: Pricing must be clear, breaking down electricity costs, service fees, and any applicable parking fees. Hidden costs or complex pricing models erode trust. Users prefer per-kWh billing over per-minute billing where legally permitted, as it directly correlates with energy received.
- Dynamic and Off-Peak Pricing: To manage grid load and offer savings, time-of-use (TOU) tariffs are beneficial. Encouraging charging during off-peak hours (e.g., overnight) with lower rates provides economic incentive for users and grid stability.
- Service Bundles and Subscriptions: Offering membership plans with reduced per-session fees, flat monthly rates for unlimited slow charging, or bundled services with other mobility offers can enhance perceived value and customer loyalty.
The economic decision for a user to charge at a specific location can be framed as a cost-benefit analysis. The total cost \( TC \) of a charging session is a function of energy drawn \( E \) (kWh), the energy price \( P_e \) (\$/kWh), service fee \( S \) (\$), and opportunity cost of time \( C_t(T) \), which depends on charging time \( T \).
$$TC = E \cdot P_e + S + C_t(T)$$
Where \( T = E / P_{charge} \), and \( P_{charge} \) is the average charging power (kW). Users will seek to minimize \( TC \), favoring high-power chargers (reducing \( T \) and thus \( C_t(T) \)) and locations with lower \( P_e \) and \( S \).
II. Strategic Framework for Service Quality Enhancement
Addressing the aforementioned demands requires a holistic and strategic approach from governments, grid operators, and charging point operators (CPOs).
1. Perfecting Charging Infrastructure Deployment
A strategic, data-driven expansion of the charging network is fundamental.
- Residential-Focused Deployment: Mandate and incentivize 100% charging-ready or pre-wired parking spots in new residential buildings. For existing communities, develop public-private partnerships and streamlined processes to retrofit charging infrastructure, focusing on shared or assigned parking areas.
- Public Network Optimization: Utilize data analytics on traffic patterns, battery electric car registrations, and existing usage to identify and fill coverage gaps. Prioritize high-utilization zones like downtown areas, shopping centers, and transport hubs. Simultaneously, ensure comprehensive coverage along highway corridors and in rural/suburban regions to enable long-distance travel.
- Intelligent Layout Planning: Employ advanced location-allocation models to determine the optimal number, type (AC/DC), and location of charging piles. The objective function \( Z \) for such a model might minimize total cost while ensuring coverage:
$$
\begin{aligned}
\text{Minimize } Z = & \sum_{i \in I} \sum_{j \in J} c_{ij} x_{ij} + \sum_{j \in J} f_j y_j \\
\text{Subject to: } & \sum_{j \in J} x_{ij} \geq d_i \quad \forall i \in I \\
& x_{ij} \leq M y_j \quad \forall i \in I, \forall j \in J \\
& y_j \in \{0,1\}, x_{ij} \geq 0
\end{aligned}
$$
Where \( I \) is the set of demand points, \( J \) is the set of potential charging station locations, \( c_{ij} \) is the cost of serving demand \( i \) from \( j \), \( f_j \) is the fixed cost of building station \( j \), \( d_i \) is the demand at point \( i \), \( x_{ij} \) is the flow of demand, \( y_j \) is a binary variable indicating if station \( j \) is built, and \( M \) is a large constant.
2. Elevating Charging Facility Safety Standards
Safety must be engineered into the system lifecycle and actively managed.
- Regulatory Compliance and Certification: Enforce mandatory safety certifications for all charging equipment sold and installed. Establish clear accountability for periodic safety inspections (e.g., annual) of public charging stations.
- Advanced Safety Technology Integration: Deploy next-generation safety features such as insulation monitoring devices (IMD), residual current monitors (RCM) for DC systems, and thermal sensors on cables and connectors to prevent overheating.
- Centralized Smart Monitoring Platforms: Implement network-wide SCADA (Supervisory Control and Data Acquisition) systems that provide real-time visibility into the operational status of every charging pile. Use machine learning algorithms on operational data to predict component failures before they occur, shifting from reactive to predictive maintenance. The system availability \( A \) can be measured as:
$$A = \frac{MTBF}{MTBF + MTTR}$$
Where MTBF is Mean Time Between Failures and MTTR is Mean Time To Repair. The goal is to maximize \( A \) through robust design (increasing MTBF) and efficient maintenance (reducing MTTR).
| Safety Layer | Specific Measures | Expected Outcome / KPI |
|---|---|---|
| Hardware Design | IP65 rating for outdoor units, reinforced cables, thermal sensors. | Reduce weather/mechanical failure rate by >30%. |
| Electrical Protection | Advanced IMD, DC RCM, auto-reclosing circuit breakers. | Prevent 99.9% of potential electrical hazards. |
| Cybersecurity | TLS 1.3 encryption, hardware security modules (HSM), regular penetration testing. | Zero successful cyber-attacks on payment/BMS data. |
| Proactive Management | AI-powered predictive maintenance, 24/7 remote monitoring center. | Increase system availability (A) to >99%. |
3. Enhancing Charging Pile Compatibility and Interoperability
A truly user-centric network erases compatibility concerns.
- Promotion of Universal Standards: While multiple standards exist, policymakers and large CPOs should encourage the adoption of versatile solutions. This includes deploying charging stations with dual or multiple cable types (e.g., CCS and CHAdeMO) and advocating for the evolution of a truly global standard in the long term.
- Software-Driven Compatibility (Plug & Charge): Implement the ISO 15118 standard for “Plug & Charge” functionality. This allows a battery electric car to automatically identify and authenticate itself to the charger, negotiate the maximum charging power, and bill the correct account—all without any user intervention at the point of charge. This solves both compatibility and convenience issues.
- Open Roaming Platforms: Support the development of interconnected roaming platforms (e.g., like in cellular networks) that allow users of one CPO’s service to seamlessly use the charging stations of another CPO with a single account, app, or payment method. This dramatically increases the effective network size for every user.
4. Optimizing Charging Economics and Value-Added Services
Moving beyond a basic utility model to a service-oriented experience is key.
- Dynamic and Fair Pricing Models: Implement transparent, energy-based (per kWh) pricing. Introduce sophisticated TOU tariffs that reflect real-time grid conditions and renewable energy availability. For example, prices could drop significantly when solar or wind generation is high, encouraging green energy consumption for the battery electric car.
- Integrated Mobility Solutions: Bundle charging with other services. For instance, offer discounted charging at shopping malls, theaters, or sports venues. Integrate charging status and payment into broader mobility-as-a-service (MaaS) applications that also handle public transit, ride-hailing, and parking.
- Enhanced User Amenities and Experience: For charging sessions lasting 15-45 minutes (typical for DC fast charging), the surrounding amenities become crucial. Providing clean restrooms, Wi-Fi, comfortable seating, and food/beverage options at charging hubs transforms a waiting period into a pleasant break, adding significant subjective value to the service.
The value proposition \( V \) for a user at a charging station can be modeled as a function of both economic and experiential factors:
$$V = \alpha \cdot \left( \frac{1}{TC} \right) + \beta \cdot A + \gamma \cdot Q_{amenities}$$
Where \( TC \) is the total cost (inverse relationship), \( A \) is the availability/reliability, \( Q_{amenities} \) is a score for the quality of ancillary services, and \( \alpha, \beta, \gamma \) are user-specific weight coefficients reflecting individual priorities.
| User Demand | Core Strategy | Key Performance Indicators (KPIs) |
|---|---|---|
| Convenience | Smart Network Expansion & Digital Integration | Station density, App functionality score, Average wait time. |
| Safety | Lifecycle Safety Management & Proactive Monitoring | System Availability (A), Number of safety incidents, MTBF. |
| Compatibility | Multi-Standard Hardware & Software Interoperability (ISO 15118) | Network Compatibility Score (K), Plug & Charge success rate. |
| Economic | Dynamic Pricing & Integrated Mobility Bundles | Cost per kWh vs. gasoline, User retention rate, Net Promoter Score (NPS). |
III. Conclusion
The successful transition to a mobility paradigm dominated by the battery electric car hinges on the parallel development of a charging infrastructure ecosystem that is not merely adequate but exceptional. As analyzed, user demands are multifaceted, centering on fundamental expectations of convenience, safety, compatibility, and economic rationality. Addressing these demands requires moving beyond simple hardware deployment to a sophisticated, service-oriented approach. By strategically perfecting infrastructure layout, elevating safety through technology and regulation, ensuring universal compatibility via standards and software, and optimizing the economic and experiential value proposition, stakeholders can dramatically enhance service quality. This holistic enhancement is critical. It reduces “charging anxiety,” increases user satisfaction and loyalty, accelerates the adoption rate of the battery electric car, and ensures the long-term viability and sustainability of the entire electric transportation system. The journey involves continuous investment, innovation, and collaboration, but the destination—a cleaner, smarter, and user-empowered mobility future—is unequivocally worth the effort.