
As a researcher focused on energy storage technologies, I have observed that the global energy transition has spurred an urgent demand for next-generation electrochemical storage systems. Solid-state battery technology, with its inherent safety features and theoretical energy density potential, is recognized by the International Energy Agency as a core breakthrough point for power battery generational replacement. In recent years, competition in solid-state battery technology has intensified globally, with China and Japan emerging as key players. Through patent data analysis, I aim to systematically compare the differentiated development paths and competitive landscapes of solid-state battery technologies in these two countries, covering aspects such as R&D activity, technological themes, competitiveness, and market layout. This article provides a data-driven perspective to inform strategic decision-making in this critical field.
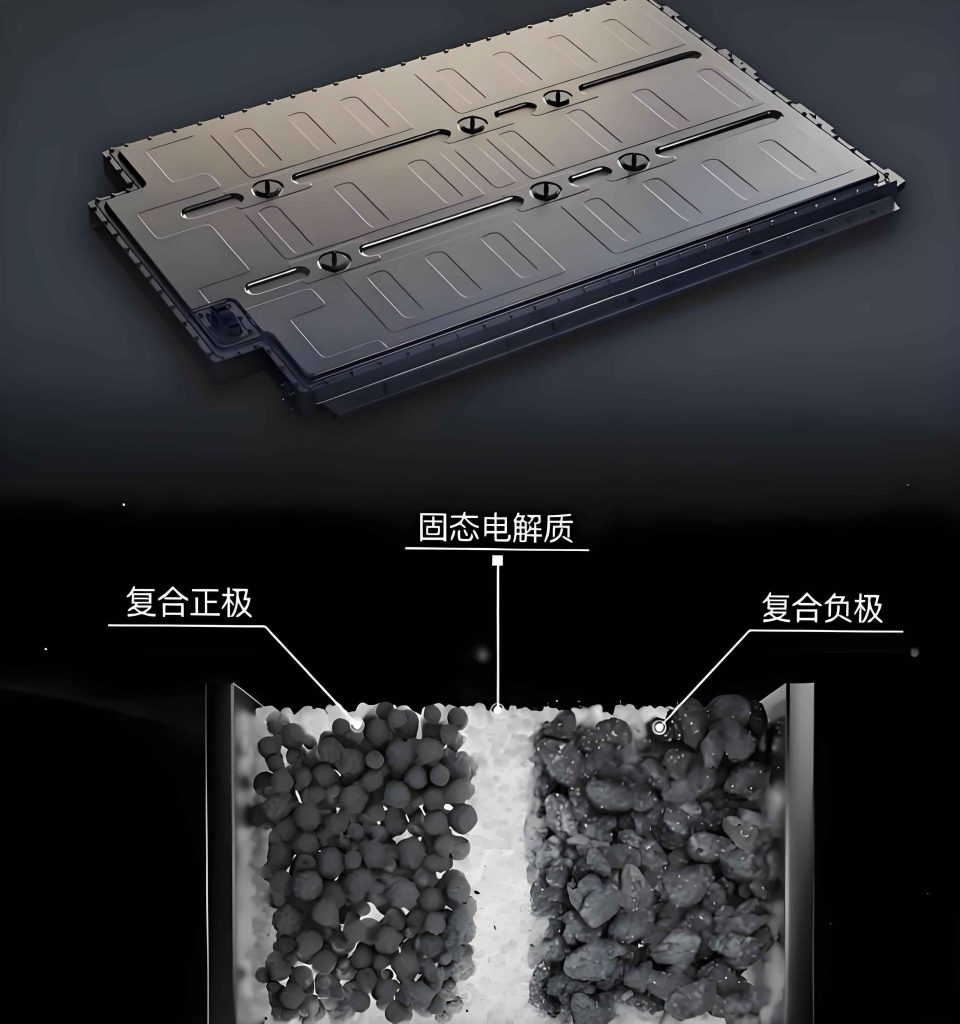
The solid-state battery represents a transformative advancement over conventional lithium-ion batteries by replacing liquid electrolytes with solid counterparts, thereby enhancing safety and energy density. The core components include the cathode, anode, solid electrolyte, current collector, and casing. Major solid electrolyte systems include polymer, oxide, sulfide, and halide-based materials, with composite electrolytes gaining traction due to synergistic effects between organic and inorganic materials. However, challenges such as interface impedance, lithium dendrite growth, insufficient ionic conductivity, manufacturing processes, and cost barriers persist, hindering widespread commercialization. Patent data serves as a reliable source for observing technological innovation activities, offering insights into R&D trajectories and innovation ecosystems.
In this analysis, I adopt a first-person perspective to delve into the patent landscapes of China and Japan. Based on data from the Incopat global patent database, I retrieved relevant patents using a combination of keywords and classification codes. After deduplication, the dataset comprises 23,535 patent families, with 9,110 patents (8,586 families) from China and 16,139 patents (8,965 families) from Japan. The retrieval date was December 20, 2024. I employ multi-dimensional indicators, including R&D activity, technological themes, competitiveness, and market layout, to conduct a comparative assessment. Methods such as lifecycle curves, BERTopic modeling, technology roadmaps, complexity and innovation indices, and jurisdiction analysis are utilized to uncover underlying patterns and disparities.
Policy and Industrial Context: A Comparative Overview
The development of solid-state battery technologies in China and Japan is shaped by distinct policy frameworks and industrial strategies. Japan, as a pioneer, initiated systematic basic research in the 1990s led by industrial giants like Toyota. The Japanese government has implemented multi-level strategic planning through policy guidance, funding support, and industrial collaboration. Key initiatives include the NEDO-led “Next-Generation Electric Vehicle All-Solid-State Lithium Battery” project in 2018, the “Carbon Neutral Green Growth Strategy” in 2020, and the “Battery Industry Strategy” in 2022, which targets commercial application of all-solid-state lithium batteries by 2030. Funding programs, such as the “Electric Vehicle Innovative Battery Development Plan” (2021-2025) with 16.6 billion yen, and the “Battery Supply Assurance Plan” with an additional 350 billion yen in 2024, bolster domestic supply chains. Industrially, Japan has achieved milestones like Mitsui Metals’ 10-ton-scale sulfide electrolyte production line in 2021 and Toyota’s prototype all-solid-state battery vehicle with a 10-minute charge for 1,200 km range in 2024. This cohesive “government-industry-academia” ecosystem has cemented Japan’s early-mover advantage.
In contrast, China’s solid-state battery development started later but has accelerated rapidly under a “policy-driven and market-oriented” dual-track approach. Policies such as the “New Energy Vehicle Industry Development Plan (2021-2035)” in 2020, the “14th Five-Year Plan for New Energy Storage Implementation” in 2022, and the “Energy Electronics Industry Guidance” in 2023 have integrated solid-state batteries into national strategies. Technical breakthroughs include cost-effective oxychloride lithium materials from the University of Science and Technology of China, dry electrode forming technology from Qingtao Energy improving production efficiency threefold, and novel electrolyte materials for all-solid-state lithium-sulfur batteries from Peking University enabling minute-level fast charging and 10,000-cycle durability. Industrially, China has spearheaded semi-solid-state battery commercialization, with shipments soaring to 7 GWh in 2024 and cumulative installation exceeding 5 GWh. Companies like BYD and CATL have announced mass production plans for all-solid-state batteries between 2025 and 2030. This rapid progression reflects China’s focus on application-driven innovation and scale.
The policy and industrial divergence underscores Japan’s emphasis on foundational material innovation and global technology barriers, while China leverages market scale and iterative engineering to foster differentiated advantages. This sets the stage for a nuanced patent-based comparison.
Patent Data Analysis: R&D Activity and Technological Themes
R&D Activity Comparison
Patent output quantity is a key indicator of innovation performance. I examine the overall R&D status, temporal trends, and development stages to gauge activity levels.
Overall R&D Status: Japan holds 16,139 solid-state battery patents, 1.77 times China’s 9,110 patents, indicating deeper technological accumulation. The average patent family size is 1.8 for Japan versus 1.06 for China, suggesting Japan’s propensity for global protection via PCT or multi-jurisdiction filings, whereas China’s patents are predominantly domestic. In terms of patent type, both countries have high proportions of invention patents, reflecting robust innovation vitality. Japan exhibits a higher grant rate (e.g., 50.64% valid patents) compared to China (30.66% valid), implying superior innovation quality. Japan’s median patent maintenance period is 14.3 years, exceeding China’s 9.8 years, highlighting sustained technological commitment. Notably, 41.46% of Japan’s lapsed patents expired due to term completion, while 59.61% of China’s lapsed patents were rejected, pointing to potential quality control challenges in China’s patent system.
| Metric | China | Japan |
|---|---|---|
| Total Patents | 9,110 | 16,139 |
| Patent Families | 8,586 | 8,965 |
| Average Family Size | 1.06 | 1.8 |
| Valid Patents (%) | 30.66% | 50.64% |
| Median Maintenance (years) | 9.8 | 14.3 |
Temporal Trends and Development Stages: Japan initiated solid-state battery research in the 1970s, with patent output remaining stable until 2010, during which it accounted for over 85% of global patents, establishing early monopoly. Post-2010, global solid-state battery patents surged, diversifying the landscape. China’s patent applications exceeded 500 in 2018, comprising 23.11% of global filings, and surpassed Japan in 2022, becoming the most active R&D nation. The applicant-application volume curves reveal distinct patterns: China’s curve shows continuous divergence with an annual growth rate of 27.6%, indicating a rapid development phase. Japan’s curve exhibits step-like growth, with periods of accumulation (e.g., 2011-2015, 2021-2023) followed by expansion (e.g., 2007-2011, 2016-2021), suggesting a cyclical breakthrough-oriented approach. This divergence may signal impending technological paradigm shifts.
Technological Themes and Solid Electrolyte Systems
To identify research foci, I employ BERTopic modeling on patent titles, abstracts, and first claims. For China, key themes include semi/quasi-solid electrolytes (Topic 0), polymer electrolytes (Topic 1), sulfide electrolytes (Topic 2), and composite solid electrolytes (Topic 6). For Japan, themes encompass all-solid electrolytes (Topic 0), conductive materials (Topic 1), positive electrode materials (Topic 4), and negative active materials (Topic 5). This indicates China’s multi-path parallel advancement in electrolyte systems, particularly in semi-solid and composite realms, while Japan emphasizes “electrolyte-electrode协同发展” with a focus on all-solid electrolytes and electrode innovation.
Delving into mainstream solid electrolyte systems, I categorize patents based on keywords and classification codes, supplemented by technology roadmaps to trace core breakthroughs. The evolution is summarized below:
| Period | China’s Focus | Japan’s Focus | Global Context |
|---|---|---|---|
| 1970s | Minimal technical reserve | Early exploration (e.g., alumina, lithium iodide) | Global萌芽: porous solid electrolytes |
| 1980s | Emergent local materials (e.g., PAN-based composites) | Diversified exploration: PEO-based polymers, glassy sulfides, β-alumina oxides | Japan dominates with多元化探索 |
| 1990s | Initial exploration (e.g., gel electrolyte films) | Polymer dominance, sulfide deepening, oxide expansion (e.g., perovskites) | Japan holds 62.8% global patents |
| 2000s | Polymer-led, multi-route exploration (e.g., in-situ polymerization, LLTO doping) | Sulfide breakthroughs (crystalline sulfides), polymer-organic-inorganic composites, garnet-type oxides | Japan leads sulfide体系; China pursues多元化 |
| 2010s | Polymer/oxide differentiation: nano-fillers, ionic liquids, LLZO/LATP/LAGP oxides | Sulfide/halide barriers (e.g., Li3YX6 halides), garnet oxide doping, interface engineering | Divergent paths: Japan builds壁垒; China focuses on应用牵引 |
| 2020s | Composite systems, low-cost processes (e.g., dry electrode, low-temperature sintering) | Basic material innovation, interface攻坚, sulfide/halide refinement, oxide densification | Global performance optimization; China accelerates产业化 |
The solid-state battery landscape is characterized by ongoing material challenges. Sulfide electrolytes offer high ionic conductivity but face stability and cost issues; halide electrolytes show promise in conductivity and electrochemical window but require stability improvements; oxide electrolytes provide mechanical strength yet suffer from interface impedance; polymer electrolytes are process-mature but limited by conductivity and high-voltage tolerance. China’s strategy involves short-term industrialization of polymer composite systems and long-term focus on high-energy-density systems like sulfides, while Japan consolidates its sulfide and halide advancements.
Technical Competitiveness: Complexity and Innovation
To assess technological competitiveness, I compute complexity and innovation indices based on patent data.
Technological Complexity
Complexity is measured through technological depth and breadth, where higher values indicate more intricate inventions. Following Ozman’s method, depth ($$d_{ij}$$) and breadth ($$b_i$$) are derived from IPC classifications. The overall complexity $$C_i$$ is given by:
$$C_i = d_{ij} + b_i$$
where $$d_{ij} = \sum_{m} x_j(k_{im}) (1 – w_{ij})$$, with $$x_j(k_{im})$$ indicating whether subclassification $$k_{im}$$ belongs to the main field $$j$$, and $$w_{ij}$$ as the Blau index for concentration. Breadth $$b_i = \sum_{m} sim_{jm}$$, with $$sim_{jm}$$ being similarity between subclass and main class.
The results show China’s average depth is 1.27, breadth 1.90, complexity 3.17; Japan’s average depth is 0.82, breadth 2.35, complexity 3.16. While China exhibits greater depth in specific domains, Japan demonstrates broader technological integration. Notably, Japan has more patents with complexity above 5, underscoring its edge in high-value core patents.
| Complexity Range | China Patents (%) | Japan Patents (%) |
|---|---|---|
| [0,1) | 15.2% | 32.1% |
| [1,2) | 25.4% | 18.7% |
| [2,3) | 37.3% | 24.5% |
| [3,4) | 12.1% | 10.8% |
| [4,5) | 6.5% | 8.9% |
| >5 | 3.5% | 5.0% |
Technological Innovation
Innovation is gauged using the disruptiveness index based on citation networks. The formula is:
$$I = \frac{8N_2^2}{2(N_1 + N_2)^2 + (N_1 + N_2) \times N_3}$$
where $$N_1$$ is the number of patents citing both the target and its references, $$N_2$$ cites the target but not references, and $$N_3$$ cites references but not the target. Higher $$I$$ values denote greater innovativeness.
Japan’s average innovation index is 1.16, compared to China’s 0.88, indicating superior breakthrough potential. Distributionally, Japan holds over 70% of patents in high-innovation ranges (I > 4), whereas China concentrates in moderate ranges (I ≤ 4), with less than 35% in high-innovation tiers. This suggests China excels in incremental improvements, while Japan leads in foundational breakthroughs, potentially creating “bottleneck” risks for China.
| Innovation Range (I) | China Patents (%) | Japan Patents (%) |
|---|---|---|
| 0 | 20.3% | 18.5% |
| (0,2] | 45.6% | 42.1% |
| (2,4] | 25.1% | 22.4% |
| (4,6] | 6.8% | 12.5% |
| (6,8] | 1.9% | 3.8% |
| >8 | 0.3% | 0.7% |
Technology Market Layout and Flow
Patent jurisdiction analysis reveals market strategies and technological flows.
Market Layout
Globally, there are 11,840 valid solid-state battery invention patents across 34 jurisdictions. China is the largest target market with 4,238 patents (35.79%), followed by Japan (3,044 patents, 25.72%), the United States (2,212 patents, 18.68%), South Korea (1,296 patents, 10.95%), and Europe (494 patents, 4.17%). East Asian and欧美 markets constitute over 95% of the competitive arena. China’s market is characterized by strong domestic innovation: 71.60% of its valid patents are held by local applicants. Japan, however, exerts significant influence worldwide, holding 43.6% of U.S. patents, 24.88% in South Korea, 44.33% in Europe, and 42.02% in India. Japan’s global footprint contrasts with China’s domestic focus, highlighting disparities in internationalization.
| Jurisdiction | Total Valid Patents | China’s Share (%) | Japan’s Share (%) |
|---|---|---|---|
| China | 4,238 | 71.60% | 19.6% |
| Japan | 3,044 | 2.1% | 88.01% |
| United States | 2,212 | 2.8% | 43.6% |
| South Korea | 1,296 | 5.1% | 24.88% |
| Europe | 494 | 3.4% | 44.33% |
Technological Flow
Analyzing application jurisdictions shows Japan’s expansive global network, covering 29 offices, with over 10 patents in 14 countries/regions. Its overseas patent families total 8,387, accounting for 51.97% of its portfolio, centered on the U.S. (2,187 patents), China (1,632 patents), European Patent Office (1,215 patents), Germany (894 patents), and South Korea (763 patents). This “local R&D, global layout” strategy enhances technology dominance and licensing revenue. Conversely, China’s flow is inward-looking: 98.65% of its patents (8,470) are domestic, with only 640 overseas families, primarily in the U.S. (214), Japan (187), and South Korea (132). While this benefits from domestic policy and scale, it may expose China to licensing pressures and litigation risks in global markets.
Summary and Strategic Recommendations
In summary, Japan’s solid-state battery advancement is built on early-mover advantage, sustained policy support, and a focus on sulfide and halide electrolytes, yielding high-energy-density systems with superior complexity and innovation indices. Its global patent布局 forms significant technological barriers. China, driven by policy and market application, has carved niches in semi-solid-state battery commercialization, composite electrolyte systems, and low-cost工艺 optimization, but lags in high-innovation patents and overseas market presence. The竞争格局 reflects Japan’s foundational material leadership versus China’s application-driven agility.
To optimize China’s solid-state battery technology攻关 path, I propose an integrated four-pillar strategy: “Basic R&D Innovation – Patent System Safeguarding – Technical Standards Leadership – Industrial Ecosystem Reconstruction.”
- Basic R&D Innovation: Address core bottlenecks like interface impedance and lithium dendrites through targeted funding for high-ionic-conductivity electrolytes and high-voltage electrodes. Explore functional composite designs and前瞻性 halide electrolytes. Promote low-cost processes (e.g., dry electrode, low-temperature sintering) via tax incentives and subsidies, strengthening industry-academia collaboration for产业化.
- Patent System Safeguarding: Remedy overseas布局 weaknesses by prioritizing PCT filings for hybrid solid-liquid electrolyte technologies in key markets like the U.S. and EU. Establish patent risk assessment mechanisms to monitor Japanese core patents (e.g., Toyota, Panasonic) and avoid infringement. Domestically, enhance patent quality control, focusing on core patents at critical nodes while phasing out repetitive改良型 applications.
- Technical Standards Leadership: Accelerate the development of a comprehensive standard system covering materials, processes, and performance testing for solid-state batteries. Collaborate with authoritative institutions and leading firms to publish technical white papers, defining metrics like ionic conductivity and cycle life. Engage in international standard-setting to incorporate Chinese solutions, leveraging advantages in semi-solid-state batteries and规模化 production.
- Industrial Ecosystem Reconstruction: Foster vertical integration across materials, equipment, and manufacturing, encouraging clusters among龙头企业 and上下游. Reduce dependency on foreign critical materials by supporting local enterprises in sulfide purification and electrolyte powder production. Accelerate semi-solid-state battery deployment in new energy vehicles and储能 through policies like extended tax exemptions and优先采购 domestic batteries.
This four-pillar approach aims to transform China’s solid-state battery sector from technological catch-up to industrial leadership, ensuring competitiveness in the global energy storage arena. The solid-state battery remains a pivotal technology for the future, and strategic alignment will determine national standing in the impending energy revolution.