
My research focuses on a battery thermal management system (BTMS) that couples microchannel liquid cooling with composite phase change materials (PCMs) for cylindrical traction battery modules. Lithium-ion traction batteries are regarded as one of the most promising power sources for electric vehicles because of their high energy density and long service life. Nevertheless, traction batteries are highly sensitive to temperature. If the temperature exceeds the recommended working window, severe capacity fading occurs; if the module temperature difference is greater than 5 °C, the cycle life of the traction battery may decrease by more than 30%. In extremely cold climates, the available capacity of a traction battery can drop by more than 50% because of slower lithium-ion diffusion and higher interfacial charge-transfer resistance. Therefore, a multifunctional thermal management strategy is indispensable for high-formance and reliable traction batteries.
The ultimate goal of my work is to develop a unified architecture that can dissipate heat rapidly during high-rate discharging, warm up the traction battery in low-temperature environments, and preserve heat when the vehicle is parked. I have designed a honeycomb-inspired cell layout in which 18650-type cells are surrounded by paraffin/expanded-graphite composite PCM and interlaced with an aluminium frame containing circular microchannels. This configuration simultaneously improves spatial compactness and heat-exchange efficiency. The complete model uses a validated heat-generation model as an input and evaluates both cooling performance and preheating performance through transient computational fluid dynamics (CFD) simulations.
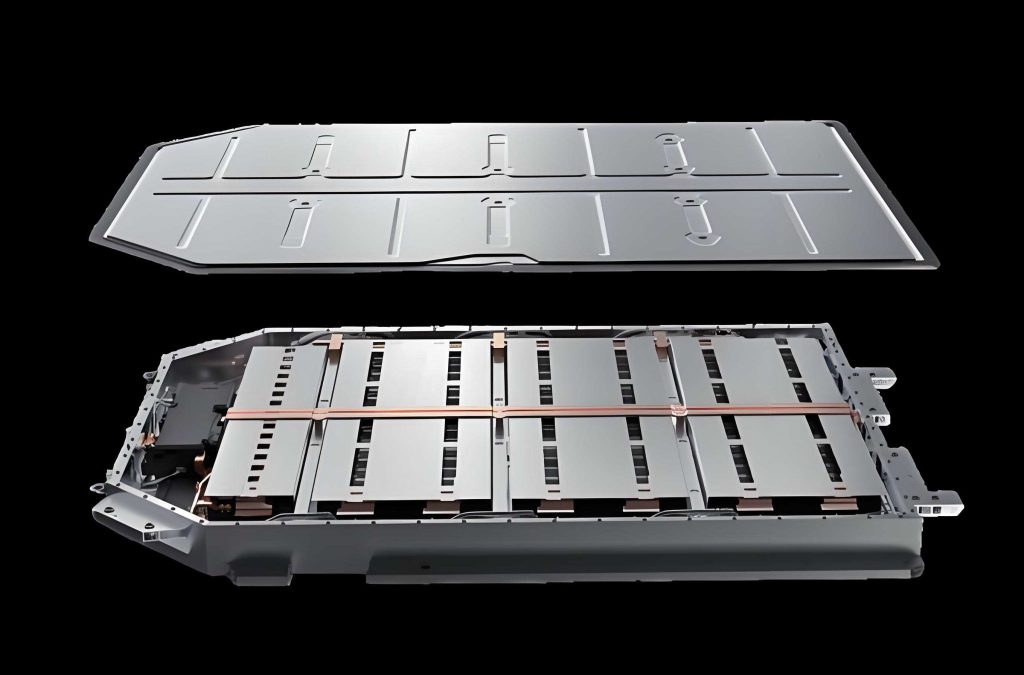
The conceptual linkage between a traction battery module and its thermal-management fluid is illustrated below.
1. Battery Thermal Modelling
The traction battery considered in this study is a commercial 18650 lithium iron phosphate cell with a nominal capacity of 1.5 Ah and a nominal voltage of 3.2 V. Its active body is simplified as a homogeneous cylinder with a diameter of 18 mm and a height of 65 mm. The thermophysical properties used in the computation are summarized in Table 1.
| Property | Value |
|---|---|
| Average density (kg/m3) | 2180 |
| Average specific heat capacity (J kg-1 K-1) | 1066 |
| Radial thermal conductivity (W m-1 K-1) | 1.1 |
| Circumferential thermal conductivity (W m-1 K-1) | 1.1 |
| Axial thermal conductivity (W m-1 K-1) | 12.5 |
Because the internal structure of a traction battery consists of multiple layers with different thicknesses, equivalent properties are calculated by volume averaging. The density and specific heat capacity can be expressed as
$$
\rho_{\mathrm{eff}} = \frac{\sum_{i} m_i}{\sum_{i} V_i}, \qquad
c_{p,\mathrm{eff}} = \frac{\sum_{i} \rho_i V_i c_{p,i}}{\sum_{i} \rho_i V_i},
$$
where \(m_i\) is the mass of each component, \(V_i\) is its volume, \(\rho_i\) is its density, and \(c_{p,i}\) is its specific heat. Orthotropic thermal conductivity is determined by using series/parallel thermal-resistance networks. The radial conductivity, which is dominated by the laminated structure, is calculated as
$$
k_r = \frac{\sum_{i} L_i}{\sum_{i} L_i / k_i},
$$
whereas the axial conductivity is obtained by parallel summation:
$$
k_h = \frac{\sum_{i} L_i k_i}{\sum_{i} L_i}.
$$
2. Heat Generation Model and Validation
The temporal and spatial temperature behavior inside a traction battery is governed by the energy-conservation equation
$$
\rho c_p \frac{\partial T}{\partial t} = \nabla \cdot (k \nabla T) + q_{\mathrm{gen}}.
$$
Because direct measurements of local heat generation are difficult, I employed the widely used Bernardi equation. The total heat-generation rate per unit volume is given by
$$
q_{\mathrm{gen}} = \frac{I}{V_0} \left[ \left(E_{\mathrm{OC}} – E\right) + T \frac{\mathrm{d}E_{\mathrm{OC}}}{\mathrm{d}T} \right],
$$
where \(I\) is the current (positive during discharge), \(V_0\) is the battery volume, \(E_{\mathrm{OC}}\) is the open-circuit voltage, \(E\) is the operating voltage, and \(T \,\mathrm{d}E_{\mathrm{OC}}/\mathrm{d}T\) represents the reversible entropic heat contribution. For the considered battery chemistry, the irreversible resistance can be described by a cubic polynomial in temperature:
$$
R_{\Omega} + R_P = -0.0001T^3 + 0.0134T^2 – 0.5345T + 12.407,
$$
where \(T\) is in degrees Celsius. Therefore, the practical volumetric heat source can be written as
$$
q_{\mathrm{gen}} = \frac{I}{V_0}\left[ I(R_{\Omega}+R_P) + T\frac{\mathrm{d}E_{\mathrm{OC}}}{\mathrm{d}T} \right].
$$
At an ambient temperature of 35 °C, the corresponding heat-generation rates for discharge rates from 1C to 4C are computed and listed in Table 2.
| Discharge rate | Current (A) | Heat generation rate (W/m3) |
|---|---|---|
| 1C | 1.5 | 5 362 |
| 2C | 3.0 | 30 586 |
| 3C | 4.5 | 60 156 |
| 4C | 6.0 | 126 758 |
To verify the heat-generation model, I simulated a single cell discharged at 3C with an initial temperature of 20 °C and compared the predicted surface-temperature history with an independent experimental measurement from the literature. The model correctly reproduces the monotonic rise of temperature; the maximum deviation at the end of discharge is less than 0.64 °C, which is acceptable for subsequent parametric studies on the traction battery module.
3. Coupled Microchannel–PCM BTMS Architecture
My proposed BTMS contains a \(4 \times 4\) array of cylindrical traction batteries arranged in a staggered, honeycomb-like pattern. Each battery is surrounded by a composite PCM consisting of paraffin and expanded graphite. The PCM occupies the void space within an aluminium frame, and the frame has vertical circular microchannels with a diameter of 1 mm. The frame height is equal to the battery height of 65 mm, and the minimum distance between the frame inner surface and the battery surface is 1.25 mm. Three arrangements of microchannels are examined later:
- Case 1: 63 channels, located at the centre of each side of the aluminium frame;
- Case 2: 111 channels, obtained by adding one channel at each vertex and preserving the same total flow rate using a proportionally lower inlet velocity;
- Case 3: 174 channels, with additional channels placed at the one-third points of each side.
The transport equations for the water in the microchannels are the continuity, momentum and energy equations:
$$
\frac{\partial \rho_w}{\partial t} + \nabla \cdot (\rho_w \mathbf{v}) = 0,
$$
$$
\rho_w \frac{\partial \mathbf{v}}{\partial t} + \rho_w (\mathbf{v} \cdot \nabla)\mathbf{v} = -\nabla p + \mu_w \nabla^2 \mathbf{v},
$$
$$
\rho_w c_{p,w}\frac{\partial T_w}{\partial t} + \rho_w c_{p,w} \mathbf{v}\cdot \nabla T_w = \nabla \cdot (\lambda_w \nabla T_w).
$$
For the PCM, the enthalpy-porosity approach is adopted. The energy equation is
$$
\rho_{\mathrm{PCM}} \frac{\partial H}{\partial t} = \nabla \cdot (k_{\mathrm{PCM}} \nabla T),
$$
with \(k_{\mathrm{PCM}}\) denoting the equivalent conductivity of the composite PCM. The total enthalpy is decomposed into sensible and latent parts:
$$
H = H_{\mathrm{sen}} + \Delta H,
\qquad
H_{\mathrm{sen}} = \int_{T_0}^{T} c_{p,\mathrm{PCM}} \,\mathrm{d}T,
\qquad
\Delta H = \beta \gamma,
$$
where \(\gamma\) is the latent heat of fusion and \(\beta\) is the liquid fraction, defined by
$$
\beta =
\begin{cases}
0, & T < T_s, \\[2mm]
\dfrac{T – T_s}{T_l – T_s}, & T_s \le T \le T_l, \\[2mm]
1, & T > T_l.
\end{cases}
$$
The phase transition temperature of the selected PCM is 37 °C, with a melting interval of 1 °C. The thermophysical parameters of the composite PCM with different expanded-graphite (EG) mass fractions are given in Table 3. The thermal conductivity increases markedly with EG content, whereas the specific heat capacity and latent heat decrease slightly.
| EG mass fraction (%) | Thermal conductivity (W m-1 K-1) | Density (kg/m3) | Specific heat (J kg-1 K-1) | Latent heat (J/g) |
|---|---|---|---|---|
| 0 | 0.245 | 800 | 2300 | 200.66 |
| 2 | 0.324 | 800 | 2260 | 196.65 |
| 5 | 0.907 | 800 | 2200 | 191.37 |
| 8 | 1.374 | 800 | 2140 | 184.61 |
| 10 | 1.687 | 800 | 2100 | 180.60 |
| 15 | 2.499 | 800 | 2000 | 170.56 |
| 20 | 3.355 | 800 | 1900 | 160.53 |
In all simulations, the aluminium frame and the cell provide convective heat transfer with the surroundings at 35 °C for discharge cases. The external heat-transfer coefficients are assumed to be 10 W/m2/K on the aluminium and cell surfaces, and 5 W/m2/K on the outer PCM boundary. Solid walls adjacent to fluids are treated as no-slip conjugate heat-transfer interfaces. The SIMPLE algorithm is used for pressure–velocity coupling, and second-order upwind schemes are selected for the convective terms.
I independently tested the grid dependence by comparing four mesh counts: 1 166 891, 1 971 858, 3 802 869, and 7 464 891 cells. The resulting maximum temperatures after the complete 4C discharge are listed in Table 4. When the grid number is increased from 1 971 858 to 7 464 891, the maximum temperature changes by less than 0.05 °C. Therefore, the mesh with 1 971 858 cells is chosen for the rest of this thesis. A time-step independence test also showed that a 2 s time step is sufficiently accurate for the transient simulations.
| Mesh count | Maximum temperature at 900 s (°C) |
|---|---|
| 1 166 891 | 40.06 |
| 1 971 858 | 39.83 |
| 3 802 869 | 39.80 |
| 7 464 891 | 39.79 |
4. Cooling Performance Evaluation
4.1 Comparison between pure PCM cooling and PCM–microchannel cooling
I first compared two cooling strategies for the traction battery module under an ambient temperature of 35 °C and a 4C discharge: pure PCM cooling (the aluminium frame and water are removed and the cells are fully immersed in composite PCM) and the coupled PCM–microchannel liquid-cooling scheme. For the coupled arrangement, the coolant inlet velocity is 0.1 m/s and the inlet temperature is 35 °C.
Figure 3 shows the transient maximum temperature and maximum temperature difference. During the first 80 s, the temperature rises quickly because the sensible-heat capacity of PCM is the dominant heat sink. Once the interface temperature reaches approximately 37 °C, the PCM starts to melt and the latent-heat absorption slows down the rate of temperature rise. Table 5 summarizes the performance at the end of discharge.
| Cooling strategy | Maximum temperature (°C) | Maximum temperature difference (°C) | Final liquid fraction |
|---|---|---|---|
| Pure PCM cooling | 41.98 | 3.50 | 0.90 |
| PCM + microchannel liquid cooling | 39.83 | 2.95 | 0.33 |
The coupled strategy reduces the maximum temperature of the traction battery module by 2.15 °C and the maximum temperature difference by 0.55 °C. Furthermore, the liquid fraction of PCM is significantly lower in the coupled system because the microchannel flow continuously removes heat from the aluminium frame. Thus, the PCM is not fully saturated, leaving more latent-heat reserve for transient overheating events. This comparison confirms that the proposed coupled BTMS is superior for high-power traction battery applications.
4.2 Effect of microchannel number
For fixed total volumetric flow rate, the number of microchannels affects both the heat-transfer area and the per-channel mass flux. I examined Cases 1–3 with a baseline total flow equal to Case 1 at 0.1 m/s. The inlet velocities for Cases 2 and 3 are accordingly 0.0567 m/s and 0.0362 m/s. The final temperatures and differences are presented in Table 6.
| Case | Channel count | Inlet velocity (m/s) | Maximum temperature (°C) | Temperature difference (°C) | Final liquid fraction |
|---|---|---|---|---|---|
| Case 1 | 63 | 0.1000 | 39.83 | 2.94 | 0.33 |
| Case 2 | 111 | 0.0567 | 39.82 | 3.14 | 0.24 |
| Case 3 | 174 | 0.0362 | 40.09 | 3.51 | 0.25 |
Increasing the number of channels enlarges the wetted area, but the smaller per-channel velocity reduces the local heat-transfer coefficient. The maximum temperature is slightly lower in Case 2 than in Case 1, although the difference is negligible. In Case 3, the velocity becomes so small that the cooling performance deteriorates and the temperature difference increases to 3.51 °C. Therefore, Case 1 is considered a well-balanced choice if the baseline total flow rate is retained.
4.3 Effect of coolant velocity
Using Case 1 with 5% EG composite PCM, I varied the inlet velocity from 0.05 to 0.2 m/s. Table 7 reports the results after the 900 s 4C discharge. As the velocity increases, the maximum temperature decreases, while the maximum temperature difference remains small. The final PCM liquid fraction decreases because more heat is carried away by the coolant.
| Inlet velocity (m/s) | Maximum temperature (°C) | Temperature difference (°C) | Final liquid fraction |
|---|---|---|---|
| 0.05 | 40.25 | 2.87 | 0.46 |
| 0.10 | 39.83 | 2.94 | 0.33 |
| 0.20 | 39.63 | 3.10 | 0.24 |
Doubling the velocity from 0.1 to 0.2 m/s reduces the maximum temperature by only 0.2 °C. This marginal benefit is accompanied by higher pumping power and a slightly larger temperature gradient. Thus, 0.1 m/s is a recommended operating condition for the traction battery cooling mode.
4.4 Effect of expanded-graphite mass fraction in the PCM
The thermal conductivity of PCM is the most critical property affecting heat release from the traction battery. I evaluated seven EG fractions: 0%, 2%, 5%, 8%, 10%, 15%, and 20%. The inlet velocity was fixed at 0.1 m/s and the discharge rate was 4C. Table 8 lists the maximum temperature, maximum temperature difference, and final liquid fraction.
| EG mass fraction (%) | Maximum temperature (°C) | Temperature difference (°C) | Final liquid fraction |
|---|---|---|---|
| 0 | 40.51 | 2.94 | 0.46 |
| 2 | 39.98 | 2.94 | 0.36 |
| 5 | 39.83 | 3.03 | 0.33 |
| 8 | 39.54 | 3.12 | 0.28 |
| 10 | 39.45 | 3.14 | 0.34 |
| 15 | 39.32 | 3.15 | 0.30 |
| 20 | 39.16 | 3.17 | 0.29 |
Increasing the EG fraction from 0% to 5% reduces the maximum temperature by 0.68 °C; further increasing the EG fraction from 5% to 20% reduces it by only another 0.67 °C. In contrast, the temperature difference increases monotonically. Since a high EG fraction increases the electrical conductivity of the PCM and consequently raises the risk of a short circuit in a traction battery pack, an EG fraction of 5% is selected as the best compromise between thermal performance and safety.
4.5 Effect of inlet/outlet flow arrangement
For Case 1, the coolant flow was initially top-to-bottom. A counter-flow arrangement was established by turning half of the channels upside down, so that adjacent channels carry the fluid in opposite axial directions. Figure 4 in my data shows that the counter-flow arrangement reduces the maximum temperature from 39.83 °C to 39.80 °C and the temperature difference from 3.15 °C to 2.77 °C. The PCM liquid fraction also increases from 0.25 to 0.29, implying more effective use of the latent-heat capacity. The improvement is attributed to a more symmetric temperature field in the aluminium frame and a shorter distance between adjacent high-temperature and cold regions.
| Flow arrangement | Maximum temperature (°C) | Temperature difference (°C) | Final liquid fraction |
|---|---|---|---|
| Co-current (all channels top-to-bottom) | 39.83 | 3.15 | 0.25 |
| Counter-current (adjacent channels in opposite directions) | 39.80 | 2.77 | 0.29 |
5. Preheating Performance Evaluation
In cold climates, a traction battery must be preheated before charging and discharging. I define the rate of temperature rise (RTR) as
$$
\mathrm{RTR} = \frac{20^{\circ}\mathrm{C} – (-20^{\circ}\mathrm{C})}{\tau},
$$
where \(\tau\) is the time required for the coldest point on the traction battery surface to rise from −20 °C to +20 °C. In this part, the initial temperature and the external environment are both set to −20 °C unless otherwise specified. Warm water at 25 °C enters the microchannels.
6. Thermal Insulation Performance
Before preheating studies, I evaluated the thermal insulation ability of the PCM integrated in the traction battery module. The module was initialized at 50 °C and placed in a −10 °C environment for 10 h. A no-PCM case was included as a reference. Table 10 shows the predicted time for the maximum cell temperature to fall to 0 °C.
| EG fraction (%) | Time for maximum temperature to drop to 0 °C (h) |
|---|---|
| No PCM | <1.0 |
| 0 | >10 |
| 5 | ~5.5 |
| 8 | ~4.2 |
| 10 | ~3.6 |
| 15 | ~2.9 |
| 20 | ~2.5 |
Pure paraffin gives the longest insulation time because of its high latent heat and low thermal conductivity. As the expanded-graphite content increases, the PCM conducts heat from the batteries to the environment more quickly, which shortens the insulation time. Thus, for insulation purposes, a lower EG content is beneficial. Nevertheless, an EG content of 5% still offers meaningful insulation while maintaining sufficiently high conductivity for the preheating process.
7. Preheating Parameter Study
7.1 Effect of EG mass fraction on preheating
Using Case 1 with an inlet velocity of 0.1 m/s and warm water at 25 °C, I studied the effect of EG mass fraction on preheating by recording the time when the minimum battery temperature reaches 20 °C. The results are given in Table 11.
| EG fraction (%) | Preheating time (s) | RTR (°C/min) | Temperature difference (°C) |
|---|---|---|---|
| 0 | 405 | 5.93 | 1.98 |
| 2 | 360 | 6.67 | 2.21 |
| 5 | 272 | 8.82 | 2.53 |
| 8 | 256 | 9.38 | 2.70 |
| 10 | 250 | 9.60 | 2.83 |
| 15 | 240 | 10.00 | 3.05 |
| 20 | 235 | 10.21 | 3.13 |
Increasing the EG fraction from 0% to 5% reduces the preheating time by 133 s, whereas an additional increase from 5% to 20% reduces it by only 37 s. The temperature difference grows continuously, but remains below 3.2 °C for all cases. Therefore, 5% EG is again selected, because it provides most of the thermal benefit without introducing excessive electrical conductivity into the traction battery package.
7.2 Effect of preheating fluid velocity
The flow velocity was varied from 0.05 m/s to 1.0 m/s while the structure used Case 1 and the EG fraction was 5%. The preheating outcomes are presented in Table 12.
| Velocity (m/s) | Preheating time (s) | RTR (°C/min) | Temperature difference (°C) |
|---|---|---|---|
| 0.05 | 380 | 6.32 | 2.95 |
| 0.10 | 272 | 8.82 | 3.25 |
| 0.25 | 211 | 11.37 | 3.32 |
| 0.50 | 186 | 12.90 | 3.46 |
| 1.00 | 169 | 14.20 | 3.55 |
From 0.05 m/s to 0.25 m/s, the preheating time drops from 380 s to 211 s (a 44.5% reduction). A further increase from 0.25 m/s to 1.0 m/s saves only 42 s. Because the marginal benefit becomes small above 0.25 m/s while the pumping power continues to grow, I choose 0.25 m/s as the recommended preheating velocity for the traction battery thermal management system.
7.3 Effect of microchannel number on preheating
At the same total flow rate corresponding to Case 1 with 0.25 m/s, I compared Cases 1–3 (inlet velocities are 0.25, 0.1418, and 0.0905 m/s, respectively). Table 13 lists the preheating performance.
| Case | Channel count | Inlet velocity (m/s) | Preheating time (s) | RTR (°C/min) | Temperature difference (°C) |
|---|---|---|---|---|---|
| Case 1 | 63 | 0.2500 | 211 | 11.37 | 3.32 |
| Case 2 | 111 | 0.1418 | 192 | 12.50 | 3.65 |
| Case 3 | 174 | 0.0905 | 181 | 13.26 | 4.50 |
More channels provide more heat-transfer area and thus decrease the preheating time. However, the temperature non-uniformity becomes worse, especially in Case 3, because the entrance-side cells are strongly heated while the exit-side cells still remain cold. Since Case 2 balances time and uniformity, I consider Case 2 as the updated design for the final preheating optimization.
7.4 Effect of flow direction on preheating
Employing Case 2 and 0.1418 m/s, I compared co-current and counter-current flow arrangements. The counter-current design slightly increases the preheating time from 192 s to 194 s, but it reduces the temperature difference from 3.65 °C to 3.25 °C. The improvement in temperature uniformity comes from a symmetric temperature distribution along the axial direction. Since the additional time is only 2 s and the value of uniformity is substantial for battery longevity, the counter-current flow arrangement is preferred.
| Flow arrangement | Preheating time (s) | RTR (°C/min) | Temperature difference (°C) |
|---|---|---|---|
| Co-current | 192 | 12.50 | 3.65 |
| Counter-current | 194 | 12.37 | 3.25 |
7.5 Effect of preheating fluid temperature and ambient temperature
In practice, ambient temperature varies. I evaluated four preheating-fluid temperatures (25, 35, 40, and 45 °C) for four ambient temperatures (−40, −30, −20, and −10 °C), using Case 2 with the counter-current arrangement. The preheating times are reported in Table 15.
| Ambient temperature (°C) | Fluid 25 °C | Fluid 35 °C | Fluid 40 °C | Fluid 45 °C |
|---|---|---|---|---|
| −40 | 223 | 146 | 119 | — |
| −30 | 208 | 135 | 110 | — |
| −20 | 192 | 124 | 102 | — |
| −10 | 178 | 115 | 95 | — |
The data reveal that the preheating-fluid temperature has a stronger influence than the ambient temperature. For example, at −40 °C, raising the fluid from 25 to 35 °C reduces the time by 77 s, whereas raising the ambient temperature from −40 to −30 °C with a 25 °C fluid reduces it by only 15 s. However, increasing the fluid temperature above the PCM melting point (37 °C) triggers latent-heat absorption; this absorption buffers the heat transfer to the cells and partially diminishes the additional improvement.
The temperature difference after preheating is listed in Table 16. A higher preheating-fluid temperature considerably increases the final temperature gradient. For instance, with a 25 °C fluid, the final temperature difference is only 3.25 °C at −20 °C, whereas with a 45 °C fluid it exceeds 16 °C. Therefore, an optimal preheating strategy should not use an excessively hot fluid if the ambient temperature is not extremely low. The PCM phase change can mitigate the increase in temperature difference once the fluid temperature exceeds 37 °C, because the two-phase zone maintains a nearly constant temperature and regulates the heat flux distribution.
| Ambient temperature (°C) | Fluid 25 °C | Fluid 35 °C | Fluid 40 °C | Fluid 45 °C |
|---|---|---|---|---|
| −40 | 4.3 | 11.2 | 14.5 | — |
| −30 | 3.9 | 10.8 | 14.1 | — |
| −20 | 3.65 | 10.1 | 13.8 | — |
| −10 | 3.4 | 9.6 | 13.2 | — |
8. Multifunctional Thermal Management Summary
The proposed coupled microchannel–PCM architecture was verified to satisfy the principal requirements of traction battery thermal management in both hot and cold climates. Under high-temperature operation at 35 °C and a 4C discharge rate, the maximum temperature is controlled below 40 °C, while the maximum difference remains within 3 °C. This outcome is achieved with the following selected parameters: 5% EG in the composite PCM, 63 microchannels or the extended Case 2 layout, a coolant velocity of 0.1 m/s, and a counter-current flow arrangement.
Under cold conditions, the integrated PCM insulation slows the thermal loss of a warm traction battery pack. The preheating simulation at −20 °C shows that the battery surface can be warmed from −20 °C to 20 °C within about 194 s using 25 °C water at 0.1418 m/s in the 111-channel counter-current layout. This preheating time is approximately 30% shorter than that of a baseline design without the optimized EG content, and the final temperature difference is improved by 20% through the counter-current flow arrangement. Thus, the multifunctional BTMS successfully combines three functions: forced liquid cooling, passive thermal buffering by PCM, and active liquid preheating in one compact structure.
The broad contribution of my work lies in revealing how design parameters govern the coupled transport phenomena in a traction battery module. In particular, I identified clear marginal effects for both the graphite mass fraction (5% is critical) and the coolant velocity (0.1 m/s for cooling and 0.25 m/s for preheating are critical). These findings offer practical guidance for the design of efficient, safe, and economical BTMS solutions in electric vehicles using traction batteries.
Several limitations still need attention. My models assume a constant discharge current, but real traction batteries experience highly dynamic current profiles during vehicle acceleration and regenerative braking. Future extensions should include electrochemical–thermal coupling and dynamic drive cycles. Moreover, the optimization in this study was performed by a one-factor-at-a-time approach; a multi-objective optimization coupled with machine-learning surrogates could further improve the energy efficiency and temperature uniformity of the traction battery thermal management system. The proposed design can be further developed using topology-optimized channels, adaptive flow control, and intelligent phase-change-material selection to accommodate even higher energy-density traction batteries.
In summary, the research demonstrates that microchannel liquid cooling combined with composite PCM offers a robust and feasible route for achieving high-performance thermal management of traction batteries across a wide range of ambient temperatures. The integrated BTMS solves the critical challenges of excessive temperature rise, low-temperature capacity loss, and undesirable thermal gradients in the same geometric package, which is of great value for the next-generation electric vehicles equipped with high-capacity traction batteries.