
Charging an electric vehicle battery pack during hot summer conditions remains one of the most visible and most complained-about limitations of modern electrified mobility. Users expect a charging event to be short, predictable, and safe, yet the same high ambient temperature that accelerates degradation also pushes the cells toward their thermal limits. In my work I treat this conflict as a coupled control problem rather than two separate engineering tasks: the current profile that the electric vehicle battery pack is allowed to follow must be continuously renegotiated with the amount of heat that the liquid cooling system can remove at that instant. The central idea I develop and validate here is a temperature-and-state-of-charge-dependent fast charging strategy that is executed together with an explicitly designed refrigerant-side cooling strategy, so that the electric vehicle battery pack exploits the full charging capability of its cells at low state of charge while remaining thermally protected at high temperature and high state of charge.
Lithium-ion power cells are widely deployed in electrified vehicles because of their long cycle life, high energy density, and acceptable wide-temperature adaptability. Nevertheless, the charging time of an electric vehicle battery pack under high ambient temperature is still perceived as excessive. Battery swapping can hide the waiting time from the driver, but a swap-compatible pack must match a dedicated swap station architecture and therefore cannot be generalized. As a consequence, current development of the electric vehicle battery pack concentrates on shortening the charging event by raising the charging rate. Peak charging rates above 3 C are common in fast-charging operation and can reach 6 C, while the average rate over the whole event usually exceeds 1 C. At such rates the cell temperature rises quickly, and a high ambient temperature makes the situation considerably worse, since the driving temperature difference available for heat rejection is reduced and the risk of thermal runaway increases. A dedicated fast charging and cooling strategy is therefore required to improve the performance of the electric vehicle battery pack without sacrificing safety.
Thermal management of the electric vehicle battery pack during fast charging relies on a cooling strategy that removes heat and keeps every cell inside a favorable operating window. For lithium iron phosphate cells this window is usually quoted as 20–45 °C. Commercially available thermal management architectures fall into three families: air cooling, liquid cooling, and direct refrigerant cooling. Air cooling is subdivided into natural and forced convection and is mainly used for low-current charging packs. Liquid cooling circulates a cold coolant through a cold plate and removes the cell heat within a short time. Direct refrigerant cooling injects refrigerant straight into the cold plate and provides extremely high cooling efficiency. Reported studies show that forced air cooling can reduce the maximum cell temperature by roughly 20 °C relative to natural convection under a 3 C fast charge, reaching about 37.7 °C, whereas liquid cooling performs clearly better with a maximum temperature near 30.2 °C. Staggered, counter-flow liquid cooling tube arrangements have been reported to hold the maximum temperature at about 35.96 °C for a large cylindrical cell under 4 C charging at 45 °C ambient. Direct cooling with finned cold plates has been shown to lower the maximum temperature from 49.8 °C to 40.9 °C and to reduce the temperature difference by roughly 69.7% under aggressive dynamic profiles. In practice, however, direct cooling suffers from coupled refrigerant regulation and pressure-drop control, and the two-phase boiling and condensation processes are difficult to stabilize. For these reasons I base my study on a mature, commercially available liquid cooling architecture and focus on the charging and cooling logic layered on top of it.
Fast charging strategies mainly shorten the charging event by raising the charging rate. Constant-current constant-voltage charging is still the most widely applied method: a large constant current is applied until the voltage limit is reached, after which the current is stepped down to hold the voltage constant until full capacity. Multi-stage constant-current adaptive strategies are an optimization of this idea and co-optimize the current against state of charge, temperature, and voltage. A maximum non-lithium-plating strategy that steps the current down according to cell temperature and state of charge has been reported to reduce the charging time by 1 690 s compared with constant-current constant-voltage charging, but the maximum cell temperature reached 52.7 °C. In general, raising the charging rate at high ambient temperature consumes cyclable lithium and accelerates growth of the solid electrolyte interphase, which in turn increases the internal resistance and drives the cell into overtemperature. Asymmetric temperature modulation, in which the charging time at high temperature is deliberately shortened and the discharge temperature is strictly controlled, has been shown to keep capacity loss below 20% after 1 700 cycles. Artificial-intelligence-based charging policies, typically combining genetic algorithms with neural networks, are a very active research direction, but they require large training datasets and are not yet mature for a specific single vehicle model. In this study I therefore avoid data-hungry methods and instead construct a physically transparent, rule-based strategy that can be calibrated with a modest number of pulse tests.
In the work reported here I propose, implement, and experimentally validate a fast charging strategy that modulates the charging current of an electric vehicle battery pack as a joint function of cell state of charge and cell temperature, with the explicit goal of extracting the maximum charging capability of the cells. The workflow I follow consists of four steps. First, I obtain the thermal and electrical parameters of the power cells through hybrid pulse power characterization testing and build a cell heat generation model. Second, I implement the proposed fast charging strategy and the cooling strategy and run numerical simulations of the charging event of the electric vehicle battery pack. Third, I study how the coolant inlet flow rate and the coolant inlet temperature affect charging performance, and I impose an additional charging-rate restriction in the high-temperature region. Finally, I validate the model against a dedicated charging experiment performed on a physical electric vehicle battery pack. The remainder of this article presents the physical model, the governing equations, the heat generation calculation, the numerical method, the charging and cooling logic, the parametric results, and the experimental validation.
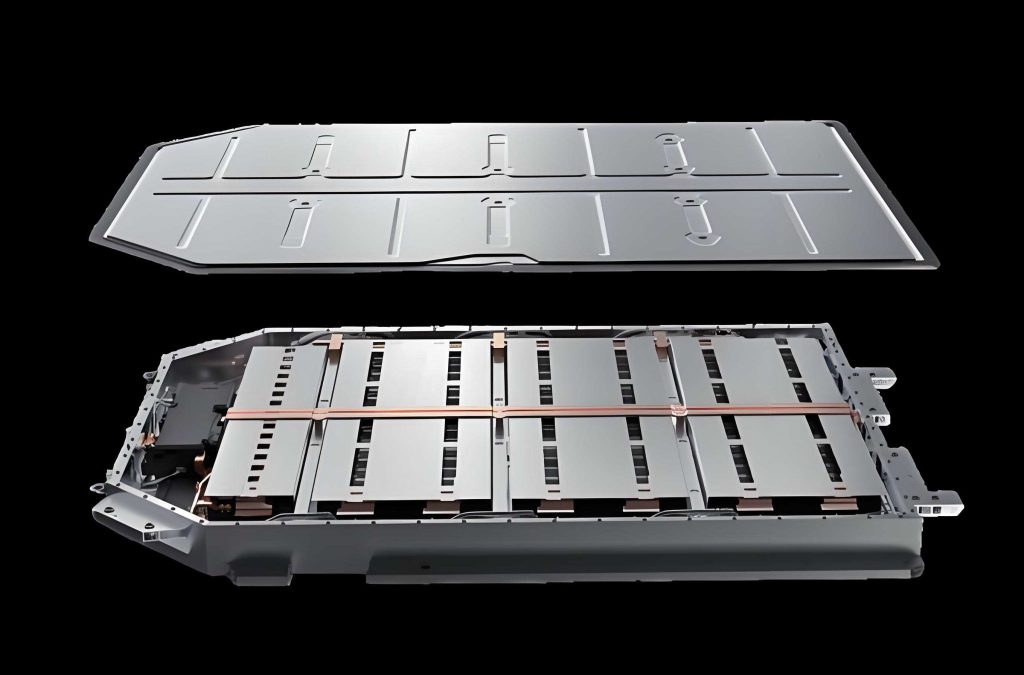
The simplified model of the electric vehicle battery pack that I use for the numerical study is composed of an upper enclosure cover, three modules, a liquid cooling plate, piping, and a lower enclosure. The outer envelope of the pack measures 1 365 mm × 1 165 mm × 145 mm. The cold plate consists of an upper plate 1 mm thick and a channel plate 1.2 mm thick; the channel depth is 4 mm and the maximum channel width is 28 mm. The electrical architecture is 1P108S: 108 cells are connected in series and grouped into three large 1P36S modules before being installed in the enclosure. Thermal insulation sheets are placed between adjacent cells to block internal heat transfer during charging and to prevent thermal propagation in the unlikely event of a thermal runaway. To avoid short circuits, one insulation sheet is placed at each end plate of every module. Heat exchange between the coolant and the modules is realized through the cold plate, and a thermally conductive pad beneath each module improves the heat transfer efficiency. The thermal physical parameters of the pack structure are summarized in Table 1.
| Structure | Material | Density / (kg/m³) | Specific heat / [J/(kg·K)] | Thermal conductivity / [W/(m·K)] |
|---|---|---|---|---|
| Upper cover | Steel | 7 800 | 480 | 58 |
| Thermal pad | Composite | 2 200 | 2 100 | 1.5 |
| Piping | Nylon | 1 030 | 1 800 | 0.16 |
| Cold plate | Aluminum | 2 730 | 893 | 167 |
| Sealing ring | Silicone | 360 | 920 | 0.07 |
| Lower enclosure | Aluminum | 2 730 | 893 | 167 |
| Side plate | Aluminum | 2 730 | 893 | 167 |
| Insulation pad | Silicone | 433 | 1 175 | 0.04 |
| Insulation sheet | PP+PET | 1 200 | 1 170 | 0.2 |
| End plate | Aluminum | 2 730 | 893 | 167 |
The cells used in this electric vehicle battery pack are lithium-ion cells with a rated capacity of 119 Ah. Their main parameters are listed in Table 2. The nominal voltage is 3.22 V, the mass is 2 045 g, and the cell dimensions are 44.1 mm × 195.0 mm × 114.8 mm. The allowable continuous charging current is 380 A. The operating temperature range is −35 to 60 °C for discharge and −20 to 55 °C for charge. The cell density is 2 165 kg/m³, the specific heat capacity is 966 J/(kg·K), and the directional thermal conductivities are 12.3, 3.2, and 10.1 W/(m·K) along the x, y, and z directions, respectively. With 108 cells in series, the nominal energy content of the electric vehicle battery pack is approximately 41.38 kWh, which is a representative size for a passenger electric vehicle.
| Parameter | Value | Remark |
|---|---|---|
| Rated capacity | 119 Ah | 25 °C at 1/3 C |
| Nominal voltage | 3.22 V | 25 °C at 1/3 C |
| Mass | 2 045 g | — |
| Operating temperature | Discharge: −35 to 60 °C; Charge: −20 to 55 °C | — |
| Maximum continuous charging current | 380 A | — |
| Dimensions | 44.1 mm × 195.0 mm × 114.8 mm | Thickness × width × height |
| Density | 2 165 kg/m³ | — |
| Specific heat capacity | 966 J/(kg·K) | — |
| Thermal conductivity | 12.3 / 3.2 / 10.1 W/(m·K) | x / y / z direction |
The assumptions I adopt for the coolant flow and for the thermal problem are the following. The thermal physical parameters of every structural component of the electric vehicle battery pack are constant during the charging event. Thermal radiation is neglected during cooling. The coolant is treated as an incompressible fluid. The working fluid is a 50% by mass ethylene glycol aqueous solution. Under these assumptions the momentum, energy, and continuity equations for the coolant are written as:
$$\rho_c (\vec{v}\cdot\nabla)\vec{v} + \nabla p = \mu \nabla^2 \vec{v}$$
$$\rho_c c_c (\vec{v}\cdot\nabla T_c) = k_c \nabla^2 T_c$$
$$\frac{\partial \rho_c}{\partial t} + \nabla\cdot(\rho_c \vec{v}) = 0$$
Here $\rho_c$ is the coolant density, $\vec{v}$ is the velocity vector, $p$ is the static pressure, $\mu$ is the dynamic viscosity, $c_c$ is the coolant specific heat capacity, $T_c$ is the coolant temperature, and $k_c$ is the coolant thermal conductivity. These three equations are solved together with the conjugate heat transfer problem in the solid parts of the electric vehicle battery pack, which include the cold plate, the thermally conductive pads, the module hardware, and the cells themselves.
During high-rate charging, electrochemical reactions inside the lithium-ion cell release heat continuously. The total heat generation is dominated by the irreversible Joule heat and by the reversible entropic heat. The cell heat generation rate is calculated as:
$$Q_{Li-ion} = I^2 R_{Li-ion} + I T_{Li-ion} \frac{\partial U_{ocv}}{\partial T_{Li-ion}}$$
where $Q_{Li-ion}$ is the heat generation rate of the lithium-ion cell, $I$ is the current, $R_{Li-ion}$ is the cell internal resistance, $T_{Li-ion}$ is the cell temperature, and $U_{ocv}$ is the open-circuit voltage. The first term, $I^2 R_{Li-ion}$, is the Joule heat produced by the internal resistance. The second term, $I T_{Li-ion} \partial U_{ocv}/\partial T_{Li-ion}$, is the entropic heat associated with the entropy change of the cell reaction. This expression makes clear that the two quantities that govern heat generation in the electric vehicle battery pack are the internal resistance and the open-circuit voltage, both of which are state-of-charge and temperature dependent. I therefore determine them experimentally rather than relying on datasheet values.
Hybrid pulse power characterization testing is used to extract the open-circuit voltage and to compute the internal resistance from the measured voltage response. The test focuses on the 10 s charge power and the 10 s discharge power. The experimental setup comprises a charge-discharge system rated at 1 000 V with a maximum charging power of 600 kW and a maximum continuous charging current of 600 A, a data acquisition unit, a high-low temperature chamber with a range of −60 to 80 °C and an accuracy of ±1 °C, a chiller with a maximum cooling capacity of 8.5 kW and an outlet coolant temperature range of 5–35 °C with an accuracy of ±1 °C, and a control computer. The charging-rate transitions of the electric vehicle battery pack are determined jointly by the state of charge and by the maximum measured temperature, and the state of charge is read directly from the battery management system. Because the pack contains 108 cells, it is not practical to instrument every single cell. I therefore select twelve cells located in the high-temperature and low-temperature regions of the pack and bond temperature sensors to their top surfaces, so that the extreme thermal behavior of the electric vehicle battery pack is captured with a manageable number of measurement channels.
The pulse test procedure I follow is summarized below.
| Step | Action | Condition |
|---|---|---|
| 1 | Discharge | Rest to 25 °C, then discharge at 1/3 C to a depth of discharge of 100% |
| 2 | Rest | Allow the cell to rest until it reaches the target test temperature |
| 3 | Constant-current pulse | 10 s charge pulse, 15 s rest, 10 s discharge pulse |
| 4 | Charge to next state of charge | Charge at 1/3 C to the next state-of-charge point, then repeat steps 2 and 3 |
| 5 | Termination | Charge at 1/3 C to a state of charge of 100% |
The open-circuit voltage curves were recorded at 20, 35, and 55 °C. During the pulse phase the voltage rises instantaneously from $V_a$ to $V_b$ when the charge pulse is applied, and reaches $V_c$ at the end of the charge pulse. The internal resistance is obtained from the voltage change over the charge pulse as:
$$R_{Li-ion} = \frac{V_c – V_a}{I}$$
This resistance, together with the measured open-circuit voltage and its temperature derivative, is inserted into the heat generation equation, so that the heat generation rate of each cell in the electric vehicle battery pack can be evaluated at every instant of the charging simulation. Because both the resistance and the open-circuit voltage are interpolated across the measured state-of-charge and temperature grid, the resulting heat generation model reproduces the strong dependence of the loss on the operating point instead of assuming a constant cell resistance.
To improve computational efficiency I discretize the electric vehicle battery pack with a polyhedral mesh. The minimum element length is 1 mm, the maximum element length is 8 mm, the growth rate is 1.2, and the maximum skewness angle is 15°. Two boundary layers are inserted in the fluid-solid coupling region, which improves the accuracy of the convective heat transfer solution. To reduce computational cost I use an iteration frequency of 8 s during the early transient and switch to 2 s once the solution becomes stable. All numerical calculations are transient. The baseline boundary conditions are a mass flow inlet with a flow rate of 12 L/min, a coolant inlet temperature of 22 °C, a pressure outlet at 0 Pa, and an ambient temperature of 40 °C. This ambient temperature represents a severe but realistic high-temperature charging scenario for an electric vehicle battery pack, and it is the condition under which the trade-off between charging rate and thermal protection is most visible.
The fast charging strategy I propose is based jointly on the state of charge and on the maximum cell temperature of the electric vehicle battery pack. The charging capability is expressed as a C-rate, which is convenient for formulating a strategy with large rate steps. The cells are charged at a constant rate within each state-of-charge and temperature interval, and the maximum charging rate is 3.2 C. In the low state-of-charge and low-temperature region the strategy aims to exploit the full charging capability of the cells. As the state of charge and the temperature increase, the internal resistance and the thermal stress grow, and continuing to charge at a large rate would create a risk of thermal runaway. I therefore impose an explicit rate restriction at 48 °C, where the charging rate is reduced from 2.1 C to 1.5 C. The reduction in the charging rate also lowers the heat generation of the cells at high state of charge, which helps to maintain a 0.5 C charge at the end of the event. The logical structure of the strategy is listed in Table 3.
| State-of-charge window | Cell temperature condition | Applied C-rate | Rationale |
|---|---|---|---|
| Low state of charge | Below 45 °C | 3.2 C | Exploit maximum cell charging capability |
| Low to moderate state of charge | 45–48 °C | 2.1 C | Reduce heat generation while preserving speed |
| Moderate state of charge | At or above 48 °C | 1.5 C | Thermal protection and reduction of thermal stress |
| High state of charge | Above 80% state of charge | 1.4 C | Limit lithium plating risk near full charge |
| End of charge | Approaching full capacity | 0.5 C | Ensure complete and safe saturation |
The cooling strategy is executed in parallel with the charging strategy. Because high-rate charging of the electric vehicle battery pack generates a large and continuous heat load, the cooling system switches on and off according to the measured battery temperature. The temperature thresholds in the cooling strategy are the key parameters that keep the pack inside a safe and efficient operating band. I adopt a commercially mature liquid cooling thermal management architecture, with the following switching logic. The liquid cooling system is switched on when the maximum cell temperature reaches or exceeds 38 °C. The liquid cooling system is switched off when the maximum cell temperature falls to or below 33 °C. This hysteresis band prevents short cycling of the chiller and the coolant pump, which would otherwise increase component wear and parasitic energy consumption in the electric vehicle battery pack.
The heat balance that governs the temperature of the electric vehicle battery pack during charging can be written in lumped form as:
$$\rho_p c_p V_p \frac{dT_p}{dt} = Q_{Li-ion} – \dot{m} c_c (T_{out} – T_{in}) – h A (T_p – T_{amb})$$
where $\rho_p$, $c_p$, and $V_p$ are the effective density, specific heat capacity, and volume of the pack, $T_p$ is the pack temperature, $\dot{m}$ is the coolant mass flow rate, $T_{out}$ and $T_{in}$ are the coolant outlet and inlet temperatures, $h$ is the effective convective coefficient between the pack surface and the ambient, $A$ is the external surface area, and $T_{amb}$ is the ambient temperature. At steady state the left-hand side vanishes and the coolant heat removal must balance the cell heat generation plus the ambient heat gain. This balance explains why the coolant inlet temperature and the coolant flow rate are the two dominant cooling-side levers for the electric vehicle battery pack, and it also explains why increasing the flow rate eventually saturates while lowering the inlet temperature continues to help.
I now discuss the numerical results of the fast charging event. The computed current, state of charge, and maximum temperature histories are summarized in Table 4. At the beginning of the event the electric vehicle battery pack is charged at the maximum rate of 3.2 C. When the maximum temperature exceeds 45 °C, which occurs at 103 s, the rate is reduced to 2.12 C. At that moment the state of charge is 9%, and the rate reduction is a purely thermal action. At 241 s the maximum cell temperature exceeds 48 °C and the rate is immediately reduced to 1.5 C. Between 241 s and 1 745 s the rate remains at 1.5 C. During this long 1.5 C segment the heat transfer capability of the thermal management system is stronger than the heat generation of the cells, and the maximum temperature of the electric vehicle battery pack is kept below 50 °C throughout. The complete fast charging event lasts 2 654 s.
| Event | Time / s | State of charge / % | Maximum temperature / °C | C-rate |
|---|---|---|---|---|
| Start of charge | 0 | 0 | 40.0 | 3.2 |
| First rate reduction | 103 | 9 | 45.0 | 2.12 |
| Thermal limit reached | 241 | — | 48.0 | 1.5 |
| Peak temperature | 201 (thermal transient) | — | 49.2 | 1.5 |
| High state-of-charge transition | 1 746 | 80 | Below 49.2 | 1.4 |
| End of charge | 2 654 | 100 | — | 0.5 |
The temperature and state-of-charge evolution during a full charge reveals the internal structure of the event. The electric vehicle battery pack starts at the maximum rate of 3.2 C, and the maximum temperature reaches 45.0 °C at 103 s. During the 3.2 C constant-rate segment the average heat generation of a cell is 119.23 W. In this interval the liquid cooling system cannot remove all of the generated heat, and the temperature rise rate of the pack reaches 2.9 °C/min. The maximum temperature reaches 48.0 °C at 241 s, after which the charging rate jumps to 1.5 C. At this point the cell heat generation drops to 34.67 W, and the cooling system is able to fully absorb it. Because the pack temperature still carries a rising trend, the maximum temperature reaches 49.2 °C a short time later, after which the temperature slowly decreases. When the state of charge reaches 80% at 1 746 s, the charging rate is reduced to 1.4 C. From this point the maximum temperature decreases more quickly, mainly because the heat generation of the cells has become smaller. This behavior confirms that the temperature-limited logic protects the electric vehicle battery pack without unnecessarily extending the charging event.
The temperature data recorded during the full charge show that the thermal management system of the electric vehicle battery pack remains active throughout the event. I therefore studied how the charging performance responds to changes in the cooling parameters, beginning with the coolant inlet flow rate. Increasing the inlet flow rate raises the coolant velocity inside the cold plate, which thins the thermal boundary layer at the wall, increases the convective heat transfer coefficient, and improves the heat rejection capability. I simulated a charging and cooling event with an inlet flow rate of 15 L/min and a coolant inlet temperature of 22 °C. The comparison with the baseline flow rate of 12 L/min is given in Table 5. When the inlet flow rate increases from 12 L/min to 15 L/min, the maximum temperature of the electric vehicle battery pack decreases by only 0.1 °C and the charging time decreases by only 6 s. The higher flow rate therefore does not meaningfully improve the maximum temperature or the charging duration. The reason is that at 12 L/min the cold plate is already operating near its optimal heat transfer condition, and a further increase in flow rate produces almost no gain in heat transfer capability. At the same time, the higher flow rate increases the system pressure drop, and the maximum pressure drop rises by about 43%, which directly increases the pumping power consumed by the electric vehicle battery pack cooling loop.
| Inlet flow rate / (L/min) | Coolant inlet temperature / °C | Maximum temperature / °C | Charging time / s | Maximum pressure drop change |
|---|---|---|---|---|
| 12 | 22 | 49.2 | 2 654 | Baseline |
| 15 | 22 | 49.1 | 2 648 | +43% |
| 12 | 20 | 48.9 | 2 613 | Baseline |
I then examined the influence of the coolant inlet temperature. According to Newton’s law of cooling, lowering the coolant inlet temperature increases the heat convection capability of the cold plate. I simulated a charging and cooling event with an inlet flow rate of 12 L/min and a coolant inlet temperature of 20 °C. The results are included in Table 5. The maximum temperature of the electric vehicle battery pack during charging is 48.9 °C, and the total charging time is 2 613 s. The reduction in charging time arises mainly because the duration of the high-temperature charging segment is shortened, which in turn increases the average charging rate of the event. However, the lower the coolant temperature, the larger the compressor refrigeration power, and the energy consumption of the system increases. From an energy consumption perspective, the reduction in charging time does not by itself constitute an advantage, because the additional refrigeration work may exceed the value of the time saved. Overall, changing the coolant temperature does not significantly improve the maximum temperature or the temperature difference of the electric vehicle battery pack, and the flow rate and coolant temperature should therefore be selected as a compromise between thermal performance and system energy consumption.
To assess the sensitivity of the results more systematically, I summarize the heat generation and thermal response of the electric vehicle battery pack in Table 6. The table lists the average cell heat generation, the pack temperature rise rate, and the maximum temperature observed in each charging-rate segment. The contrast between the 3.2 C segment and the 1.5 C segment is striking: the heat generation falls by roughly a factor of 3.4, while the temperature rise rate falls from 2.9 °C/min to a value at which the cooling system can hold the maximum temperature nearly constant. This is the quantitative justification for the staged rate reduction in my strategy. It also shows that the thermal benefit of reducing the charging rate is strongly nonlinear, which is why a single global rate limit would either be too conservative at low state of charge or insufficient at high state of charge.
| Charging segment | Average cell heat generation / W | Pack temperature rise rate / (°C/min) | Maximum temperature / °C | Cooling system status |
|---|---|---|---|---|
| 3.2 C, low state of charge | 119.23 | 2.9 | 45.0 at 103 s | Active, partial heat removal |
| 2.12 C, transition | Intermediate | Falling | 48.0 at 241 s | Active, approaching balance |
| 1.5 C, moderate state of charge | 34.67 | Near zero, then negative | 49.2 peak | Active, full heat removal |
| 1.4 C, high state of charge | Below 34.67 | Negative | Decreasing | Active, full heat removal |
| 0.5 C, end of charge | Low | Negative | Decreasing | Intermittent |
The temperature difference across the electric vehicle battery pack is as important as the maximum temperature, because a large spatial gradient accelerates local aging and reduces the usable capacity of the pack. In my simulation the high-temperature region is concentrated around the cells that sit closest to the outlet of the cold plate and in the central region of the modules, while the low-temperature region is located near the inlet and along the perimeter of the modules. The insulation sheets placed between adjacent cells limit internal heat transfer and therefore help to suppress the spread of heat from the hot core toward the colder cells. The thermally conductive pads beneath the modules ensure that the heat generated in the cells is conducted efficiently into the cold plate rather than accumulating in the module hardware. The maximum temperature difference predicted by the model remains within a narrow band throughout the event, which is consistent with the design intent of the liquid cooling architecture.
I validated the numerical model with a dedicated charging experiment on a physical electric vehicle battery pack. The experimental hardware is the same charge-discharge system, data acquisition unit, high-low temperature chamber, and chiller described above. The electric vehicle battery pack was charged to full capacity at an ambient temperature of 40 °C following the proposed charging strategy, and the temperature data from all installed sensors were recorded. The procedure was as follows. The pack was connected to the charge-discharge system and to the data acquisition unit, and correct data recording was confirmed. The temperature chamber was set to 25 °C. The pack was allowed to rest until it reached 25 °C and was then discharged at 0.33 C to a state of charge of 0%. The temperature chamber was then set to 40 °C and the pack was allowed to rest until it reached 40 °C, after which it was charged to full capacity following the proposed strategy. During charging, the coolant inlet temperature, the current, the state of charge, and the temperature sensor readings were recorded.
The comparison between the measured and simulated temperatures in the high-temperature and low-temperature regions shows that the two datasets follow the same overall trend. Under the high-rate charging condition the temperature first rises rapidly, then fluctuates in a relatively stable manner while the cell heat generation and the cooling capability are comparable, and finally decreases slowly at the end of the event. Both the experiment and the simulation identify the high-temperature region around the same sensor locations and the low-temperature region around the same set of locations. The accuracy of the model is summarized in Table 7. The error in the maximum temperature is 0.4%, and the error in the maximum temperature difference is 5%, both of which are within the 5% target. The charging time differs by 77 s. During the experiment the charging-rate transitions of the electric vehicle battery pack were set manually, which introduces a certain time loss, so the actual charging time is somewhat longer than the simulated value. Taking these factors into account, I conclude that the numerical model of the electric vehicle battery pack is accurate and usable for the purpose of strategy development.
| Validation metric | Experimental value | Simulated value | Deviation |
|---|---|---|---|
| Maximum temperature | Measured by sensors | 49.2 °C | 0.4% |
| Maximum temperature difference | Measured by sensors | Predicted by model | 5% |
| Charging time | Longer than simulation | 2 654 s | 77 s |
The experimental campaign also confirmed several practical aspects of operating an electric vehicle battery pack under high ambient temperature. First, the sensor locations chosen in the hot and cold regions are sufficient to capture the extremes of the pack, which means that a limited instrumentation set can be used for control without losing the critical information. Second, the hysteresis in the cooling strategy prevents the chiller from switching on and off rapidly, which would otherwise create temperature oscillations and additional wear in the coolant loop of the electric vehicle battery pack. Third, the manual rate transitions used during the experiment introduced a measurable delay, which indicates that an automated implementation of the strategy on the battery management system would recover part of the lost time and would also improve the repeatability of the charging event.
Several limitations of the present study should be acknowledged. The thermal physical properties of the pack structure were treated as constant, whereas in reality the properties of the thermal pad and the insulation materials may vary with temperature and with compression. Thermal radiation was neglected, which is reasonable at the temperatures considered here but would become less accurate if the pack surface temperature were much higher. The coolant was treated as incompressible, which is appropriate for a 50% ethylene glycol aqueous solution over the relevant temperature range. The cell heat generation model uses resistance and open-circuit voltage data obtained from pulse tests at three temperatures, and interpolation between these temperatures introduces a small uncertainty at intermediate temperatures. Finally, the validation was performed on a single pack with a limited number of sensors, and a larger experimental campaign would be needed to characterize unit-to-unit variability of the electric vehicle battery pack.
The main findings of this work can be summarized as follows. A fast charging strategy that modulates the current of an electric vehicle battery pack jointly with state of charge and cell temperature, combined with a liquid cooling strategy that switches on at 38 °C and off at 33 °C, keeps the maximum cell temperature below 50 °C during the entire charging event. With the rate restriction imposed at 48 °C, the maximum temperature of the electric vehicle battery pack is 49.2 °C and the full charging event lasts 2 654 s, which brings the charging time of a 41.38 kWh pack within 45 min. Increasing the coolant inlet flow rate improves the heat transfer capability of the cold plate only until the plate reaches its optimal condition; beyond that point, additional flow produces negligible thermal benefit while increasing the pressure drop by about 43%. Lowering the coolant inlet temperature from 22 °C to 20 °C reduces the charging time by about 1.5% but increases the refrigeration power of the system, and it does not significantly improve the maximum temperature or the temperature difference. Changing the coolant temperature therefore does not offer a favorable trade-off for the electric vehicle battery pack studied here. The numerical model was validated against a pack charging experiment at 40 °C ambient, with errors in the maximum temperature and the maximum temperature difference both within 5%.
| Quantity | Symbol | Unit |
|---|---|---|
| Coolant density | $\rho_c$ | kg/m³ |
| Velocity vector | $\vec{v}$ | m/s |
| Static pressure | $p$ | Pa |
| Dynamic viscosity | $\mu$ | Pa·s |
| Coolant specific heat capacity | $c_c$ | J/(kg·K) |
| Coolant temperature | $T_c$ | °C |
| Coolant thermal conductivity | $k_c$ | W/(m·K) |
| Lithium-ion cell heat generation | $Q_{Li-ion}$ | W |
| Current | $I$ | A |
| Lithium-ion cell temperature | $T_{Li-ion}$ | °C |
| Lithium-ion cell internal resistance | $R_{Li-ion}$ | $\Omega$ |
| Open-circuit voltage | $U_{ocv}$ | V |
| Pack effective density | $\rho_p$ | kg/m³ |
| Pack effective specific heat capacity | $c_p$ | J/(kg·K) |
| Pack volume | $V_p$ | m³ |
| Pack temperature | $T_p$ | °C |
| Coolant mass flow rate | $\dot{m}$ | kg/s |
| Coolant outlet temperature | $T_{out}$ | °C |
| Coolant inlet temperature | $T_{in}$ | °C |
| Effective convective coefficient | $h$ | W/(m²·K) |
| External surface area | $A$ | m² |
| Ambient temperature | $T_{amb}$ | °C |
From an engineering standpoint, the results of this study indicate that the thermal protection of an electric vehicle battery pack during fast charging at high ambient temperature is best achieved by coordinating the current profile with the cooling capability rather than by maximizing either one independently. The strategy I developed is simple enough to be implemented on a conventional battery management system, because it requires only the state of charge and the maximum measured cell temperature, both of which are already available in a production electric vehicle battery pack. The liquid cooling parameters that I recommend, namely a coolant flow rate of 12 L/min and a coolant inlet temperature of 22 °C, represent the point at which the cold plate reaches its best heat transfer efficiency without excessive pressure drop, and they therefore provide the most favorable balance between charging speed, thermal safety, and system energy consumption for the electric vehicle battery pack considered in this work. Future work should extend the approach to pack-level state-of-health estimation so that the rate limits can be adapted as the cells age, and should evaluate the strategy over repeated fast charging cycles to confirm that the reduced high-temperature dwell time translates into a measurable cycle-life benefit.