
As the global energy transition continues to accelerate, electric vehicles have become a central carrier for sustainable development in the transport sector. The power battery is the core component of the vehicle, and its performance directly determines driving safety, operational reliability and service life. Among the various lithium-ion chemistries available today, ternary batteries offer higher energy density, whereas lithium iron phosphate batteries stand out for their superior thermal stability and intrinsic safety, which is why the latter has been widely adopted in the commercial vehicle segment where safety requirements are especially stringent.
In real-world operation, the charging rate and the ambient temperature are the two most influential factors acting on power battery performance. The charging rate directly governs charging speed: a higher rate delivers more energy per unit of time and shortens the charging session, but an excessive current can overheat the power battery, accelerate capacity fade and even trigger thermal runaway. A rate that is too low, on the other hand, cannot satisfy the fast replenishment needs of commercial fleets. Temperature is equally decisive. At low temperatures the electrolyte becomes more viscous and ionic conductivity falls sharply, producing abrupt capacity loss and charging difficulties; at high temperatures side reactions intensify, active material degrades and cycle life is shortened.
Although previous work has examined these factors separately, most existing studies focus on a single variable and lack a systematic, quantitative evaluation of key performance indicators under multi-factor interaction. The gap is particularly pronounced for large-capacity lithium iron phosphate power battery packs used in buses and coaches. To close that gap, a dedicated experimental programme has now been carried out on energy-type lithium iron phosphate power battery packs, covering charging rates from 0.3 C to 1.5 C and ambient temperatures from −30 °C to 45 °C, with capacity, energy, efficiency, temperature rise and consistency analysed quantitatively. The findings define the optimal charging window and the most suitable operating temperature range, and provide data support for vehicle-level battery compartment thermal management design and charging strategy optimisation.
- Test Samples, Equipment and Methodology for the Charging-Rate Study
- Test Samples, Equipment and Methodology for the Temperature Study
- Charging-Rate Results: Capacity, Energy and Efficiency Behaviour
- Thermal Behaviour of the Power Battery During High-Rate Charging
- Temperature Results: Capacity and Energy Across the −30 °C to 45 °C Range
- Temperature Effects on Voltage and Thermal Consistency of the Power Battery Pack
- Conclusions and Implications for Charging Strategy and Thermal Management
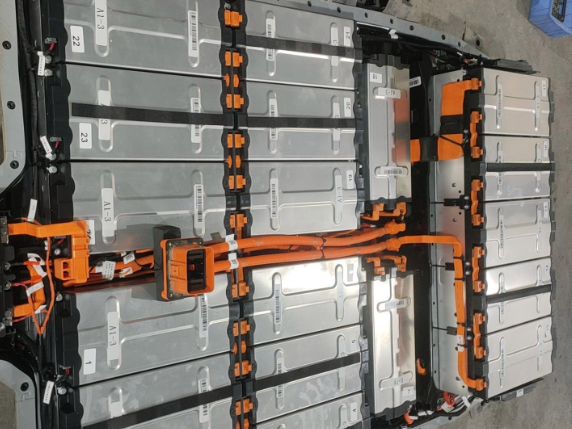
Two lithium iron phosphate power battery packs produced by two well-known domestic manufacturers were selected as the test objects, each rated at 25.6 kWh and 100 Ah, and labelled Sample 1 and Sample 2 respectively. Testing was performed on an electronic load test bench (model FTF1-600-800BS) together with a walk-in humidity and heat environmental test chamber (model THVS5019F). The main parameters and accuracy of the two devices are summarised in the table below.
| Equipment | Parameter | Range | Accuracy |
|---|---|---|---|
| Electronic load test bench | Voltage | 58–800 V | ±0.1% Fs |
| Electronic load test bench | Current | 0–600 A | ±0.1% Fs |
| Electronic load test bench | Power | 0–250 kW | — |
| Walk-in humidity and heat environmental test chamber | Temperature | −60–150 °C | ±2 °C |
| Walk-in humidity and heat environmental test chamber | Heating rate | 3 °C/min | — |
| Walk-in humidity and heat environmental test chamber | Cooling rate | 2 °C/min | — |
All charging-rate tests were conducted inside the walk-in environmental chamber with the ambient temperature held at 25 °C ± 2 °C. In accordance with GB/T 31467–2023 and established industry practice, six charging rates were selected: 0.3 C, 0.5 C, 0.75 C, 1 C, 1.2 C and 1.5 C. Every test used the standard 1 C discharge rate specified in the same standard so that the test conditions remained comparable, and a standard cycle was executed before each measurement to unify the initial state of the power battery. The full 0%–100% state-of-charge window was covered, which encompasses the 20%–80% state-of-charge band most frequently used in real vehicle operation, so the conclusions carry direct practical value for charging strategy optimisation.
Testing was driven by the battery test equipment and its supporting software: the Program editor package was used to write the test profiles, while the Visual CN package controlled the equipment and acquired the data, recording voltage, current, capacity, energy, charge and discharge duration and temperature. The charge cut-off voltage was set at 3.65 V and the discharge cut-off voltage at 2.5 V. Energy efficiency was calculated as the ratio of discharge energy to charge energy multiplied by 100%.
| Step | Test action | Temperature |
|---|---|---|
| 1 | Environmental accommodation | 25 ± 2 °C |
| 2 | Standard charge | 25 ± 2 °C |
| 3 | Standard discharge | 25 ± 2 °C |
| 4 | Charge at the selected rate | 25 ± 2 °C |
| 5 | Environmental accommodation | 25 ± 2 °C |
| 6 | 1 C discharge | 25 ± 2 °C |
For the temperature investigation, two lithium iron phosphate power battery packs of the same model from a single manufacturer were used, each rated at 25.6 kWh and 277 Ah. The test equipment was identical to that employed in the charging-rate study. Because ambient temperature has a pronounced effect on lithium iron phosphate power battery behaviour, all temperature tests were carried out inside the walk-in humidity and heat environmental test chamber.
The charging procedure and ambient temperature were defined as follows: the chamber was set to 25 °C, the pack was charged at a constant current of 0.5 C up to the cut-off voltage, rested for 10 minutes, and then topped up at a constant current of 0.05 C to the same cut-off voltage. The discharge procedure was defined as a constant-current discharge at 1 C, with the chamber temperature stepped from −30 °C to 45 °C in 5 °C increments. After each discharge test, the power battery was returned to a fully charged state using the charging procedure described above. Data acquisition followed the same scheme as the charging-rate study, and energy efficiency was again calculated from the ratio of discharge energy to charge energy.
| Step | Test action | Temperature |
|---|---|---|
| 1 | Environmental accommodation | 25 ± 2 °C |
| 2 | Standard charge | 25 ± 2 °C |
| 3 | Standard cycle | 25 ± 2 °C |
| 4 | Environmental accommodation | Target temperature point |
| 5 | Standard discharge | Target temperature point |
The measured results for Sample 1 and Sample 2 across the six charging rates are listed in the two tables below. The full-cycle charge and discharge duration reflects the time cost of a complete cycle and therefore has a direct bearing on charging wait times and fleet dispatch efficiency; it is an important practical indicator when evaluating the usability of a charging strategy for a power battery system.
| Charging rate (C) | Charge capacity (Ah) | Discharge capacity (Ah) | Charge energy (kWh) | Discharge energy (kWh) | Energy efficiency (%) | Charge time (min) | Discharge time (min) | Full-cycle time (min) |
|---|---|---|---|---|---|---|---|---|
| 0.30 | 95.4 | 94.9 | 25.4 | 24.1 | 94.7 | 172.3 | 57.0 | 229.3 |
| 0.50 | 94.9 | 94.7 | 25.5 | 24.0 | 94.4 | 114.0 | 56.8 | 170.8 |
| 0.75 | 94.7 | 94.4 | 25.6 | 24.0 | 93.9 | 75.8 | 56.7 | 132.5 |
| 1.00 | 94.2 | 94.4 | 25.6 | 24.0 | 94.0 | 56.5 | 56.7 | 113.3 |
| 1.20 | 90.7 | 90.9 | 24.8 | 23.2 | 93.4 | 45.2 | 54.3 | 99.5 |
| 1.50 | 90.3 | 89.9 | 24.8 | 22.9 | 92.3 | 36.0 | 54.0 | 90.0 |
| Charging rate (C) | Charge capacity (Ah) | Discharge capacity (Ah) | Charge energy (kWh) | Discharge energy (kWh) | Energy efficiency (%) | Charge time (min) | Discharge time (min) | Full-cycle time (min) |
|---|---|---|---|---|---|---|---|---|
| 0.30 | 94.9 | 94.2 | 26.5 | 24.1 | 95.6 | 177.9 | 58.7 | 236.6 |
| 0.50 | 94.6 | 93.8 | 26.5 | 24.0 | 95.4 | 116.2 | 58.1 | 174.4 |
| 0.75 | 94.6 | 94.5 | 26.2 | 24.9 | 95.3 | 78.2 | 57.9 | 136.1 |
| 1.00 | 93.9 | 93.7 | 26.6 | 25.1 | 94.3 | 55.6 | 56.4 | 112.0 |
| 1.20 | 91.1 | 90.6 | 25.2 | 23.6 | 93.5 | 48.2 | 52.6 | 100.8 |
| 1.50 | 90.0 | 88.4 | 25.4 | 23.6 | 92.6 | 32.0 | 51.2 | 83.3 |
Three clear regularities emerge from the data. First, charge capacity decreases steadily as the charging rate rises. Between 0.3 C and 1 C the change is gentle for both samples, but between 1 C and 1.2 C the capacity drops sharply, indicating that the power battery begins to suffer noticeable polarisation loss once the rate passes a threshold close to 1 C. Second, charge time falls as the rate increases and the relationship is approximately inverse. At 1.5 C the charge time is the shortest in the entire matrix, being roughly 79.1% shorter than at 0.3 C for Sample 1 and roughly 82.0% shorter for Sample 2.
Third, energy efficiency declines with increasing charging rate. The decline is slow in the 0.3 C to 0.75 C range, where the values remain close to the low-rate baseline, and then steepens noticeably between 1 C and 1.5 C. This behaviour is consistent with the capacity trend and reinforces the conclusion that the polarisation penalty on a power battery grows disproportionately once the rate exceeds about 1 C.
Two temperature sensors were installed on each of the two samples, one at the centre of the respective module and one at its edge, so that both the absolute temperature rise and the internal temperature gradient could be captured across the charging rates. Three observations can be drawn from the recorded curves.
The higher the charging rate, the greater the rate of temperature rise, with the 1.5 C case producing the steepest ramp of all. Even so, the maximum temperature recorded during any test remained below 40 °C, and the temperature difference between the two measurement points stayed within 2 °C. Both results comfortably satisfy the working requirements for a traction power battery pack, which specify a maximum temperature of no more than 55 °C and an internal temperature difference of no more than 5 °C. In other words, the thermal margin of the tested lithium iron phosphate power battery is adequate across the whole 0.3 C to 1.5 C envelope at 25 °C, and thermal stress alone does not explain the capacity and efficiency losses observed beyond 1 C — those losses are electrochemical in origin.
The temperature sweep results for the power battery packs are presented in the table below, covering charge capacity, discharge capacity, charge energy and discharge energy at every 5 °C step from −30 °C to 45 °C.
| Discharge temperature (°C) | Charge capacity (Ah) | Discharge capacity (Ah) | Charge energy (kWh) | Discharge energy (kWh) |
|---|---|---|---|---|
| −30 | 253.72 | 0.11 | 56.742 | 0.019 |
| −25 | 254.94 | 253.45 | 57.057 | 48.608 |
| −20 | 259.69 | 254.70 | 58.040 | 49.334 |
| −15 | 261.31 | 259.68 | 58.408 | 50.639 |
| −10 | 261.86 | 261.37 | 58.554 | 51.547 |
| −5 | 264.79 | 262.65 | 59.172 | 52.271 |
| 0 | 268.56 | 267.86 | 60.020 | 53.588 |
| 5 | 270.33 | 263.75 | 60.485 | 53.438 |
| 10 | 269.88 | 267.88 | 60.297 | 54.579 |
| 15 | 272.75 | 269.61 | 60.889 | 55.239 |
| 20 | 270.20 | 270.53 | 60.355 | 55.699 |
| 25 | 265.68 | 269.74 | 59.002 | 55.736 |
| 30 | 258.65 | 258.72 | 0.405 | 53.833 |
| 35 | 259.33 | 259.91 | 57.917 | 54.210 |
| 40 | 259.95 | 259.97 | 58.069 | 54.333 |
| 45 | 260.29 | 170.81 | 58.174 | 35.989 |
Four findings stand out. At −30 °C the power battery is effectively unable to discharge, delivering only 0.11 Ah and 0.019 kWh; the electrolyte solidifies and ionic conduction is blocked. At 45 °C the pack releases only about half of its nominal capacity, recording 170.81 Ah and 35.989 kWh; the elevated temperature accelerates internal side reactions and readily drives the pack towards a first-level alarm condition, at which the chemical balance is disturbed, side reactions occur at the positive electrode and part of the change becomes irreversible, potentially causing permanent damage to the power battery.
Between 20 °C and 25 °C both capacity and energy reach their highest levels, marking this band as the optimal operating window for the power battery. At 30 °C a discontinuity appears in the capacity and energy values, which is attributed to a change in the internal reaction mechanism; comparable behaviour has been reported elsewhere in simulation work, where growth of the solid electrolyte interphase film was identified as a significant contributor to power battery performance variation.
Drawing on the performance observed at each temperature point, four representative conditions were selected for a deeper consistency analysis: 40 °C for the high-temperature case, 25 °C for the room-temperature case, −5 °C for the low-temperature threshold and −25 °C for the severe low-temperature case. At each of these points the pack-level temperature difference and voltage difference were tracked across the discharge.
On the thermal side, the temperature difference fluctuated least at 25 °C and most at −25 °C, showing that a low-temperature environment exerts a stronger influence on the temperature uniformity of the power battery pack. On the voltage side, the voltage difference again showed the narrowest fluctuation band at 25 °C, and the rise in voltage difference towards the end of discharge remained limited, giving the best consistency of all four conditions. At −5 °C, −25 °C and 40 °C the voltage difference widened markedly in the final stage of discharge, indicating that both low and high temperatures degrade the balancing behaviour of the pack.
Taken together across the thermal and voltage dimensions, the power battery pack achieves its best consistency within the 10 °C to 30 °C band, while temperatures below or above that band cause a clear deterioration. This result carries direct implications for battery compartment thermal management: maintaining the pack inside a moderate band, rather than merely avoiding extremes, is what preserves cell-to-cell balance and therefore usable capacity over the life of the power battery.
The experimental programme reveals non-linear relationships between charging rate, temperature and the key performance indicators of lithium iron phosphate power battery systems. The principal conclusions are as follows.
| Factor | Observed behaviour | Practical implication |
|---|---|---|
| Charging rate below 1 C | Stable capacity, energy and efficiency; gentle degradation trends | Suitable for overnight or depot charging of the power battery |
| Charging rate above 1 C | Rapid loss of reversible capacity; efficiency falls faster; charge time continues to shorten | Use only when fast turnaround is essential |
| Charging rate at 1 C | Best balance of polarisation loss, chargeable capacity and temperature-rise control | Recommended default operating point for the power battery |
| −30 °C | Electrolyte solidifies; discharge effectively blocked | Pre-heating is mandatory before any load is applied |
| 20–25 °C | Peak capacity, energy and efficiency | Target band for battery compartment thermal management |
| 45 °C | Only about half of nominal capacity released; irreversible side reactions | Active cooling required to protect the power battery |
| 10–30 °C | Smallest temperature and voltage difference spread across the pack | Best consistency and longest balanced service life |
First, there is a distinct inflection point in the influence of charging rate on power battery performance. Below 1 C the behaviour is stable, whereas above 1 C the reversible capacity falls rapidly. A charging rate of 1 C therefore represents the best balance between polarisation loss and charging efficiency under the conditions tested. The same pattern was reproduced on packs from two different manufacturers, which suggests a degree of generality for the finding.
Second, the influence of temperature follows an overall pattern of low-temperature suppression, optimum behaviour at moderate temperature and degradation at high temperature. At −30 °C the electrolyte solidifies and ionic conduction is blocked. Between 20 °C and 25 °C capacity, energy and efficiency all reach their peak values, defining the optimal working band. At 45 °C high-temperature side reactions cause repeated rupture and regeneration of the solid electrolyte interphase film, producing irreversible capacity loss and performance degradation of the power battery.
In summary, the lithium iron phosphate power battery system delivers its best overall performance at a charging rate of 1 C and a temperature of 20 °C to 25 °C. These two numbers give fleet operators a straightforward rule for scheduling: fast charging above 1 C buys time at the cost of capacity and efficiency, while operating outside the moderate temperature band costs both usable energy and pack consistency. For vehicle designers, the results argue for a thermal management system sized to hold the power battery inside the 10 °C to 30 °C consistency window rather than merely to prevent overheating, and for a pre-conditioning capability strong enough to lift the pack out of the deep low-temperature regime before charging or discharging begins.
Further work is required. The sample base needs to be widened, the degradation mechanisms under extreme temperature conditions need to be investigated in greater depth, and long-term cycling tests should be carried out so that a more complete performance evolution model covering the full life cycle of the power battery can be established.