
A newly reported engineering study on T2 red copper lap-jointed busbars has outlined a nonlinear framework for controlling contact impedance in power battery packs under ultra-high-rate flash-charging conditions. Combining theoretical modeling, single-factor gradient tests, and an L16(4⁴) orthogonal test program, the research examines how plating process, bolt tightening torque, surface roughness, and structural dimensions interact to influence contact impedance and high-temperature stability. The findings identify plating as the dominant factor in impedance degradation, with an influence weight of 47.2%, and establish a 2.5 mm thickness threshold that separates two distinct structural optimization regimes for power battery busbars.
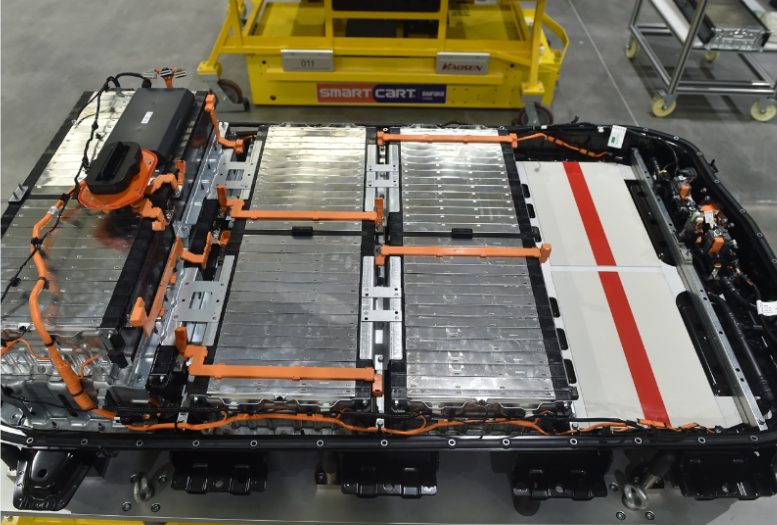
The study is positioned against a fast-moving industry backdrop. As electric vehicles move from 400 V platforms and 1C to 2C conventional fast charging toward 800 V architectures and 4C or higher flash charging, power battery systems are exposed to currents that can rise to 500–1000 A. The resulting Joule heating, high-temperature interfacial oxidation, and alternating mechanical loads place unprecedented stress on bolted lap joints. Because busbars are central current-carrying components in power battery modules, the stability of their contact impedance directly affects electrical transmission efficiency, temperature-field distribution, and full-life-cycle safety.
1. Power Battery Busbar Impedance Becomes a Flash-Charging Bottleneck
The engineering problem is cumulative rather than isolated. Under repeated ultra-high-rate flash charging, high current through a bolted joint can create local heat concentration. That heat accelerates oxidation and coating loss at the lap interface. As oxidation spreads, contact impedance rises, which in turn increases local temperature further. The cycle can lead to surface darkening, coating detachment, bolt preload relaxation, and sharp increases in contact resistance. In severe cases, electrical arcing may occur and contribute to thermal runaway risk in a power battery pack.
Despite these risks, many current design and manufacturing practices for power battery busbars still rely on traditional engineering experience and classical electrical contact theory. A common assumption is that the lap interface is fully mated, so the effective conductive area is treated as equal to the theoretical cross-sectional area. Contact impedance is then simplified as a single linear inverse function of thickness and width. This approach does not account for the mechanical deformation of lightweight thin copper plates. Under concentrated bolt clamping load, thin busbars can bend elastically, leaving edges suspended and reducing the effective contact area. The resulting gap between linear model predictions and actual test values is significant, especially for flash-charging power battery applications that require refined design.
The study identifies three main research gaps. First, existing models largely retain linear impedance assumptions and do not consider the bending and suspension effects of thin busbars after bolt tightening. They therefore cannot explain the non-monotonic optimization behavior of thickness and width observed in engineering practice. Second, mechanism studies often remain at the level of single-parameter macroscopic trends and do not define a structural stiffness critical threshold for copper busbars. Third, multi-parameter coupling systems are missing because most tests are single-variable analyses, leaving a lack of systematic quantification of factor weights. The reported work addresses these gaps with a stiffness-corrected nonlinear piecewise model, a quantified critical threshold, and a multi-parameter collaborative optimization framework for power battery busbars.
2. Theoretical Basis and Nonlinear Modeling Approach
2.1 From Classical Contact Theory to a Stiffness-Corrected Model
Classical Holm electrical contact theory separates total contact impedance into constriction resistance and film resistance. In a bolted metal lap joint, macroscopic surfaces appear smooth, but microscopically they contain many asperities. Under bolt clamping load, asperities deform plastically and form effective conductive contact spots. Current flowing through these small spots constricts, producing constriction resistance. At the same time, natural oxide films, coating passivation layers, processing residues, and insulating contaminants cover the interface and form film resistance. The total contact impedance is therefore expressed as the sum of constriction resistance and film resistance.
For a complete power battery busbar, the total conductive impedance is the sum of interfacial contact impedance and bulk resistance of the copper base material. Bulk resistance follows the classical resistance law and is positively related to resistivity and conduction length and negatively related to conductive cross-sectional area. Traditional engineering design assumes full interfacial contact and treats effective conductive area as the theoretical cross-sectional area, simplifying impedance as a linear inverse relationship with thickness and width. However, lightweight power battery busbars often use thin plates with low bending stiffness. Under bolt clamping, local bending and warping can cause edge suspension and a large reduction in effective contact area, making the linear model unsuitable for flash-charging power battery design.
To characterize the influence of plating type, bolt tightening torque, and surface roughness on the contact interface, the study introduces an interfacial contact parameter function. In this function, C represents the plating process parameter, with electroless nickel C = 1, electroplated nickel C = 2, tin plating C = 3, and silver plating C = 4. T represents bolt tightening torque in N·m, and Ra represents surface roughness in μm. The fitting method uses an L16(4⁴) orthogonal test dataset as the fitting sample. Qualitative plating variables are digitally encoded as dummy variables, while torque and roughness are normalized. With measured steady-state contact impedance as the target value, multiple nonlinear regression is solved iteratively by the least-squares method to obtain the optimal fitting coefficients of the coupling function f(C, T, Ra). After fitting, single-factor gradient test data are used for model verification, and the overall prediction error is controlled within 5%, meeting engineering calculation requirements. For structural parameter gradient tests, silver plating C = 4, tightening torque T = 15 N·m, and roughness Ra = 0.8 μm are used, so k is set to the fitted constant 185.6 μΩ·mm.
To overcome the inability of traditional linear models to support thin power battery busbar design, the study combines material mechanics bending stiffness theory with classical electrical contact theory. A stiffness correction coefficient is introduced to quantify the reduction in effective contact area caused by thin-plate bending deformation. A full-domain nonlinear total impedance model is then constructed for the full thickness range. The model is expressed as R_total(W, h) = k / [(1 − e^(−λh)) · W] + ρL / (Wh). In this expression, λ is an operating-condition correction constant in mm, used to correct interfacial contact attenuation under high-temperature and high-current conditions and to adapt to the thermal degradation coupling rules of flash charging. The optimal fitted value in the reported tests is 0.85 mm. ρ is the resistivity of the T2 copper base material in Ω·mm, reflecting the intrinsic conductive property of copper and varying slightly with temperature; it is fixed at 1.72 × 10⁻⁸ Ω·mm under standard room-temperature conditions at 25 °C and corrected to 2.28 × 10⁻⁸ Ω·mm at 125 °C. L is the effective current conduction length in mm, typically 30–120 mm for power battery busbars; the reported tests use a uniform value of 60 mm. W is the lap width in mm, directly determining the macroscopic conductive cross-section and balancing lightweight requirements with current-carrying needs; common flash-charging power battery busbars use 20–50 mm, and the gradient tests use 20 mm, 30 mm, 40 mm, and 50 mm. h is the base material thickness in mm, a core variable affecting bending stiffness and interfacial mating state; common thin copper busbars in the industry use 1.5–3.0 mm, and the gradient tests use 1.5 mm, 2.0 mm, 2.5 mm, and 3.0 mm.
In the model, the first term represents contact impedance under stiffness constraints, and the second term represents bulk impedance of the copper base material. Based on extreme-value solving and partial derivative analysis, the study divides copper busbar structural optimization into two characteristic regions. In the low-stiffness thin-plate region, thickness dominates interfacial mating quality, and increasing thickness can effectively eliminate suspension defects and substantially reduce contact impedance. In the high-stiffness thick-plate region, the interface is fully mated, contact impedance tends to saturate, the gain from increasing thickness is very low, and width dominates conductive cross-section and temperature-rise behavior. Through fitting multiple gradient datasets, the study defines 2.5 mm as the cost-effectiveness critical value for copper busbar structural optimization.
2.2 Experimental Design and Test Matrix
The experimental program uses mainstream T2 red copper busbars with copper purity of at least 99.9%. Electrical and mechanical properties meet the relevant industry standard for power battery electrical connections, and material consistency is maintained. Five gradient variables are set: plating process, bolt preload torque, surface roughness, base material thickness, and lap width. A single-variable test principle is followed. Before testing, all specimens are standardized: ultrasonic cleaning in anhydrous ethanol for 15 minutes to remove processing oil, dust, and light oxidation; then drying in a constant-temperature oven at 60 °C for 2 hours to ensure a uniform initial surface state. Coating thickness is controlled at 3–5 μm, and coating uniformity and adhesion meet industry standards to ensure process consistency.
All inspection and loading equipment are calibrated by a national metrology institution, and precision and stability meet academic test requirements. Core equipment includes a high-precision DC micro-resistance tester with a resolution of 0.01 μΩ for accurate measurement of small impedance values; a digital torque wrench with torque control accuracy of ±0.1 N·m for precise bolt preload control; a high-temperature constant-temperature aging chamber with temperature control accuracy of ±1 °C for simulating 125 °C aging; and a high-precision infrared thermal imager and high-power DC constant-current power supply for high-current temperature-rise tests. To reduce random error, each test group is repeated five times, abnormal data are removed, and the average is taken. The standard deviation of each group is also calculated to quantify data dispersion and reflect test repeatability and reliability.
The test plan includes room-temperature static impedance testing, 125 °C/1000 h high-temperature accelerated aging, and 500 A high-current steady-state temperature-rise testing, combined with an L16(4⁴) orthogonal test for multi-factor weight analysis. Room-temperature static impedance testing obtains the initial impedance distribution under each parameter gradient and clarifies the influence of a single parameter on initial contact performance. High-temperature accelerated aging simulates the full-life-cycle high-temperature service environment of a power battery pack and explores long-term degradation and stability differences under various parameter combinations. High-current steady-state temperature-rise testing simulates flash-charging high-current conditions and verifies thermal stability. Through multi-dimensional and multi-condition tests, the study systematically clarifies single-parameter influence rules and multi-parameter coupling mechanisms.
| Level | A: Plating process | B: Tightening torque (N·m) | C: Surface roughness Ra (μm) | D: Contact area (mm²) |
|---|---|---|---|---|
| 1 | Electroless nickel | 8 | 0.4 | 400 |
| 2 | Electroplated nickel | 10 | 0.8 | 600 |
| 3 | Tin plating | 12 | 1.6 | 800 |
| 4 | Silver plating | 15 | 3.2 | 1000 |
3. Test Results Reveal a Clear Hierarchy of Power Battery Busbar Factors
3.1 Plating Process Dominates High-Temperature Impedance Stability
Plating is the core protective and conductive medium at the copper busbar lap interface. Its material density, uniformity, and high-temperature oxidation resistance directly determine long-term service stability and regulate the degradation rate of interfacial film resistance. The study compares four mainstream coatings: electroless nickel, electroplated nickel, tin plating, and silver plating. The measured room-temperature initial impedance, impedance after 125 °C/1000 h aging, impedance growth rate, and standard deviation are summarized below.
| Coating process | Initial impedance (μΩ) | Initial standard deviation (μΩ) | Impedance after aging (μΩ) | Aged standard deviation (μΩ) | Impedance growth rate (%) |
|---|---|---|---|---|---|
| Electroless nickel | 128.6 | 1.21 | 342.9 | 2.03 | 166.6 |
| Electroplated nickel | 95.3 | 0.98 | 187.2 | 1.56 | 96.4 |
| Tin plating | 72.1 | 0.85 | 114.5 | 1.22 | 58.8 |
| Silver plating | 40.2 | 0.62 | 49.7 | 0.95 | 23.6 |
The standard deviations are small, supporting the credibility of the results. The four coatings show clear hierarchical differences in conductivity and long-term high-temperature stability. Electroless nickel has high microscopic porosity and poor structural density. At high temperature, oxygen can penetrate pores and react with the copper substrate, forming a high-resistance nickel-based oxidation passivation layer. As a result, interfacial film resistance rises sharply, with impedance increasing by 166.6% after 1000 h aging. The specimens show obvious darkening, blistering, and coating detachment. Electroplated nickel has slightly better structural density than electroless nickel, but its high-temperature oxidation resistance remains inadequate; long-term high-temperature service leads to continuous oxidative degradation, and impedance growth approaches 100%.
Tin plating is soft and ductile, allowing it to fill microscopic gaps at the copper interface during bolt clamping and substantially reduce initial contact impedance. It also offers good high-temperature oxidation resistance and cost advantages, with impedance growth controlled below 60%, balancing performance and economy. Silver plating offers the best conductivity, stable chemical properties, and strong high-temperature degradation resistance. After 1000 h aging, its impedance growth is only 23.6%, making it the optimal coating option for ultra-high-rate flash-charging power battery vehicles. The impedance curves also show that electroless nickel rises exponentially with aging time and fails fastest; electroplated nickel rises steadily and linearly with moderate long-term stability; tin and silver remain relatively flat with very small fluctuations and excellent long-term high-temperature stability.
3.2 Bolt Tightening Torque Shows Three-Stage Saturation Behavior
Bolt tightening torque directly determines preload pressure and microscopic contact state at the copper busbar lap interface. Its effect on contact impedance is not a single linear relationship but a staged saturation behavior. Too little torque leads to insufficient interfacial contact and higher contact resistance. Too much torque can damage the copper plate and cause thread fatigue. Identifying an optimal torque control range is therefore essential for reliable power battery busbar connections.
The results show a three-stage curve. In the low-torque range of 5–10 N·m, preload is insufficient, plastic deformation of microscopic metal contact points is incomplete, effective contact area is limited, and impedance falls rapidly with increasing torque, with an overall reduction of 38.9%. This range is highly sensitive to impedance optimization. In the 12–15 N·m range, microscopic plastic deformation tends to saturate, the number of effective contact points no longer increases with torque, and impedance stabilizes at the lowest level across the full range, making it the optimal engineering control range. Above 15 N·m, impedance shows essentially no further optimization. Excessive preload can damage the copper substrate, accelerate bolt thread fatigue and preload relaxation, and reduce vibration reliability of the power battery pack.
3.3 Surface Roughness Has a Clear Optimal Window
Surface roughness determines microscopic mating morphology and sealing state at the lap interface. By regulating microscopic contact points, interfacial gaps, and air circulation, it affects both constriction resistance and film resistance and produces a nonlinear concave regulation pattern. Both excessively high and excessively low roughness increase contact impedance, so a precise optimal control range is critical for standardized surface process control in power battery busbar manufacturing.
When roughness is too high, such as Ra ≥ 3.2 μm, constriction resistance rises substantially and overall impedance is higher. When roughness is too low, such as Ra ≤ 0.4 μm, the interface is too tightly mated, and residual moisture and air from processing cannot escape during service, easily inducing slow interfacial oxidation and passivation and causing a small rebound in film resistance. The Ra 0.8–1.6 μm range achieves the best match between microscopic mating precision and interfacial breathability. It ensures sufficient effective contact points to reduce constriction resistance while avoiding oxidation degradation caused by closed air gaps. Contact impedance reaches the minimum across the full range, making this the optimal control window.
3.4 Thickness and Width Follow a Nonlinear Piecewise Rule
Copper busbar thickness and width are core structural parameters that determine structural stiffness, macroscopic conductive cross-section, and heat dissipation. Their optimization effects on contact impedance and temperature rise are not linear, as often assumed, but show significant piecewise differences as plate stiffness changes. Multi-gradient structural test data validate the nonlinear piecewise impedance model and define a stiffness critical switching threshold h₀ ≈ 2.5 mm. Above and below this threshold, the optimization gains of structural parameters follow completely opposite rules.
In the thin-plate region, bending stiffness is insufficient. After bolt clamping, the lap surface warps and suspends, and interfacial contact impedance becomes the dominant term of total impedance. Increasing thickness can effectively improve bending stiffness and eliminate suspension defects, reducing impedance by 34.6%. In the thick-plate region, plate stiffness is sufficient, the interface is fully mated, and contact impedance tends to saturate. The gain from increasing thickness is only 2.3%. Widening the busbar can greatly increase conductive cross-sectional area and reduce bulk resistance, reducing impedance by 65.9%. Under 500 A flash-charging conditions, widening also lowers temperature rise by 8.7 °C. The cost-effectiveness of widening fully surpasses that of thickening, consistent with the nonlinear piecewise theoretical model and confirming its accuracy for power battery busbar design.
| Test number | A level | B level | C level | D level | Contact impedance (μΩ) |
|---|---|---|---|---|---|
| 1 | 1 | 1 | 1 | 1 | 126.3 |
| 2 | 1 | 2 | 2 | 2 | 115.8 |
| 3 | 1 | 3 | 3 | 3 | 108.2 |
| 4 | 1 | 4 | 4 | 4 | 102.7 |
| 5 | 2 | 1 | 2 | 3 | 94.5 |
| 6 | 2 | 2 | 1 | 4 | 88.6 |
| 7 | 2 | 3 | 4 | 1 | 82.1 |
| 8 | 2 | 4 | 3 | 2 | 77.4 |
| 9 | 3 | 1 | 3 | 4 | 71.2 |
| 10 | 3 | 2 | 4 | 3 | 66.5 |
| 11 | 3 | 3 | 1 | 2 | 60.8 |
| 12 | 3 | 4 | 2 | 1 | 55.3 |
| 13 | 4 | 1 | 4 | 2 | 48.6 |
| 14 | 4 | 2 | 3 | 1 | 44.1 |
| 15 | 4 | 3 | 2 | 4 | 41.5 |
| 16 | 4 | 4 | 1 | 3 | 38.2 |
3.5 Multi-Factor Weight Analysis Quantifies Priorities
Variance analysis of the orthogonal test data quantifies the significance and weight share of each factor. All four factors are significant. The influence weight ranking is plating process at 47.2%, tightening torque at 23.5%, contact area at 18.6%, and surface roughness at 10.7%. The error term accounts for the remainder of the total sum of squares. The weight results confirm that plating is the core factor determining both conductive performance and high-temperature stability of power battery busbars, with a weight close to half of the total. It is therefore the first priority for structural optimization and process control under flash-charging conditions.
| Source | Sum of squares | Degrees of freedom | Mean square | F value | Significance | Weight share |
|---|---|---|---|---|---|---|
| A: Plating | 13245.6 | 3 | 4415.2 | 126.3 | Significant | 47.2% |
| B: Torque | 6582.3 | 3 | 2194.1 | 62.7 | Significant | 23.5% |
| C: Roughness | 2997.5 | 3 | 999.2 | 28.6 | Significant | 10.7% |
| D: Area | 5206.8 | 3 | 1735.6 | 49.6 | Significant | 18.6% |
| Error | 209.7 | 3 | 69.9 | — | — | — |
| Total | 28241.9 | 15 | — | — | — | 100% |
The orthogonal analysis also indicates significant coupling and synergy among parameters. Maximizing power battery busbar connection reliability requires coordinated matching of plating process, assembly parameters, and structural parameters rather than isolated optimization of a single variable. The weight hierarchy provides a practical basis for prioritizing engineering actions: plating selection first, assembly torque control second, contact area and structural sizing third, and roughness control as a supporting measure.
4. Engineering Optimization Framework for Power Battery Busbars
4.1 Plating Selection Should Be Graded by Flash-Charging Demand
For ultra-high-rate premium models that endure long-term high-current loads, silver plating is the preferred process. It provides the best conductive performance and high-temperature degradation resistance, helping to avoid impedance deterioration and thermal runaway risk from the source. For conventional fast-charging models, tin plating offers the best overall cost-performance balance and can fully meet regular fast-charging service requirements. Electroless nickel should be eliminated from flash-charging power battery busbar applications, while electroplated nickel, which has relatively poor stability, should be gradually replaced.
4.2 Assembly Process Control Should Be Standardized
- Bolt tightening torque should be strictly controlled within the 12–15 N·m optimal range to prevent copper busbar structural damage and thread fatigue failure caused by excessive torque.
- Lap surface roughness should be standardized within Ra 0.8–1.6 μm to achieve the best multi-dimensional match among microscopic contact state, mechanical mating, and oxidation resistance.
- Repeated tests should be used to verify torque stability and contact impedance consistency in production, supporting reliable power battery pack assembly.
4.3 Structural Design Should Follow the Nonlinear Piecewise Rule
Using 2.5 mm thickness as the boundary, a differentiated design guideline can be established. In the thin-plate region, priority should be given to increasing thickness to improve stiffness, eliminate interfacial suspension defects, and solve the problems of poor contact and large impedance fluctuation. In the thick-plate region, priority should be given to increasing width to enlarge the conductive cross-section and reduce bulk impedance and temperature rise. On the premise of ensuring electrical performance and thermal stability, plate thickness should be precisely controlled to avoid weight redundancy and production cost waste caused by blind thickening. This approach balances reliability and lightweight design requirements for power battery busbars.
4.4 Multi-Parameter Coordination Is Essential for Different Flash-Charging Rates
The study proposes a multi-parameter collaborative optimization system adapted to different flash-charging rates. For higher-rate power battery applications, silver plating, torque control at 12–15 N·m, roughness at Ra 0.8–1.6 μm, and structural sizing based on the 2.5 mm threshold should be combined. For regular fast-charging power battery applications, tin plating can provide a more economical solution while still maintaining acceptable high-temperature stability. In all cases, plating, assembly, and structural parameters should be matched as a system rather than treated as independent variables.
5. Conclusions and Further Work
The study reports four main conclusions. First, it constructs a nonlinear piecewise impedance model with bending stiffness correction for copper busbars, clarifies the physical meaning and quantitative action mechanism of each parameter, explains the differentiated impedance optimization mechanisms of thin and thick plates, and improves the theoretical design system for electrical connections in power battery applications. Second, it quantifies the influence weights of multiple parameters. Plating is the core factor in high-temperature impedance degradation, with a comprehensive weight of 47.2%. Under severe high-temperature conditions, silver plating offers the best stability, tin plating offers the highest engineering cost-performance, and electroless nickel is completely unsuitable for flash-charging conditions. These results provide data support and a theoretical basis for graded plating selection in power battery busbars.
Third, the study identifies optimal assembly process windows. A bolt tightening torque of 12–15 N·m and a surface roughness of Ra 0.8–1.6 μm achieve the best multi-dimensional match among interfacial contact state, mechanical stability, and oxidation resistance. This fills a technical gap in standardized assembly process control for copper busbars under flash-charging conditions. Fourth, the study defines 2.5 mm as the critical thickness for copper busbar optimization and establishes the nonlinear graded design guideline of controlling stiffness in thin plates and controlling cross-section in thick plates. This addresses the industry pain point of structural parameter selection relying excessively on engineering experience without quantitative basis.
The reported work focuses on impedance degradation and optimization under static high-temperature aging. Real vehicle operation, however, involves complex multi-field coupling loads such as temperature cycling, mechanical vibration, and humid heat erosion over long periods. Future work can build a multi-field coupled durability test platform to systematically investigate power battery busbar impedance degradation under combined temperature, vibration, and humidity conditions and to further refine the multi-field coupling nonlinear theoretical model. Such work would extend the current findings from controlled laboratory aging toward full-life-cycle reliability assessment for flash-charging power battery systems.