
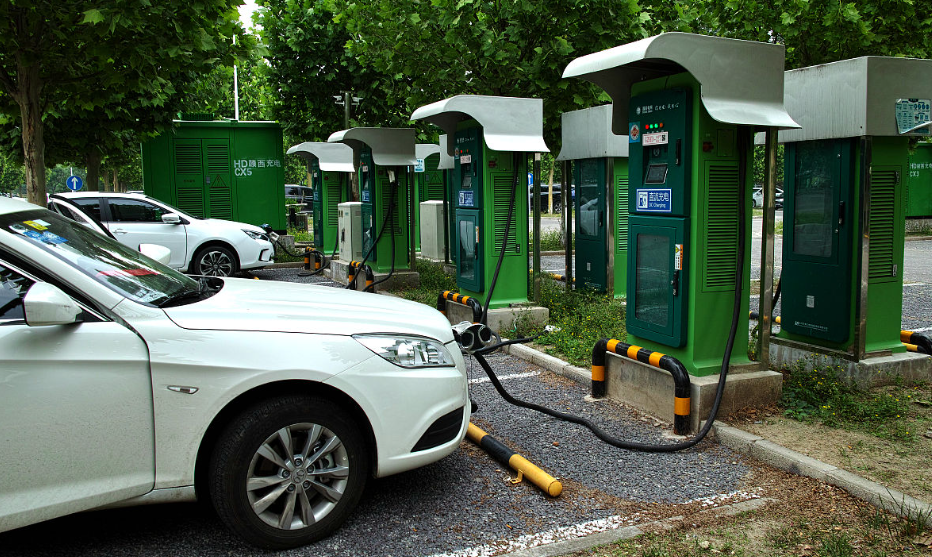
The rapid electrification of road transport has turned electric vehicle charging from a peripheral convenience load into one of the dominant forces reshaping urban distribution networks. When I began this work, the practical problem in front of me was concrete: in dense residential blocks, several hundred private charging piles connected to the same few distribution transformers were switching on within the same narrow evening window, and the resulting coincidence pushed transformer loading far beyond nameplate values while line current utilization approached and occasionally crossed the thermal limit. Traditional distribution planning is built around diversified residential, commercial, and small industrial demand, and it has no mechanism for absorbing the sharp spatiotemporal aggregation that electric vehicle charging produces. My objective was therefore to construct a forecasting model that reflects real charging behavior, to quantify how concentrated electric vehicle charging access degrades transformer and feeder performance, and to propose a coordinated strategy in which capacity expansion and orderly charging management reinforce each other rather than acting as independent remedies.
I structured the study around three interlocking tasks. The first is a dual-layer load model that separates residential charging piles from public charging stations, because these two populations differ fundamentally in timing, power level, and controllability. The second is a quantitative impact analysis that links electric vehicle charging penetration and access density to transformer overload rate, feeder current utilization, voltage deviation, and network loss. The third is a coordinated optimization framework combining a two-stage peak-shifting dispatch algorithm derived from user behavior portraits with an investment–service-quality balance model for capacity expansion. Throughout, I treated user behavior not as noise to be averaged away but as the primary lever through which electric vehicle charging can be reshaped without degrading the service experience.
I selected a 50 km² core urban district in a coastal provincial capital in eastern China as the study area. The district contains 32 residential communities, 18 commercial complexes, and 12 public parking facilities, with 860 charging piles in service (620 residential piles and 240 public station piles) and an electric vehicle penetration rate of approximately 25%. Data were drawn from three independent streams and merged at a 15-minute resolution, as summarized in Table 1.
| Data stream | Source | Volume and resolution | Key fields |
|---|---|---|---|
| Charging behavior records | Charging operator cloud platform, six-month interface extract | 120,000 valid sessions, session level | Start time, duration, power, initial SOC |
| User survey | On-site questionnaire, 1,200 distributed | 1,000 valid responses | Trip pattern, charging preference, willingness to shift |
| Network operation data | Distribution dispatch platform | 30 transformers, 50 feeders, 15-minute sampling | Loading rate, voltage, current |
| Contextual data | Statistical yearbook and tariff schedule | Annual and hourly | Population density, GDP, traffic flow, time-of-use price |
Raw charging records required substantial cleaning before any modeling could proceed. I removed duplicate entries and samples with more than 30% missing fields, and I filled short gaps in transformer loading series by linear interpolation. Outliers were identified with the three-sigma rule applied to charging power and session duration, which removed 3,200 records, or 2.67% of the total. A typical rejected case was a public pile session lasting twelve hours, far outside the observed 0.8-hour fast-charging and 4.2-hour slow-charging means, which I attributed to equipment fault rather than genuine demand. All quantities were then standardized with the Z-score transform so that power, duration, and state of charge could enter the clustering model on comparable scales:
$$z_{i}=\frac{x_{i}-\mu_{x}}{\sigma_{x}}$$
where $x_{i}$ is the raw observation, $\mu_{x}$ and $\sigma_{x}$ are the sample mean and standard deviation of that variable. This preprocessing step mattered more than I initially expected: without standardization, charging power in kilowatts dominated the distance metric and collapsed the clustering into a trivial fast-versus-slow split.
I extracted behavioral features along three dimensions. On the temporal dimension I recorded charging start time, session duration, and the tariff period in which the session fell. Residential piles showed a pronounced evening peak between 18:00 and 22:00 that absorbed 65% of all residential sessions, with a mean duration of 4.2 hours. Public stations exhibited a bimodal pattern, with a weekday midday peak between 11:30 and 13:30 accounting for 38% of public sessions and an evening peak between 19:00 and 21:00 accounting for 32%, with mean fast-charging duration of 0.8 hours and slow-charging duration of 3.5 hours. On the spatial dimension, 82% of residential users charged at their place of residence, while 75% of public charging users were commuters charging near commercial complexes or transport hubs. On the power dimension, residential users overwhelmingly selected slow charging at 3.3 kW or 7 kW (90% of sessions) with initial state of charge between 30% and 50%, whereas public users selected fast charging in 85% of sessions with initial state of charge between 20% and 40%. These regularities are precisely what makes electric vehicle charging dispatchable, and they form the empirical basis for everything that follows.
To convert these features into a usable typology, I fitted a Gaussian mixture model with charging start time, session duration, charging power, and location type as the feature vector. The mixture density for a user feature vector $x$ takes the standard form
$$p(x)=\sum_{k=1}^{K}\pi_{k}\,\mathcal{N}\!\left(x\mid \mu_{k},\Sigma_{k}\right),\qquad \sum_{k=1}^{K}\pi_{k}=1,\quad \pi_{k}\ge 0$$
and the parameters were estimated by the expectation–maximization algorithm, alternating between the posterior responsibility
$$\gamma_{ik}=\frac{\pi_{k}\,\mathcal{N}\!\left(x_{i}\mid \mu_{k},\Sigma_{k}\right)}{\sum_{m=1}^{K}\pi_{m}\,\mathcal{N}\!\left(x_{i}\mid \mu_{m},\Sigma_{m}\right)}$$
and the closed-form updates for the mixing weights and component parameters. Model order was selected by the Bayesian information criterion, which favored four components. The resulting segments are reported in Table 2 and are used throughout the remainder of the analysis as the atomic units of electric vehicle charging demand.
| User segment | Share (%) | Core behavioral signature |
|---|---|---|
| Residential fixed-pattern | 48 | Evening 18:00–22:00 start, 3.3/7 kW slow charging, 4–6 h duration, initial SOC 30–50% |
| Commuter fast-charging | 27 | Weekday 11:30–13:30 start, 60/120 kW fast charging, 0.5–1 h duration, initial SOC 20–40% |
| Emergency top-up | 15 | Random timing, fast charging dominant, 0.3–0.8 h duration, initial SOC 10–30% |
| Long-dwell parking | 10 | Weekend 09:00–17:00 start, 7 kW slow charging, 3–5 h duration, initial SOC 40–60% |
With the typology fixed, I built the dual-layer electric vehicle charging load model. For an individual residential pile, the charging start time was sampled from a normal distribution with mean 19.3 and standard deviation 1.2, consistent with the observed evening clustering. Charging power was drawn as 3.3 kW with probability 0.6 and 7 kW with probability 0.4, and held constant over the session. Session duration follows from the energy required to move the battery from its initial to its target state of charge:
$$T=\frac{\left(SOC_{target}-SOC_{initial}\right)\times C}{P\times\eta}$$
where $C$ is the battery capacity, taken as 60 kWh, $P$ is the charging power, $\eta$ is the charging efficiency (0.90 for slow charging and 0.85 for fast charging), and $SOC_{target}$ is set to 80%. Aggregating individual pile profiles over the residential population gives the layer-one load. Because not all piles operate simultaneously, I introduced a coincidence factor drawn from a Weibull distribution with shape parameter 2.3 and scale parameter 0.75, fitted to observed simultaneous-pile counts. The aggregate residential load at time $t$ is
$$P_{res}(t)=\xi\sum_{i=1}^{N_{res}}P_{i}(t)\,\mathbb{1}\!\left[t\in\left[t_{i}^{s},\,t_{i}^{s}+T_{i}\right)\right]$$
where $\xi$ is the sampled coincidence factor, $N_{res}$ is the number of residential piles, and $t_{i}^{s}$ is the sampled start time of pile $i$.
The public station layer was constructed separately because its composition is fundamentally different. Fast-charging start times follow a normal distribution with mean 12.3 and standard deviation 0.8 on weekdays at midday, and a normal distribution with mean 20.0 and standard deviation 0.9 in the evening, while weekend fast-charging demand was modeled as uniform over 10:00 to 18:00. Fast-charging power was set at 60 kW with probability 0.7 and 120 kW with probability 0.3 under constant-power control, with duration given by
$$T_{fast}=\frac{\left(SOC_{target}-SOC_{initial}\right)\times C}{P_{fast}\times\eta_{fast}}$$
Slow public charging was modeled at a uniform 7 kW with weekend start times drawn from a normal distribution with mean 14.0 and standard deviation 2.0, and weekday evening start times from a normal distribution with mean 19.5 and standard deviation 1.5. Because the three public user segments have different coincidence behavior, I sampled fast-charging coincidence from a Beta distribution with parameters 2.5 and 3.0, and slow-charging coincidence from a Beta distribution with parameters 1.8 and 2.2, then superposed the two contributions. The superposition of the residential and public layers produced the aggregate electric vehicle charging demand profile used for all downstream impact analysis.
The predicted temporal distribution is strongly bimodal, as reported in Table 3. The midday peak of 12.8 MW is dominated by public fast charging, while the evening peak of 18.5 MW arises from the superposition of residential slow charging and public fast charging. The overnight trough falls to 3.2 MW, producing a peak–valley difference of 15.3 MW. This profile is the single most important diagnostic of the whole study: the network is asked to absorb a demand surge that is not only large but compressed into a narrow window, and it is precisely this compression that conventional planning fails to anticipate.
| Period | Dominant component | Predicted load (MW) | Share of daily peak (%) |
|---|---|---|---|
| 00:00–06:00 | Overnight residual slow charging | 3.2 | 17.3 |
| 06:00–11:30 | Residential residual and scattered top-up | 6.4 | 34.6 |
| 11:30–13:30 | Public fast charging | 12.8 | 69.2 |
| 13:30–18:00 | Mixed moderate demand | 8.1 | 43.8 |
| 18:00–22:00 | Residential slow plus public fast | 18.5 | 100.0 |
| 22:00–24:00 | Residential tail | 7.6 | 41.1 |
Spatially, electric vehicle charging demand is markedly uneven. Load density reaches 2.8 MW/km² in the core residential cluster, 2.1 MW/km² around commercial complexes, and only 0.6 MW/km² at the urban fringe. The decisive finding is that these high-density patches overlap almost exactly with the electrically weakest parts of the network, where transformers are older and feeders are long. This spatial coincidence, more than the aggregate magnitude of electric vehicle charging, explains why local overload events cluster in specific blocks.
To quantify transformer-level impact I defined the overload rate as the ratio of actual apparent power to rated capacity,
$$\gamma=\frac{S_{actual}}{S_{rated}}\times 100\%$$
with the actual apparent power obtained by vector superposition of the conventional and charging components:
$$S_{actual}=\sqrt{\left(P_{conv}+P_{char}\right)^{2}+\left(Q_{conv}+Q_{char}\right)^{2}},\qquad Q_{char}=P_{char}\tan\varphi_{char}$$
where a charging power factor of 0.9 was assumed. I then simulated three access scenarios over the 30 monitored transformers, distinguishing rated capacities of 400 kVA and 630 kVA, and the results are reported in Tables 4 and 5. In the uncoordinated scenario, ten transformers, one third of the population, exceeded 110% loading, with a maximum of 135% on a 400 kVA unit in the core residential block, concentrated in the 19:00–21:00 window. The 630 kVA units were consistently less stressed, confirming that nameplate capacity is a first-order determinant. When only residential piles were subjected to peak shifting, the count of transformers above 110% fell from ten to three and the maximum rate fell to 118%. Under full coordinated dispatch at a penetration of 50%, no transformer exceeded 110% and the maximum rate was 108%, which demonstrates that orderly management of electric vehicle charging can absorb a substantial increase in connection capacity without proportional capital investment.
| Scenario | Access mode | Penetration (%) | Participation in dispatch |
|---|---|---|---|
| Scenario 1 | Uncoordinated | 30 | None |
| Scenario 2 | Partially coordinated | 30 | Residential piles only |
| Scenario 3 | Fully coordinated | 50 | Residential and public piles |
| Scenario | Rated capacity (kVA) | Transformers above 110% (units) | Maximum overload rate (%) | Peak-period mean overload rate (%) |
|---|---|---|---|---|
| Scenario 1 | 400 | 8 | 135 | 105 |
| Scenario 1 | 630 | 2 | 118 | 88 |
| Scenario 2 | 400 | 2 | 118 | 92 |
| Scenario 2 | 630 | 1 | 105 | 75 |
| Scenario 3 | 400 | 0 | 108 | 98 |
| Scenario 3 | 630 | 0 | 102 | 82 |
Sensitivity analysis conducted with a one-factor-at-a-time design identified three dominant drivers of transformer stress. First, access capacity: every additional 100 kW connected to a 400 kVA unit raised the peak overload rate by 8% to 12%, and the relationship became sharply nonlinear once connected capacity exceeded 60% of nameplate rating. Second, access location: concentrating electric vehicle charging in a single supply area produced overload rates 20% to 30% higher than dispersed access, because the conventional load base in dense residential blocks is already high. Third, charging mode: at equal connected capacity, fast-charging piles produced maximum overload rates 15% to 25% higher than slow-charging piles. These three findings jointly justify a strategy that differentiates by area and by power level rather than applying a uniform rule.
Feeder loading was analyzed with the steady-state IEEE thermal balance formulation, in which the permissible current is obtained from the balance between Joule heating and convective plus radiative cooling:
$$I_{max}=\sqrt{\frac{Q_{conv}+Q_{rad}}{R\,\Delta t}}$$
where $Q_{conv}$ and $Q_{rad}$ are the convective and radiative heat dissipation per unit length, $R$ is the conductor resistance per unit length, and $\Delta t$ is the permissible temperature rise. I evaluated the expression under standard ambient conditions of 25 °C and 0.5 m/s wind speed for the LGJ-120/20 conductor rated at 315 A. Current utilization was defined as
$$\lambda_{j}=\frac{I_{j}}{I_{max,j}}\times 100\%$$
and risk was graded according to the thresholds in Table 6. The scenario-level risk distribution is given in Table 7. Under uncoordinated access, twelve feeders, or 24%, entered the high-risk band and the maximum utilization reached 105% on a commercial-corridor feeder; the same feeder had been operating near its thermal limit even before charging load was added. Partial coordination reduced high-risk feeders to three, and full coordination eliminated the high-risk category entirely while leaving fifteen feeders in the medium-risk band. I regard the elimination of the high-risk category, rather than the reduction of average utilization, as the meaningful safety outcome.
| Current utilization (%) | Risk level | Operational interpretation |
|---|---|---|
| Below 80 | Low | Secure operation with spare capacity |
| 80–95 | Medium | Normal operation, enhanced monitoring needed |
| 95–105 | High | At or beyond thermal rating, accelerated ageing |
| Above 105 | Very high | Severe overload, trip and conductor damage risk |
| Scenario | High-risk feeders (units) | Medium-risk feeders (units) | Maximum utilization (%) | Mean utilization in dense zones (%) |
|---|---|---|---|---|
| Scenario 1 | 12 | 23 | 105 | 88 |
| Scenario 2 | 3 | 18 | 97 | 86 |
| Scenario 3 | 0 | 15 | 94 | 85 |
Beyond individual components, concentrated electric vehicle charging restructures the operating characteristics of the whole network. The peak–valley difference expanded from 18 MW to 33 MW under uncoordinated access, raising the peak–valley ratio to 45%, and coordinated dispatch compressed it back to 22 MW and 30%. Voltage quality deteriorated at feeder ends, where the minimum voltage fell to 198 V during the evening peak, corresponding to a deviation of
$$\varepsilon_{V}=\frac{V_{actual}-V_{nominal}}{V_{nominal}}\times 100\%=-1.0\%$$
against a nominal 200 V lower limit applicable at the measurement point. After coordinated dispatch and targeted reinforcement the feeder-end voltage recovered above 205 V with a compliance rate of 99.8%. Network losses under uncoordinated access increased by 28% relative to the no-charging baseline, concentrated on the heavily loaded residential feeders; coordinated dispatch held the increase within 10%. Table 8 consolidates the system-level comparison.
| System indicator | No charging load | Scenario 1 | Scenario 3 |
|---|---|---|---|
| Peak–valley difference (MW) | 18 | 33 | 22 |
| Peak–valley ratio (%) | 28 | 45 | 30 |
| Minimum feeder-end voltage (V) | 212 | 198 | 206 |
| Voltage compliance rate (%) | 99.9 | 95.2 | 99.8 |
| Network loss increase (%) | 0 | 28 | 9.6 |
The coordinated strategy rests on a three-objective formulation. From the network side I minimize the weighted violation of transformer overload and feeder utilization limits:
$$\min f_{1}=\omega_{1}\max\left(\gamma_{i}-\gamma_{max}\right)^{+}+\omega_{2}\max\left(\lambda_{j}-\lambda_{max}\right)^{+}$$
with $\gamma_{max}=110\%$, $\lambda_{max}=95\%$, and weights $\omega_{1}=0.6$ and $\omega_{2}=0.4$. From the user side I minimize a weighted combination of waiting time and charging cost:
$$\min f_{2}=\omega_{3}T_{wait}+\omega_{4}C_{char}$$
with $\omega_{3}=\omega_{4}=0.5$. From the operator side I maximize pile utilization:
$$\max f_{3}=\frac{\sum_{i}T_{used,i}}{\sum_{i}T_{total,i}}$$
The decision variables are the binary assignment $u_{i,t}$ of pile $i$ to time slot $t$, subject to power limits, user availability windows, and a terminal state-of-charge requirement:
$$\sum_{t}u_{i,t}P_{i}\Delta t\ \ge\ E_{i},\qquad SOC_{i}^{end}\ge SOC_{i}^{\min},\qquad u_{i,t}\in\{0,1\}$$
where $E_{i}$ is the energy required by session $i$ and $SOC_{i}^{\min}$ is the user-specific minimum acceptable terminal state of charge, set to 60% for emergency top-up users and to the target value for other segments. In practice the mixed-integer structure is relaxed and solved in two stages, because a single global optimization over 860 piles and 96 daily slots is neither tractable nor operationally meaningful.
In the first stage I allocate load hierarchically. Based on real-time transformer loading, feeder utilization, and the forecast electric vehicle charging demand, the aggregator distributes total charging energy across time slots and across supply areas to flatten the network-side objective. This upper-level problem is solved with particle swarm optimization, using the standard velocity and position updates
$$v_{id}^{k+1}=w\,v_{id}^{k}+c_{1}r_{1}\left(p_{id}^{k}-x_{id}^{k}\right)+c_{2}r_{2}\left(g_{d}^{k}-x_{id}^{k}\right),\qquad x_{id}^{k+1}=x_{id}^{k}+v_{id}^{k+1}$$
where each particle encodes a full allocation matrix of energy across time slots and areas, and the fitness is the weighted sum of the three normalized objectives subject to a penalty on constraint violation. In the second stage I dispatch individual sessions according to segment-specific rules, summarized in Table 9. This decomposition preserves the global balance achieved in stage one while keeping each individual instruction simple enough to be executed by the charging pile controller and communicated through the operator cloud platform.
| User segment | Preferred window | Power policy | Incentive or guarantee |
|---|---|---|---|
| Residential fixed-pattern | 23:00–06:00 valley | Slow charging, 3.3/7 kW | Valley tariff of 0.30 per kWh |
| Commuter fast-charging | 11:30–13:30, shifted if needed | Dynamic derating from 120 kW to 60 kW when transformer loading exceeds 85% | Priority queue access |
| Emergency top-up | Immediate | Fast charging, capped at 1 h | Routing to lightly loaded supply areas |
| Long-dwell parking | 10:00–18:00 shoulder | Slow charging, 7 kW | Parking fee discount |
The dispatch algorithm was validated against measured district data. Transformer mean overload rate fell from 105% to 88%, feeder mean utilization from 92% to 85%, and the peak–valley ratio from 45% to 30%. On the user side, residential users saw charging costs fall by 15% to 20% through valley tariffs, commuter fast-charging users saw mean waiting time fall below five minutes, emergency users achieved a 98% demand satisfaction rate, and overall satisfaction rose to 92%. Pile utilization climbed from 65% to 78%, with the valley-period utilization rising from 35% to 62%, and operator revenue increased by 17.6%. The gain in valley utilization is particularly important because it indicates that the load was genuinely relocated rather than merely suppressed; electric vehicle charging became a productive absorber of surplus overnight capacity.
Orderly management alone, however, cannot resolve structural capacity deficits, so I paired it with a differentiated reinforcement plan. Areas were classified by charging load density, transformer overload rate, and the share of high-risk feeders, and prioritized by the analytic hierarchy process, as shown in Table 10. High-priority areas combine a load density above 2.0 MW/km², transformer overload above 100%, and more than 30% of feeders at high risk. Medium-priority areas occupy the intermediate range and are addressed mainly through management with selective reinforcement. Low-priority areas require only reserved capacity and monitoring.
| Area class | Load density (MW/km²) | Transformer overload (%) | High-risk feeder share (%) | Priority |
|---|---|---|---|---|
| High priority | Above 2.0 | Above 100 | Above 30 | 1 |
| Medium priority | 1.0–2.0 | 85–100 | 15–30 | 2 |
| Low priority | Below 1.0 | Below 85 | Below 15 | 3 |
The corresponding measures are set out in Table 11. In high-priority areas I replace 400 kVA transformers with 630 kVA or 800 kVA units equipped with intelligent transformer terminals for real-time loading visibility, reconductor LGJ-120/20 feeders to LGJ-185/30 to raise the thermal rating from 315 A to 450 A, introduce cable distribution boxes to disperse connection points, and install a 300 kWh storage system at the largest public station to form an integrated photovoltaic–storage–charging configuration that shaves the midday fast-charging peak. In medium-priority areas I apply selective transformer upgrading, on-load tap changers, and segmented feeder reconductoring, while extending full orderly dispatch coverage to all piles so that management substitutes for part of the capital expenditure. In low-priority areas I standardize new transformers at 800 kVA and reserve 20% to 30% conductor headroom so that future electric vehicle charging growth can be accommodated without retrofitting.
| Area class | Transformer measures | Feeder measures | Management and storage measures |
|---|---|---|---|
| High priority | 400 kVA upgraded to 630/800 kVA with intelligent terminals | Reconductor to LGJ-185/30, disperse connection points | 300 kWh storage, full two-stage dispatch, valley tariff |
| Medium priority | Selective upgrade to 630 kVA, on-load tap changers | Segmented reconductoring of high-risk sections | 100% intelligent pile coverage, orderly dispatch |
| Low priority | New units standardized at 800 kVA | 20–30% headroom reserved in design | Load monitoring terminals, periodic re-forecasting |
Economic appraisal used a life-cycle cost formulation that discounts operating, maintenance, and benefit streams over the planning horizon:
$$LCC=C_{inv}+\sum_{t=1}^{T}\frac{C_{op}(t)+C_{m}(t)-B(t)}{\left(1+r\right)^{t}}$$
with the simple payback obtained as the ratio of investment to annual net benefit,
$$T_{pb}=\frac{C_{inv}}{B_{annual}}$$
For the high-priority area the investment of 12.0 million units of currency yields a life-cycle cost of 28.0 million, annual avoided outage losses of 3.0 million, and annual loss savings of 0.8 million, giving a payback of about 8.5 years. The medium-priority area shows a payback of 7.8 years, and the low-priority area about 10 years, the latter dominated by deferred benefits from future load growth.
To reconcile capital expenditure with service quality I formulated an explicit balance model. The cost objective aggregates transformer, feeder, and storage investment,
$$\min C=\sum C_{trans}+\sum C_{line}+\sum C_{storage}$$
while the benefit objective combines satisfaction, demand fulfillment, and waiting time:
$$\max Q=\alpha_{1}S+\alpha_{2}R-\alpha_{3}T_{wait}$$
with $\alpha_{1}=0.4$, $\alpha_{2}=0.4$, and $\alpha_{3}=0.2$. The constraints are the security limits on transformer overload, feeder utilization, and voltage deviation, together with technical standards and the annual budget ceiling. Because the two objectives conflict, I solved the model with the non-dominated sorting genetic algorithm III and retained the Pareto set, from which I selected a compromise solution on the basis of budget feasibility and marginal benefit. The selected plan invests 18.0 million units of currency, of which 12.0 million goes to the high-priority area and 6.0 million to the medium-priority area, and achieves 92% satisfaction, 98% demand fulfillment, a mean wait of 4.5 minutes, a transformer mean overload rate of 88%, a feeder mean utilization of 85%, and a voltage compliance rate of 99.8%.
The implementation sequence is organized in four phases, described in Table 12. I consider the periodic re-forecasting step essential: electric vehicle charging demand is not stationary, and a reinforcement plan fixed at commissioning will be misaligned with actual growth within a few years.
| Phase | Duration | Principal activities |
|---|---|---|
| Preparation | 1–3 months | Demand forecasting, network assessment, area classification, draft plan and dispatch rules |
| Reinforcement | 4–12 months | Transformer upgrading, reconductoring, terminal and monitoring installation, storage commissioning, pile intelligence upgrade |
| Dispatch operation | Continuous | Two-stage peak shifting, real-time monitoring, dynamic rule adjustment, periodic performance review |
| Continuous improvement | Every 2 years | Forecast update, plan revision, parameter recalibration of the balance model |
Simulation was carried out in a detailed network model with one 110 kV substation, eight 10 kV outgoing feeders, thirty transformers split evenly between 400 kVA and 630 kVA, and fifty LGJ-120/20 feeders covering the 50 km² district. Conventional load was represented by a residential peak of 15 MW, a commercial peak of 8 MW, and an industrial peak of 5 MW, with time-of-use tariffs applied as in the local schedule. Charging parameters followed the dual-layer model, with 860 piles distributed across segments in the proportions established by clustering. The reinforcement parameters matched the plan in Table 11. The aggregated results are presented in Tables 13 through 15.
| Indicator | Uncoordinated | Coordinated strategy | Improvement |
|---|---|---|---|
| Mean transformer overload rate (%) | 105 | 88 | Reduced by 16.2% |
| Mean feeder current utilization (%) | 92 | 85 | Reduced by 7.6% |
| Voltage compliance rate (%) | 95.2 | 99.8 | Increased by 4.6% |
| Network loss rate (%) | 3.8 | 2.9 | Reduced by 23.7% |
| Transformers above 110% (units) | 10 | 0 | Eliminated |
| High-risk feeders (units) | 12 | 0 | Eliminated |
| Indicator | Uncoordinated | Coordinated strategy | Improvement |
|---|---|---|---|
| Charging service satisfaction (%) | 75 | 92 | Increased by 22.7% |
| Charging demand fulfillment rate (%) | 85 | 98 | Increased by 15.3% |
| Mean charging wait time (min) | 15 | 4.5 | Reduced by 70% |
| Residential mean charging cost (per kWh) | 0.85 | 0.70 | Reduced by 17.6% |
| Economic indicator | Value |
|---|---|
| Total reinforcement investment | 18.0 million |
| Investment of conventional full-scope alternative | 25.0 million |
| Investment saving | 28% |
| Annual avoided cost | 4.3 million |
| Payback period | 8.2 years |
| Life-cycle benefit | 35.0 million |
Field validation was carried out in the highest-priority residential block, which contains 280 residential piles, 60 public station piles, four 400 kVA transformers, and eight LGJ-120/20 feeders. Before intervention the block recorded a maximum transformer overload rate of 135%, a maximum feeder utilization of 105%, and 32 charging-related complaints in a single quarter. I applied the full package: four transformers upgraded, two of them to 800 kVA; four feeders reconductored to LGJ-185/30; a 300 kWh storage system installed at the largest public station; residential users guided into the valley window with the discounted tariff; and commuter fast charging subjected to dynamic derating at midday. Maximum transformer overload rate fell to 102% and maximum feeder utilization to 90%. Satisfaction rose from 72% to 93%, mean waiting time fell from 18 minutes to 3 minutes, quarterly complaints fell to two, annual avoided outage loss reached 1.2 million, and the payback period was 7.8 years. The persistence of a 102% peak, even after reinforcement, is instructive: it shows that capacity expansion and load management must be tuned jointly, and that a modest controlled overload during a short window is an economically rational outcome compared with sizing the network for an instantaneous worst case.
Several conclusions follow from this work. First, a dual-layer electric vehicle charging load model built on Gaussian-mixture user segmentation reproduces the spatiotemporal distribution of demand with a validated accuracy of 88%, and the segmentation itself is what makes differentiated control possible; treating all electric vehicle charging as a single aggregate obscures exactly the heterogeneity that can be exploited. Second, the impact of high-density electric vehicle charging is governed by spatial coincidence as much as by magnitude: uncoordinated access drove maximum transformer overload to 135% and maximum feeder utilization to 105%, expanded the peak–valley difference by 72%, and pushed feeder-end voltage below its lower limit, with transformer capacity, conductor type, and access density as the controlling parameters. Third, coordinated dispatch and differentiated reinforcement are complementary rather than substitutable. The two-stage peak-shifting algorithm, anchored in the four user segments, reduced the transformer mean overload rate by 16.2%, feeder utilization by 7.6%, improved voltage compliance by 4.6 percentage points, and raised satisfaction by 22.7% while shortening waiting time by 70%. Fourth, the investment–service-quality balance model identified a plan that saves 28% of capital relative to a conventional full-scope rebuild, with a payback of 8.2 years and a life-cycle benefit of 35.0 million. The overall message I would emphasize is that electric vehicle charging is not simply a load to be carried; properly instrumented and properly dispatched, it is a flexible resource whose value to the urban distribution network is realized only when planning and operation are designed together.