
The global transition towards sustainable energy systems has created an immense demand for efficient, large-scale energy storage solutions. Within this domain, lithium-ion battery technology is paramount due to its high energy density and long cycle life. However, the thermal behavior of these battery systems, particularly within the context of large-scale stationary storage or electric vehicle (EV) battery packs, presents a significant challenge. Poor thermal stability can accelerate detrimental side reactions, degrade cell materials, and, in extreme cases, lead to thermal runaway. Therefore, maintaining the operating temperature of an EV battery pack within a narrow optimal range, typically 20–35°C, is critical for ensuring safety, maximizing performance, and extending service life.
This study focuses on the thermal management of a representative energy storage battery pack, analogous in thermal load and configuration to a large-format EV battery pack. Liquid cooling, particularly indirect cooling via cold plates, is the dominant strategy for managing the substantial heat generation during high-power operation. To push the performance boundaries of such systems, we employ a numerical simulation approach, calibrated and validated against experimental data. We systematically investigate three critical factors that profoundly influence the thermal performance of the battery pack: the aspect ratio of the cooling channel within the cold plate, the spatial layout of the cold plates relative to the cells, and the coolant flow rate.
The primary objective is to identify configurations that not only minimize the peak temperature rise of the cells but also drastically improve temperature uniformity across the entire EV battery pack, while simultaneously considering the hydraulic performance and energy consumption of the cooling system itself.
1. Numerical Model Development
1.1 Physical Model and Material Properties
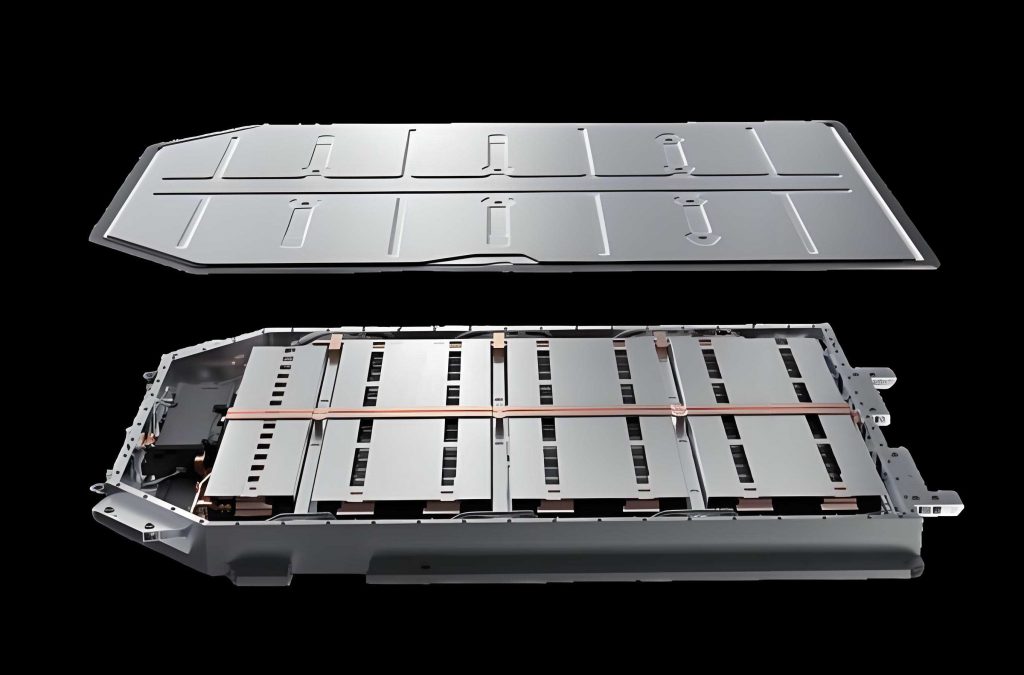
The study object is a single battery module with a 1P52S configuration, designed for high-capacity energy storage. The cells are semi-solid lithium-ion batteries, chosen for their enhanced thermal safety characteristics. The key specifications of a single cell are summarized in Table 1.
Table 1: Specifications of the Semi-Solid Lithium-ion Cell
| Parameter | Value |
|---|---|
| Nominal Capacity | 280 Ah |
| Dimensions (L × W × H) | 173.8 × 71.6 × 207.2 mm |
| Weight | 5.5 kg |
| DC Internal Resistance (25°C, 25% SOC) | 0.50 mΩ |
The battery pack assembly consists of 52 cells, insulating spacers, polycarbonate (PC) boards, thermal interface materials (TIM), and aluminum liquid cold plates. The cold plate features a serpentine flow channel design with four parallel paths. Three different channel cross-sections are investigated, characterized by their width-to-height (W/H) aspect ratios of 7, 5, and 3, with a constant channel height (H) of 6 mm. The material properties of the key components are listed in Table 2, which are essential inputs for an accurate thermal simulation of the EV battery pack.
Table 2: Thermophysical Properties of Battery Pack Components
| Component | Density, ρ (kg/m³) | Specific Heat, Cp (J/kg·K) | Thermal Conductivity, k (W/m·K) |
|---|---|---|---|
| Cell | 2152 | 1051.1 | kth=1.04, kw, kh=21.05* |
| Cold Plate (Aluminum) | 2680 | 880 | 237 |
| Thermal Silicone Pad (TIM) | 2420 | 967 | 2.1 |
| Coolant (Water-Glycol) | 1065 | 3394 | 0.419 |
| PC Insulation Board | 1200 | 1340 | 0.194 |
*Note: The cell is modeled with anisotropic thermal conductivity: kth (through-plane), kw (in-plane width), kh (in-plane height).
Two cooling layouts are evaluated: the conventional bottom-only cooling, where a single cold plate is placed beneath the cell array, and an advanced bottom + side cooling layout, where additional cold plates are attached to the sides of the cell stack to provide multi-directional cooling, addressing the significant vertical temperature gradient common in bottom-cooled EV battery packs.
1.2 Governing Equations
The thermal-fluid simulation is based on the following assumptions: contact resistances are neglected; material properties are temperature-independent; and radiation heat transfer is insignificant. The governing equations for the conjugate heat transfer problem are:
1. Energy Conservation for the Battery Cell:
The heat generation within each cell of the EV battery pack is governed by:
$$ \rho C_p \frac{\partial T}{\partial t} = \nabla \cdot (k \nabla T) + \dot{q}_{gen} $$
where $\rho$ is density, $C_p$ is specific heat capacity, $k$ is thermal conductivity (anisotropic for the cell), $T$ is temperature, $t$ is time, and $\dot{q}_{gen}$ is the volumetric heat generation rate.
2. Navier-Stokes Equations for Coolant Flow:
The flow and heat transfer of the coolant within the cold plates are described by:
$$ \frac{\partial}{\partial t}(\rho \vec{v}) + \nabla \cdot (\rho \vec{v} \vec{v}) = -\nabla p + \mu \nabla^2 \vec{v} + \vec{F} $$
$$ \frac{\partial \rho}{\partial t} + \nabla \cdot (\rho \vec{v}) = 0 $$
where $\vec{v}$ is the velocity vector, $p$ is pressure, $\mu$ is dynamic viscosity, and $\vec{F}$ represents body forces (e.g., gravity).
1.3 Battery Heat Generation Model
The heat generation rate $\dot{q}_{gen}$ in a lithium-ion cell is calculated using the Bernardi model, which accounts for both irreversible (Joule) heating and reversible (entropic) heating:
$$ \dot{q}_{gen} = \frac{1}{V_b} \left( I^2 R(T, SOC) + I T \frac{dE_{oc}}{dT} \right) $$
where $I$ is the current (positive for discharge), $V_b$ is the cell volume, $R$ is the total internal resistance, $T$ is the absolute temperature, and $\frac{dE_{oc}}{dT}$ is the entropic heat coefficient. For this study, $\frac{dE_{oc}}{dT}$ is taken as a constant 0.00049 V/K. The internal resistance $R$ is a critical parameter that varies with both State of Charge (SOC) and temperature. The SOC is defined as:
$$ SOC(t) = 1 – \frac{I t}{C_N} $$
where $C_N$ is the nominal cell capacity. The $R(SOC, T)$ relationship was obtained from experimental 10-second pulse discharge tests across the full SOC and temperature range, providing a high-fidelity input map (DCR map) for the simulation, ensuring accurate heat generation prediction for the EV battery pack under dynamic conditions.
1.4 Computational Domain, Boundary Conditions, and Model Validation
The computational domain includes the solid components of the battery pack, the surrounding air, and the fluid domain inside the cold plates. The ambient temperature is set to 25°C. A convective heat transfer boundary condition with a coefficient of 5 W/(m²·K) is applied to the external surfaces of the pack. For the cold plates, a mass flow inlet condition (corresponding to volumetric flow rates of 5 to 15 L/min) with a coolant temperature of 22°C and a pressure outlet condition are specified. A 2-mm thick thermal pad is modeled between the cells and the cold plate to account for contact resistance.
The numerical model’s accuracy is paramount for a reliable study of the EV battery pack’s thermal behavior. It was rigorously validated against experimental data from single-cell discharge tests at 0.5C and 1C rates. The comparison showed excellent agreement, with a maximum relative error of less than 2.9%, calculated as:
$$ \text{Relative Error (\%)} = \frac{|T_{exp} – T_{sim}|}{T_{exp}} \times 100 $$
This validated model was then used to simulate the full pack discharge at a 0.5C rate (140A) for 6480 seconds, corresponding to a 90% depth of discharge (DOD). The key performance indicators monitored were the maximum cell temperature (monitored on the top surface) and the global maximum temperature difference across all cells, providing a stringent measure of temperature uniformity for the EV battery pack.
2. Results and Discussion
2.1 Impact of Cold Plate Channel Aspect Ratio (W/H)
With a fixed bottom cooling flow rate of 10 L/min, the effect of the cold plate channel’s aspect ratio (W/H = 7, 5, 3) on the EV battery pack’s thermal and hydraulic performance was analyzed. The results are summarized in Table 3.
Table 3: Performance Comparison for Different Channel Aspect Ratios (at t=6480s, 10 L/min)
| Parameter | W/H = 7 | W/H = 5 | W/H = 3 |
|---|---|---|---|
| Max. Cell Temp. Rise (°C) | 7.62 | 7.48 | 7.44 |
| Change vs. W/H=3 | +0.18°C (+2.4%) | +0.04°C (+0.5%) | Baseline |
| System Pressure Drop, ΔP (kPa) | ~27.5 | ~22.5 | ~16.4 |
| Reduction vs. W/H=7 | Baseline | ~18.2% | ~40.4% |
| Cooling System Energy (kJ)* | ~133.5 | ~124.8 | ~90.9 |
*Cumulative energy consumption of the coolant pump over the discharge cycle.
The data indicates that the channel aspect ratio has a minimal impact on the peak cell temperature, with less than a 0.2°C variation between the extremes. This is because a smaller W/H (narrower, taller channel) increases flow velocity and convective heat transfer coefficient but reduces the contact surface area with the cold plate base. These opposing effects largely cancel each other out thermally. However, the hydraulic impact is substantial. The smaller W/H channel offers significantly lower flow resistance, reducing the pressure drop by approximately 40% compared to the W/H=7 design. This translates directly into lower pumping power requirement and energy consumption for the thermal management system of the EV battery pack. Therefore, the W/H=3 design is hydraulically superior with equivalent cooling performance.
2.2 Impact of Cold Plate Layout (Bottom-only vs. Bottom+Side)
This section compares the fundamental cooling strategies for the EV battery pack. The total coolant flow rate was kept constant (10 L/min for bottom-only; distributed as 10 L/min bottom + 5 L/min per side for bottom+side). The performance metrics are starkly different, as shown in Table 4.
Table 4: Performance Comparison of Cooling Layouts (at t=6480s)
| Performance Metric | Bottom-Only Cooling | Bottom + Side Cooling | Improvement |
|---|---|---|---|
| Max. Cell Temp. Rise (°C) | 7.62 | 0.51 | 7.11°C (93.3%) lower |
| Global Max. ΔT (°C) | 8.80 | 3.00 | 5.80°C (65.9%) lower |
| Avg. Heat Rejection (W) | ~185 | ~380 | ~105% higher |
The bottom + side cooling layout demonstrates a transformative improvement. It reduces the peak temperature rise by over 7°C, effectively constraining cell temperatures within the optimal band. More importantly, it drastically improves temperature uniformity, cutting the global temperature difference from an unacceptable 8.8°C down to 3.0°C. This is because the side plates actively cool the upper regions of the cells, mitigating the severe vertical thermal gradient inherent to bottom-only cooling. The enhanced cooling power, roughly double that of the bottom-only layout, is the direct cause of this superior thermal performance. This layout is therefore critical for achieving the stringent thermal homogeneity required for the longevity and safety of a high-performance EV battery pack.
2.3 Impact of Coolant Flow Rate
For the bottom-only cooling configuration, the influence of the inlet volumetric flow rate (Q) was investigated from 5 to 15 L/min. The results, summarized in Table 5, reveal a law of diminishing returns.
Table 5: Effect of Coolant Flow Rate on Bottom-Cooled EV Battery Pack Performance (at t=6480s)
| Flow Rate, Q (L/min) | 5 | 7.5 | 10 | 12.5 | 15 |
|---|---|---|---|---|---|
| Max. Temp. Rise (°C) | 9.85 | 8.45 | 7.62 | 7.22 | 7.04 |
| Top Surface Max. ΔT (°C) | 2.80 | 2.09 | 1.70 | 1.44 | 1.27 |
| System ΔP (kPa) | ~4.2 | ~8.9 | ~16.4 | ~25.9 | ~37.5 |
| Pump Energy (kJ) | ~12.6 | ~39.9 | ~90.9 | ~161.0 | ~262.5 |
The data shows that increasing the flow rate improves both peak temperature and uniformity, but the benefit diminishes sharply. For instance, increasing Q from 12.5 to 15 L/min only reduces the peak temperature by 0.18°C. Conversely, the pressure drop and pump energy consumption increase approximately with the square of the flow rate, making high flow rates highly inefficient. The analysis identifies an optimal flow rate window of 10–12.5 L/min for this specific bottom-cooled EV battery pack design. Within this range, a good balance is achieved between effective thermal performance (max T < 32.7°C, max ΔT < 1.8°C) and manageable system hydraulic load.
2.4 Synergistic Effect of Multi-Factor Optimization
Finally, the synergistic effect of combining the optimal individual factors was investigated. The configuration comprised: 1) W/H=3 channel, 2) Bottom+Side cooling layout, and 3) A bottom plate flow rate of 12.5 L/min (with proportional side flow). The performance was compared against the single best factor (Bottom+Side cooling with W/H=3 and 10 L/min equivalent). The results are presented in Table 6.
Table 6: Single-Factor vs. Multi-Factor Optimized Cooling Performance
| Configuration | Max. Temp. Rise (°C) | Global Max. ΔT (°C) |
|---|---|---|
| Single Best Factor (Bottom+Side Cooling) | 0.51 | 3.00 |
| Multi-Factor Optimized (W/H=3, Bottom+Side, Q=12.5L/min) | 0.40 | 2.90 |
| Difference | 0.11°C | 0.10°C |
The multi-factor optimized design yields the absolute best performance, with the lowest peak temperature rise (0.40°C) and best uniformity (2.90°C global ΔT). However, the key finding is that the performance is extremely close to that achieved by the single factor of Bottom+Side cooling alone. The additional optimization of channel shape and flow rate provides only a marginal improvement of about 0.1°C. This conclusively demonstrates that for this EV battery pack, the cooling layout is the dominant factor governing thermal performance. The transition from bottom-only to bottom+side cooling is the most impactful design decision, dwarfing the effects of channel geometry refinement or flow rate adjustments within practical limits.
3. Conclusions
This numerical study provides a comprehensive analysis of key design factors affecting the thermal management of a large-format energy storage battery pack, with direct implications for EV battery pack design. The primary conclusions are:
1. The aspect ratio (W/H) of the cold plate channel has a negligible effect on the peak cell temperature (variations < 0.2°C) but a major impact on system hydraulics. A smaller W/H ratio (e.g., 3) significantly reduces pressure drop and pumping energy compared to larger ratios (e.g., 7), making it the preferred choice for efficient system design.
2. The spatial layout of the cooling system is the most critical factor. The bottom + side cooling layout outperforms the conventional bottom-only layout by a dramatic margin. It reduces the maximum temperature rise by approximately 7.1°C (93%) and improves temperature uniformity by approximately 5.8°C (66%), effectively maintaining the EV battery pack within its ideal operating window.
3. There exists an optimal coolant flow rate range (10–12.5 L/min for the studied bottom plate) that balances thermal performance against hydraulic losses. Flow rates beyond this range yield diminishing thermal returns while exponentially increasing pressure drop and pump energy consumption.
4. In a multi-factor optimization, while the combination of optimal channel design (W/H=3), optimal layout (Bottom+Side), and optimal flow rate (12.5 L/min) delivers the best absolute performance, the improvement over using the optimal layout alone is minimal (~0.1°C). This confirms that adopting a multi-directional (bottom+side) cooling strategy is the paramount and sufficient measure for achieving excellent thermal control in such an EV battery pack.
For engineers designing thermal management systems for high-capacity energy storage or EV battery packs, the primary recommendation is to prioritize a cooling layout that attacks heat from multiple sides (e.g., bottom and sides) to suppress vertical temperature gradients. Subsequently, the cold plate internal geometry and coolant flow rate can be fine-tuned within the optimal range identified to achieve marginal further gains and minimize auxiliary energy consumption. This approach ensures safe, long-lasting, and high-performing battery systems.