
The safety of electric vehicles (EVs) is paramount, with the battery pack being one of the most critical and vulnerable components. Unlike internal combustion engine vehicles, the EV battery pack is typically mounted beneath the vehicle floor, directly exposing its underbody to potential road debris, curb strikes, and other impact hazards. Damage from such underbody impacts can be insidious, often going unnoticed by the user. Persistent mechanical abuse or compression of the cell internals can lead to internal short circuits, thermal runaway, and ultimately, fire. Consequently, evaluating and enhancing the crashworthiness of the EV battery pack against bottom impacts has become a central focus in automotive safety engineering. This study details the development and validation of a high-fidelity finite element simulation methodology for assessing EV battery pack integrity under localized high-speed bottom impacts, centered on a Representative Volume Element (RVE) model for prismatic cells.
Standardization bodies and automotive manufacturers have begun establishing test protocols for this specific threat. For instance, the Chinese group standard T/CSAE 244-2021 specifies a spherical impactor test method to evaluate the bottom crash resistance of pure electric passenger cars. Various OEMs have also developed their own corporate standards, though parameters like impactor mass, diameter, and energy level can vary, as summarized in Table 1. The core failure mechanism in these events is the mechanical abuse of individual cells leading to an internal short circuit. Therefore, an accurate cell-level model that can predict local deformation and potential failure under dynamic, localized loading is indispensable for predictive simulation at the full EV battery pack level.
| Standard / Source | Impactor Diameter | Impactor Mass | Impact Energy / Force |
|---|---|---|---|
| T/CSAE 244-2021 (Group Standard) | 25 mm | 10 kg | 120 J |
| DB311 (Draft) | Area ≥ 25,000 mm² | 10 kg | 120 J |
| OEM 1 | 25 mm | 17.8 kg | 120 J |
| OEM 2 | 25 mm | – | 300 J |
| OEM 3 | 50 mm | – | 30 kN Force (Z-direction) |
| OEM 4 | 25 mm | – | 300 J |
Previous research on cell modeling has explored various approaches. Detailed multi-layer models explicitly represent all internal components (anode, cathode, separator, etc.) and are excellent for studying failure mechanisms but are computationally prohibitive for full EV battery pack simulations. On the other end, fully homogenized models are computationally efficient but lack the resolution to predict local shell failure or detailed deformation patterns. For bottom impact simulation of an EV battery pack, the model must accurately capture the local shell buckling and plastic deformation, the subsequent interaction with and compression of the cell jellyroll, and the potential for coolant plate rupture. The Representative Volume Element (RVE) model offers a compelling middle ground—it simplifies the internal complexity while retaining the essential mechanical characteristics of the cell’s key structural components: the casing, the top cap, and the jellyroll.
The primary objective of this work is to establish and validate a robust simulation workflow. This involves: 1) Conducting cell-level bottom impact tests to generate validation data; 2) Developing and calibrating a prismatic cell RVE model against these tests; 3) Building a full EV battery pack model incorporating the validated cell RVE; 4) Validating the pack-level model against physical battery pack impact tests; and 5) Utilizing the validated model to study the influence of impact location on the EV battery pack’s response, thereby guiding future test planning.
Cell-Level Bottom Impact Test and RVE Model Development
The foundation of a reliable EV battery pack simulation is an accurate cell model. We began with experimental characterization of a commercial prismatic lithium-ion cell. The cell was inverted and rigidly fixed. A spherical impactor with a diameter of 25 mm and a mass of 10 kg was dropped from specified heights to strike the center and edge of the cell’s bottom surface, as outlined in Table 2. The impact energy \(E\) is given by the potential energy formula:
$$E = m g h$$
where \(m\) is the mass of the impactor (10 kg), \(g\) is gravitational acceleration (9.81 m/s²), and \(h\) is the drop height. Post-impact, cells were monitored for thermal events or leakage, and the permanent (residual) deformation of the cell bottom was measured.
| Test ID | Drop Height \(h\) (m) | Impact Energy \(E\) (J) | Impact Location |
|---|---|---|---|
| 1 | 0.7 | 68.6 | Cell Bottom Center |
| 2 | 0.7 | 68.6 | Cell Bottom Edge |
| 3 | 1.2 | 117.6 | Cell Bottom Center |
Based on the mechanics of bottom impact, the cell’s internal components like the electrolyte and tabs have negligible influence on the local structural deformation response. Therefore, the cell RVE model was constructed using three key parts: the steel casing (with non-uniform thickness for side walls and bottom), the top cap assembly (simplifying tabs and insulation), and a homogenized jellyroll block. The casing and top cap were modeled with shell elements (3-4 mm size) and connected via shared nodes at the weld seam. The jellyroll was modeled with solid elements (4-5 mm size) and tied to the inner surfaces of the casing side walls.
Critical to the model’s accuracy is the material definition. Tensile tests at quasi-static and high strain rates were performed on samples extracted from the cell casing’s bottom and side walls to calibrate a rate-sensitive plastic material model, often a Cowper-Symonds or Johnson-Cook model. The stress-strain relationship can be expressed as:
$$\sigma_y(\epsilon_p, \dot{\epsilon}_p) = \sigma_0(\epsilon_p) \cdot \left(1 + \left(\frac{\dot{\epsilon}_p}{C}\right)^{1/p} \right)$$
where \(\sigma_y\) is the dynamic yield stress, \(\sigma_0\) is the static yield stress, \(\epsilon_p\) is the plastic strain, \(\dot{\epsilon}_p\) is the plastic strain rate, and \(C\) and \(p\) are material parameters determined from tests. The constitutive model for the homogenized jellyroll was calibrated iteratively by matching the force-displacement and final deformation response from the cell-level simulation to the experimental data. A summary of the material modeling approach is provided in Table 3.
| Component | Element Type | Material Model Calibration | Key Characteristics |
|---|---|---|---|
| Casing | Shell | High-speed tensile tests on actual cell can samples. | Rate-dependent plasticity, non-uniform thickness. |
| Top Cap | Shell | Standard steel properties, simplified geometry. | Represents structural stiffness of top assembly. |
| Jellyroll | Solid | Iterative calibration against cell impact test data. | Homogenized, crushable foam-like behavior. |
Simulations of the cell-level tests were conducted using the explicit nonlinear finite element code LS-DYNA. The impactor was modeled as a rigid sphere with an initial velocity \(v_0 = \sqrt{2gh}\). Contact was defined between the impactor and the cell casing. The correlation between test and simulation results for residual deformation was excellent, with discrepancies consistently below 0.5 mm. This validated the cell RVE model’s capability to predict local bottom deformation under high-speed impact, forming a reliable building block for the EV battery pack model.
EV Battery Pack Level Test and Model Validation
Following the group standard T/CSAE 244-2021, bottom impact tests were performed on a complete EV battery pack. The same spherical impactor (25 mm, 10 kg) was propelled vertically upward with an energy of 120 J (\(v_0 \approx 4.90 \, \text{m/s}\)). Three critical locations on the pack underbody were selected, representing different structural support conditions: Position 1 (between cell and side rail, no cell underneath), Position 2 (center of a central cell), and Position 3 (edge of a cell). Post-test, the pack was monitored for 2 hours, checked for electrical insulation and coolant leakage, and then disassembled to measure permanent deformations of the bottom plate, coolant plate, and affected cells.
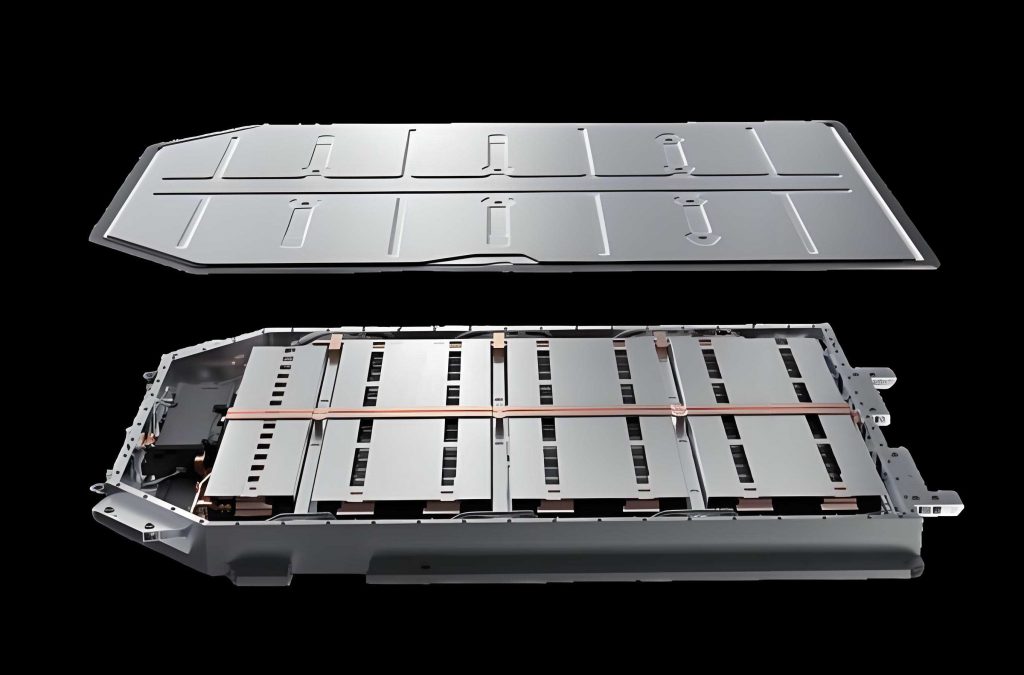
The full EV battery pack finite element model was constructed by integrating the validated cell RVE models into the detailed pack assembly, which included the tray, modules, busbars, bottom protective plate, and cooling plate (cold plate). The model contained approximately 3.05 million elements. The cooling plate and bottom protection plate mesh was refined to 3 mm at potential impact zones. The pack was constrained at its mounting points to a rigid fixture, and the impactor was modeled identically to the cell-level simulations.
The failure criteria for the simulation were derived from the test acceptance criteria. Electrical failure (internal short circuit) was correlated with excessive plastic strain or deformation of the cell casing/jellyroll. Coolant leakage was assessed by evaluating the plastic strain in the cooling plate against the material’s failure limit. The simulation successfully predicted no coolant plate rupture for all three impact locations, aligning with the test results where no leakage occurred.
The quantitative validation of structural deformation is presented in Table 4. The correlation between simulation and experiment is highly satisfactory. For the most critical component—the cell—the residual deformation error was less than 0.5 mm. For the structural components of the EV battery pack, namely the bottom plate and cooling plate, the maximum deformation error was under 1.5 mm. Notably, the simulation tended to predict slightly larger deformations than the test, providing a conservative and thus safer prediction for design evaluation.
| Impact Position | Component | Residual Deformation – Test (mm) | Residual Deformation – CAE (mm) | Difference (mm) |
|---|---|---|---|---|
| 1 (No Cell) | Cooling Plate | 6.28 | 6.62 | +0.34 |
| Bottom Plate | 8.53 | 9.47 | +0.94 | |
| Cell | N/A | N/A | N/A | |
| 2 (Cell Center) | Cooling Plate | 6.86 | 6.99 | +0.13 |
| Bottom Plate | 6.91 | 7.35 | +0.44 | |
| Cell | 2.15 | 2.51 | +0.36 | |
| 3 (Cell Edge) | Cooling Plate | 5.79 | 7.07 | +1.28 |
| Bottom Plate | 5.76 | 7.01 | +1.25 | |
| Cell | 1.84 | 1.74 | -0.10 |
Influence of Impact Location and Simulation-Driven Test Planning
With the validated EV battery pack model, we can conduct virtual investigations that are costly or time-consuming physically. A key advantage is the ability to rapidly assess the sensitivity of the pack’s response to impact location. This is crucial because the real-world impact point is unpredictable. We performed simulations at five distinct locations (LOC1 to LOC5) across the pack underbody, including central vs. edge cells and pack center vs. pack periphery.
The results clearly identified a risk gradient. Impacts on the center of a cell (LOC1, LOC2) consistently caused greater cell indentation than impacts near the cell edge (LOC3, LOC4), due to the reduced bending stiffness at the cell’s central region. Furthermore, impacts in the central region of the EV battery pack (LOC1, LOC3, LOC5) were more severe than those near the pack’s stiffened perimeter, as the central area has less overall structural support from the pack frame. The location yielding the maximum cell residual deformation (LOC1—center of a central cell) would be the prime candidate for the most severe physical certification test. This demonstrates how simulation can strategically guide test planning by identifying worst-case scenarios, ensuring the EV battery pack is challenged effectively and resources are used optimally.
The stress state in the cell casing at the moment of peak deformation can be analyzed to understand the risk of rupture. The von Mises stress \(\sigma_{vm}\) is a useful metric:
$$\sigma_{vm} = \sqrt{\frac{(\sigma_1 – \sigma_2)^2 + (\sigma_2 – \sigma_3)^2 + (\sigma_3 – \sigma_1)^2}{2}}$$
where \(\sigma_1, \sigma_2, \sigma_3\) are the principal stresses. By comparing \(\sigma_{vm}\) to the casing material’s dynamic failure strength across different impact locations, engineers can map the probability of shell breach and resultant internal short circuit risk for the entire EV battery pack underbody.
Conclusion and Future Outlook
This study presents a comprehensive, validated methodology for simulating bottom spherical impact on EV battery packs. The core achievement is the development of a prismatic cell Representative Volume Element (RVE) model, which accurately captures local deformation under high-speed loading while maintaining computational efficiency suitable for full pack analysis. The cell RVE model was validated at the component level, showing a residual deformation error of less than 0.5 mm compared to physical tests.
Integrating this cell model into a detailed EV battery pack finite element model yielded a powerful predictive tool. The pack-level model was rigorously validated against standard 120 J bottom impact tests, demonstrating excellent correlation for cell deformation (<0.5 mm error) and pack structural component deformation (<1.5 mm error). The model also correctly predicted the absence of coolant leakage. Furthermore, the application of the validated model to study impact location sensitivity provided valuable insights for optimizing physical test plans, identifying the geometric center of centrally located cells as the most critical impact point.
The established RVE modeling approach, while demonstrated here for prismatic cells, is conceptually transferable to other cell formats like pouch or cylindrical cells used in EV battery packs, with appropriate adjustments to the homogenized core model and shell properties. The validated full-pack model serves as a foundation for future work, including virtual design optimization of the bottom protection system (materials, thickness, geometry), exploration of higher impact energy thresholds, and evaluation of different threat geometries (e.g., sharper stones, curb profiles). By enabling accurate, physics-based virtual testing, this methodology significantly contributes to the accelerated and robust development of safer EV battery packs, reducing reliance on costly physical prototypes and ensuring higher safety standards for electric vehicles.