
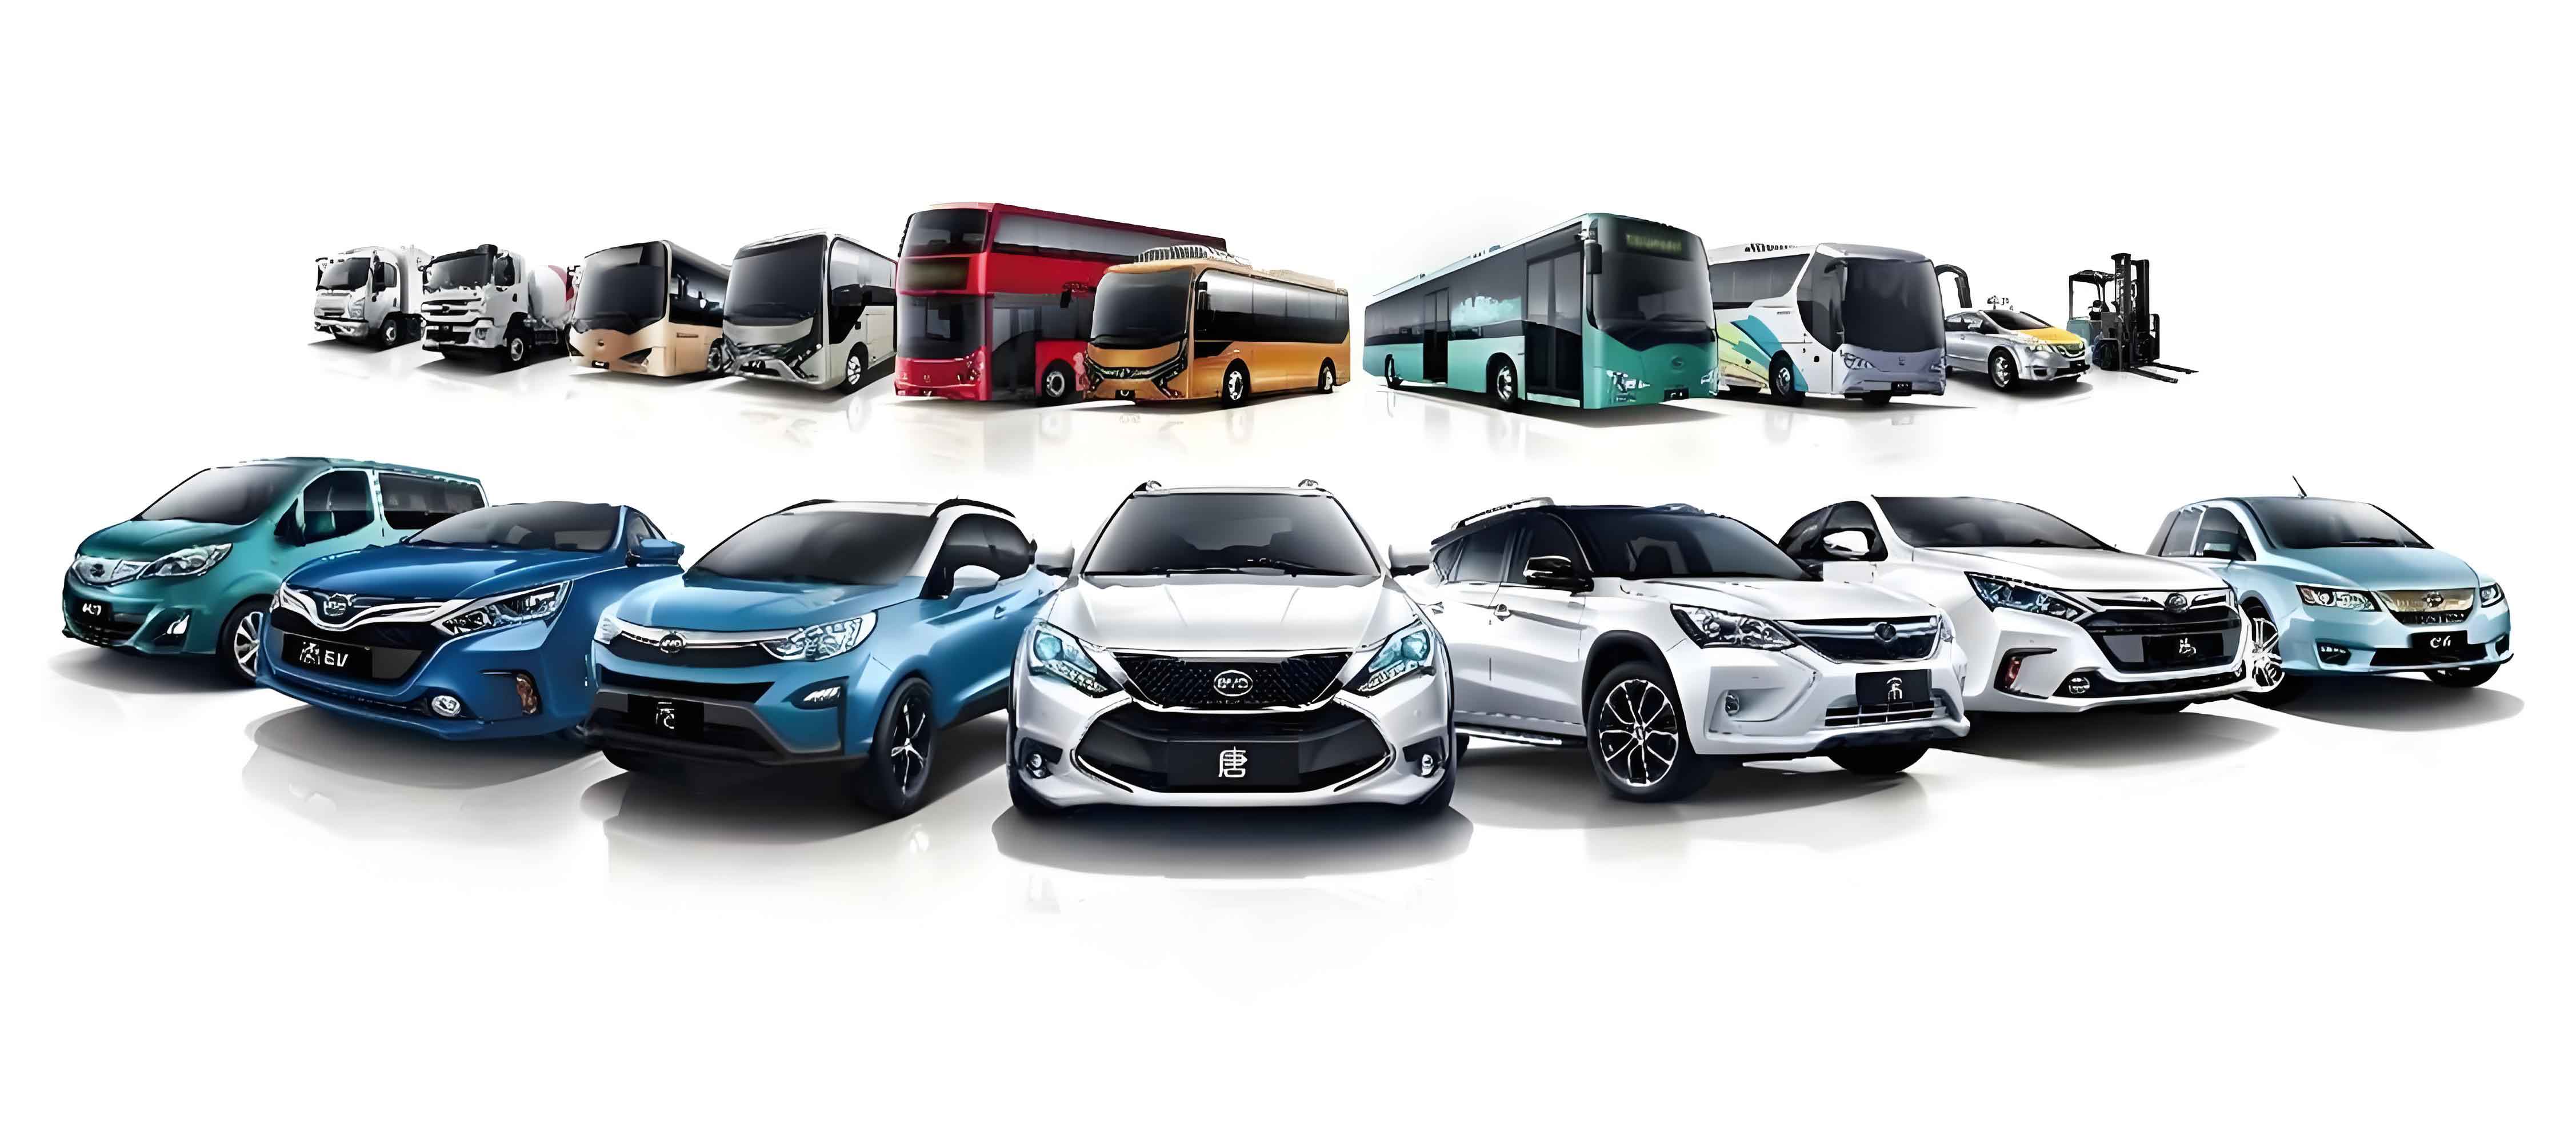
Abstract
The rapid growth of the electric vehicle industry has created a serious end-of-life challenge for power batteries. I study how government subsidies affect the operational decisions of an electric vehicle battery supply chain when the battery supplier, the electric vehicle manufacturer, and a third-party recycler act in a Stackelberg game. I compare three subsidy designs: a demand-side production subsidy given to the battery supplier, a quantity-based recycling subsidy given to the third-party recycler, and a battery-capacity-based recycling subsidy given to the third-party recycler. Using a stylized game-theoretic model, I characterize the equilibrium wholesale price, battery capacity, retail price, recovery effort, and recovery fee. I then compare profits, demand, recovery quantities, and social welfare across the three regimes. The results show that a positive production subsidy raises battery capacity, consumer demand, manufacturer profit, and supplier profit, while a recycling subsidy raises collection effort, recovery quantity, and recycler profit. Social welfare is decreasing in the retail-price sensitivity parameter. In the production-subsidy regime, social welfare increases as the per-unit subsidy becomes larger and eventually overtakes the social welfare in the two recycling-subsidy regimes. I also consider two extensions: first, the electric vehicle manufacturer acts as the Stackelberg leader; second, the electric vehicle manufacturer merges with the battery supplier at a fixed cost. Both extensions provide new insights into the governance of electric vehicle battery supply chains.
Keywords: electric vehicle; power battery; battery recycling; production subsidy; recycling subsidy; supply chain operations; social welfare.
1. Introduction
In recent years, the global movement toward low-carbon transportation has accelerated the adoption of new energy electric vehicles. Many countries have witnessed a dramatic increase in electric vehicle sales, and manufacturers are investing aggressively in battery technology, charging infrastructure, and vehicle platforms. While this development reduces dependence on fossil fuels and mitigates tailpipe emissions, it also creates a hidden environmental problem: the retired power battery. The average lifespan of a power battery used in an electric vehicle is only five to eight years. When battery capacity drops below 70% to 80% of its initial value, the battery may no longer be safe enough for vehicle use. In some cases, such batteries can cause braking failure, thermal runaway, or fire. Consequently, the growing stock of retired power batteries has become a strategic concern for electric vehicle manufacturers, policymakers, and the broader society.
Recycling is recognized as an essential response to the retired-battery challenge. A retired power battery still contains valuable metals and can be used in echelon applications, but recycling is expensive. The formal recycling rate of power batteries from electric vehicles is still low, partly because detecting residual capacity and dismantling battery packs is costly, and partly because consumers and recyclers lack adequate incentives. In practice, some governments have begun to subsidize battery collection. For instance, a local government may pay an electric vehicle manufacturer one thousand yuan for each retired traction battery that is formally collected, which is equivalent to a subsidy on the number of collected batteries. Another approach is to reward recyclers according to the electric capacity of the retired battery, such as a subsidy per kilowatt-hour of recovered battery capacity. These two recycling-subsidy designs are not identical: the first encourages the quantity of returns, while the second encourages both quantity and residual quality of returns. At the same time, governments also have a long tradition of subsidizing upstream manufacturing through a demand-based production subsidy. Such a subsidy lowers the supplier’s effective cost for every unit of electric vehicle battery sold and is expected to stimulate output, battery-capacity investment, and the expansion of the electric vehicle market.
In this article, I investigate the following research questions. What are the equilibrium operational decisions of the battery supplier, the electric vehicle manufacturer, and the third-party recycler under different subsidy regimes? Who benefits most from a demand-based production subsidy versus a quantity-based or capacity-based recycling subsidy? Which subsidy design is better from the perspective of consumer demand, recycling volume, profitability, and social welfare? To answer these questions, I construct a stylized supply chain in which a battery supplier sells power batteries to an electric vehicle manufacturer, while a third-party recycler collects retired batteries and delivers them back to the supplier. The supplier produces batteries with a chosen capacity level. The electric vehicle manufacturer produces final electric vehicles and sells them to consumers. The recycler chooses the recovery fee paid to consumers and the recovery effort. Government intervention is represented by one of three subsidy coefficients. I solve the model by backward induction and compare the three equilibrium outcomes.
This study makes several contributions. First, unlike much of the prior literature that considers only a recycling subsidy or only a production subsidy, I compare three different subsidy structures in a unified framework. Second, I explicitly embed the power battery’s key attribute, capacity, into the demand side and into the recycling subsidy. Consumers care about battery capacity because it determines the driving range of the electric vehicle; recyclers receiving a capacity-based subsidy must also consider the residual capacity of returned batteries. Third, I move beyond firm profits and evaluate social welfare, including consumer surplus and government expenditure. Fourth, I analyze two possible supply-chain scenarios that may emerge in the future: a manufacturer-led Stackelberg game and a manufacturer-supplier merger with a fixed transfer fee.
The remainder of the article is organized as follows. Section 2 describes the model, assumptions, profit functions, and game sequence. Section 3 reports the equilibrium solutions and the main analytical comparisons. Section 4 presents numerical and social-welfare analysis. Section 5 extends the model by changing the leadership structure and by considering a manufacturer-supplier merger. Section 6 concludes with managerial implications and policy recommendations.
2. Literature Background
This research is related to two streams of literature: power-battery recycling in electric vehicle supply chains and subsidy policies in closed-loop supply chains.
Prior studies of electric vehicle battery recycling have focused on the design of take-back channels, the comparison of centralized versus decentralized recycling, and the role of third-party recyclers in closed-loop supply chains. Many of these studies show that recycling mode selection depends on the cost of collection, the competitive intensity between recyclers, and the government’s reward-penalty mechanism. These studies are highly relevant because they identify which channel members should collect used electric vehicle batteries and how collection effort should be coordinated. However, most of them model the government only as a source of a fixed subsidy or a single recovery subsidy, and they seldom compare subsidies that are based on battery capacity rather than collection quantity.
The second stream studies government subsidies in green and low-carbon supply chains. It has been shown that subsidies can reduce retail prices, expand demand, improve recycler profits, and incentivize green technology investment. Some researchers examine whether the government should subsidize manufacturers, retailers, or third-party recyclers. The general finding is that the identity of the subsidy recipient matters because different recipients have different strategic positions in the supply chain. In the context of electric vehicle batteries, production subsidies and recycling subsidies may produce different effects on the upstream battery supplier, the downstream electric vehicle manufacturer, and the third-party recycler. Yet few existing studies jointly consider demand-based production subsidies, quantity-based recycling subsidies, and capacity-based recycling subsidies.
The contribution of this article is therefore both thematic and analytical. I not only compare different subsidy recipients but also introduce a battery-capacity dimension into both the demand function and the recycling-subsidy formula. In addition, I combine the profit analysis with social-welfare analysis, which is important because subsidies involve public funds. My extensions on leadership and integration also capture important dynamics in the electric vehicle industry, where manufacturers increasingly seek control over battery supply chains.
3. Model Description
3.1 Supply chain structure and assumptions
I analyze a closed-loop supply chain consisting of one battery supplier, one electric vehicle manufacturer, one third-party recycler, and consumers. The battery supplier produces new power batteries with a certain capacity level and sells them to the electric vehicle manufacturer. The electric vehicle manufacturer assembles the batteries into electric vehicles and sells the vehicles to consumers. At the end of life of an electric vehicle battery, the third-party recycler collects retired batteries from consumers by paying a recovery fee and exerting recovery effort. The collected batteries are transferred to the battery supplier at an exogenous buyback price \(b\). This buyback price is higher than the recovery fee paid by the recycler, which ensures that the recycler has an economic incentive to collect used electric vehicle batteries.
The market demand for electric vehicles depends on the retail price and on the performance of the battery. I assume that demand is linear and is written as
$$
D = \alpha – \beta p + k h,
$$
where \(\alpha\) represents the potential market size, \(\beta\) is the sensitivity of demand to the retail price, \(k\) represents consumers’ preference for battery capacity, and \(h\) is the battery capacity installed in the electric vehicle. A larger \(k\) means that consumers value driving range and battery performance more heavily. Since increasing battery capacity is costly, the supplier faces a research and development cost. Following common practice in green technology and product innovation models, I assume a convex cost function
$$
C_h = \frac{c_h h^2}{2},
$$
where \(c_h\) is the battery-capacity research and development cost coefficient. This quadratic form captures the diminishing returns of capacity improvement.
On the recycling side, the number of returned retired batteries is determined by the recovery fee paid to consumers and the recovery effort made by the recycler:
$$
Q = Q_0 + \lambda p_r + \gamma e,
$$
where \(Q_0\) is the number of consumers who return old electric vehicle batteries without any monetary incentive, \(\lambda\) measures the sensitivity of returns to the recovery fee \(p_r\), and \(\gamma\) measures the sensitivity of returns to recovery effort \(e\). The recycler incurs a recovery-effort cost
$$
C_e = \frac{k_e e^2}{2},
$$
where \(k_e\) is the cost coefficient of recovery effort. The recovery effort includes advertising, collection campaigns, and the labor needed for dismantling and testing the returned battery.
Government intervention is modeled by three subsidy coefficients.
- In the demand-based production subsidy scenario, denoted by \(D\), the government gives the battery supplier a subsidy \(s_d\) for every unit of battery demand. The total subsidy received by the supplier is \(s_d D\).
- In the quantity-based recycling subsidy scenario, denoted by \(Q\), the government gives the third-party recycler a subsidy \(s_q\) for every returned battery. The total subsidy is \(s_q Q\).
- In the capacity-based recycling subsidy scenario, denoted by \(B\), the government gives the third-party recycler a subsidy \(s_h\) per unit of battery capacity of each returned battery. The total subsidy is \(s_h h Q\).
The exact meaning of the symbols used throughout the article is summarized in Table 1.
| Symbol | Definition |
|---|---|
| \(m\) | unit raw-material cost of the power battery |
| \(c_m\) | unit battery manufacturing cost |
| \(c_n\) | unit electric vehicle production cost |
| \(c_h\) | battery-capacity R&D cost coefficient |
| \(k\) | consumer preference coefficient for battery capacity |
| \(\alpha\) | potential market size for electric vehicles |
| \(\beta\) | demand sensitivity to retail price |
| \(b\) | buyback price paid by the supplier for a returned battery |
| \(Q_0\) | number of voluntary returns when the recovery fee is zero |
| \(\lambda\) | sensitivity of return quantity to recovery fee |
| \(\gamma\) | sensitivity of return quantity to recovery effort |
| \(k_e\) | recovery-effort cost coefficient |
| \(s_d\) | unit production-subsidy coefficient |
| \(s_q\) | unit quantity-based recycling-subsidy coefficient |
| \(s_h\) | unit capacity-based recycling-subsidy coefficient |
| \(w\) | wholesale price of the power battery |
| \(p\) | retail price of the electric vehicle |
| \(h\) | battery capacity |
| \(e\) | recovery effort |
| \(p_r\) | recovery fee paid to a consumer by the recycler |
| \(D\) | demand for electric vehicles |
| \(Q\) | quantity of returned retired batteries |
To guarantee interior equilibria, I require \(4\beta c_h – k^2>0\) and \(2\lambda k_e-\gamma^2>0\). These conditions imply that the cost functions are sufficiently convex and that the market is not excessively sensitive to either battery capacity or recovery effort. The condition \(b>p_r\) secures a positive gross margin for the third-party recycler. I also restrict attention to parameter regions in which all equilibrium prices, quantities, and profits are nonnegative.
3.2 Profit functions under three subsidy regimes
The battery supplier, the electric vehicle manufacturer, and the third-party recycler maximize their own profits. The supplier earns revenue from selling batteries to the manufacturer, plus any production-subsidy payment in scenario \(D\). The supplier also pays the buyback cost \(bQ\) for retired batteries received from the recycler and incurs the battery-capacity R&D cost. The manufacturer earns revenue from selling electric vehicles to consumers. The recycler earns the buyback price from the supplier, plus any recycling subsidy, but pays the recovery fee to consumers and incurs the recovery-effort cost.
In the demand-based production subsidy scenario, the profit functions are
$$
\pi_S^D = (w-c_m-m+s_d)D – bQ – \frac{c_h h^2}{2},
$$
$$
\pi_M^D = (p-w-c_n)D,
$$
$$
\pi_R^D = (b-p_r)Q – \frac{k_e e^2}{2}.
$$
In the quantity-based recycling subsidy scenario, the subsidy is paid to the recycler per unit of returned battery. The profit functions are
$$
\pi_S^Q = (w-c_m-m)D – bQ – \frac{c_h h^2}{2},
$$
$$
\pi_M^Q = (p-w-c_n)D,
$$
$$
\pi_R^Q = (b-p_r+s_q)Q – \frac{k_e e^2}{2}.
$$
In the capacity-based recycling subsidy scenario, the recycler receives a subsidy \(s_h h\) for each returned battery. Since battery capacity is \(h\), the total subsidy is \(s_h hQ\). The profit functions are
$$
\pi_S^B = (w-c_m-m)D – bQ – \frac{c_h h^2}{2},
$$
$$
\pi_M^B = (p-w-c_n)D,
$$
$$
\pi_R^B = (b-p_r+s_h h)Q – \frac{k_e e^2}{2}.
$$
3.3 Game sequence
The interaction is modeled as a three-stage Stackelberg game.
- The government announces its subsidy coefficient before the supply chain decisions are made. In the basic model, the subsidy is exogenous and not determined by the government as a strategic player.
- The battery supplier, as the leader, chooses the wholesale price \(w\) and the battery capacity \(h\) to maximize its profit.
- The electric vehicle manufacturer, as the follower, observes \(w\) and \(h\) and chooses the retail price \(p\).
- The third-party recycler observes the supply-chain variables and chooses the recovery effort \(e\) and the recovery fee \(p_r\).
This sequence reflects the fact that battery suppliers often have strong bargaining power in the electric vehicle industry because battery technology and capacity are key strategic decisions made before final vehicle pricing. The recycler is the last mover because collection decisions are made after the new battery supply chain has been established.
4. Equilibrium Analysis
4.1 Preliminaries
I solve the game by backward induction. To present the equilibrium compactly, I define
$$
M = 4\beta c_h – k^2, \quad N = 2\lambda k_e-\gamma^2,
$$
$$
A = \alpha-\beta(c_n-c_m-m), \quad B = \alpha-\beta(c_n+c_m+m).
$$
The condition \(M>0\) guarantees strict concavity of the supplier’s problem with respect to the wholesale price and battery capacity. The condition \(N>0\) guarantees strict concavity of the recycler’s problem with respect to the recovery fee and recovery effort. Under these conditions, there exists a unique interior equilibrium.
4.2 Equilibrium decisions
Table 2 reports the equilibrium wholesale price, battery capacity, retail price, recovery effort, and recovery fee in the three subsidy scenarios.
| Variable | Production subsidy \(D\) | Quantity-based recycling subsidy \(Q\) | Capacity-based recycling subsidy \(B\) |
|---|---|---|---|
| \(w^{*}\) | \(\displaystyle \frac{2(A-s_d\beta)c_h-(c_m+m-s_d)k^2}{M}\) | \(\displaystyle \frac{2Ac_h-(c_m+m)k^2}{M}\) | \(\displaystyle \frac{2Ac_h-(c_m+m)k^2}{M}\) |
| \(h^{*}\) | \(\displaystyle \frac{k(B+s_d\beta)}{M}\) | \(\displaystyle \frac{kB}{M}\) | \(\displaystyle \frac{kB}{M}\) |
| \(p^{*}\) | \(\displaystyle \frac{\alpha+kh^{D*}+\beta(c_n+w^{D*})}{2\beta}\) | \(\displaystyle \frac{\alpha+kh^{Q*}+\beta(c_n+w^{Q*})}{2\beta}\) | \(\displaystyle \frac{\alpha+kh^{B*}+\beta(c_n+w^{B*})}{2\beta}\) |
| \(e^{*}\) | \(\displaystyle \frac{\gamma(Q_0+b\lambda)}{N}\) | \(\displaystyle \frac{\gamma[Q_0+(b+s_q)\lambda]}{N}\) | \(\displaystyle \frac{\gamma[Q_0+(b+s_hh^{B*})\lambda]}{N}\) |
| \(p_r^{*}\) | \(\displaystyle b-\frac{(Q_0+b\lambda)k_e}{N}\) | \(\displaystyle b+s_q-\frac{[Q_0+(b+s_q)\lambda]k_e}{N}\) | \(\displaystyle b+s_hh^{B*}-\frac{[Q_0+(b+s_hh^{B*})\lambda]k_e}{N}\) |
The equilibrium expressions show that the production subsidy directly shifts the wholesale price and battery-capacity decisions of the supplier. In the two recycling-subsidy scenarios, the upstream battery variables are identical because the recycler’s subsidy does not enter the supplier’s first-order conditions directly. However, the battery capacity selected by the supplier influences the actual subsidy received by the recycler in the capacity-based subsidy scenario \(B\). This creates an indirect link between the supplier’s capacity decision and the recycler’s collection decision.
Table 3 reports the equilibrium demand, collection quantity, manufacturer profit, recycler profit, consumer surplus, and government expenditure in the three regimes.
| Outcome | Production subsidy \(D\) | Quantity-based recycling subsidy \(Q\) | Capacity-based recycling subsidy \(B\) |
|---|---|---|---|
| \(D^{*}\) | \(\displaystyle \frac{\beta c_h(B+s_d\beta)}{M}\) | \(\displaystyle \frac{\beta c_hB}{M}\) | \(\displaystyle \frac{\beta c_hB}{M}\) |
| \(Q^{*}\) | \(\displaystyle \frac{\lambda k_e(Q_0+b\lambda)}{N}\) | \(\displaystyle \frac{\lambda k_e[Q_0+(b+s_q)\lambda]}{N}\) | \(\displaystyle \frac{\lambda k_e(Q_0+b\lambda)}{N}+\frac{\lambda k_e(k s_h B\lambda)}{MN}\) |
| \(\pi_M^{*}\) | \(\displaystyle \frac{\beta c_h^2(B+s_d\beta)^2}{M^2}\) | \(\displaystyle \frac{\beta c_h^2B^2}{M^2}\) | \(\displaystyle \frac{\beta c_h^2B^2}{M^2}\) |
| \(\pi_R^{*}\) | \(\displaystyle \frac{k_e(Q_0+b\lambda)^2}{2N}\) | \(\displaystyle \frac{k_e[Q_0+(b+s_q)\lambda]^2}{2N}\) | \(\displaystyle \frac{k_e[k s_hB\lambda+M(Q_0+b\lambda)]^2}{2NM^2}\) |
| \(CS^{*}\) | \(\displaystyle \frac{c_h^2\beta(B+s_d\beta)^2}{2M^2}\) | \(\displaystyle \frac{c_h^2\beta B^2}{2M^2}\) | \(\displaystyle \frac{c_h^2\beta B^2}{2M^2}\) |
| Government expenditure | \(s_dD^{D*}\) | \(s_qQ^{Q*}\) | \(s_h h^{B*}Q^{B*}\) |
The supplier’s equilibrium profit in the production-subsidy scenario is
$$
\pi_S^{D*}=(w^{D*}-c_m-m+s_d)D^{D*}-bQ^{D*}-\frac{c_h}{2}(h^{D*})^2,
$$
and in the two recycling-subsidy scenarios it is
$$
\pi_S^{Q*}=(w^{Q*}-c_m-m)D^{Q*}-bQ^{Q*}-\frac{c_h}{2}(h^{Q*})^2,
$$
$$
\pi_S^{B*}=(w^{B*}-c_m-m)D^{B*}-bQ^{B*}-\frac{c_h}{2}(h^{B*})^2.
$$
In the no-subsidy benchmark where \(s_d=s_q=s_h=0\), the three regimes coincide, and the equilibrium reduces to the same decentralized outcome. This benchmark is useful for the extensions in Section 6.
5. Results and Comparisons
5.1 Sensitivity of the equilibrium
I first analyze how the equilibrium responds to the battery-capacity R&D cost coefficient and to consumer preferences. Corollary 1 summarizes the main sensitivity results.
Corollary 1. In every subsidy regime, a larger battery-capacity R&D cost coefficient \(c_h\) reduces consumer demand for electric vehicles and reduces the electric vehicle manufacturer’s profit. In contrast, a larger consumer preference coefficient \(k\) for battery capacity increases consumer demand and the manufacturer’s profit.
Formally,
$$
\frac{\partial D^{i*}}{\partial c_h}<0,\quad \frac{\partial D^{i*}}{\partial k}>0,\quad \frac{\partial \pi_M^{i*}}{\partial c_h}<0,\quad \frac{\partial \pi_M^{i*}}{\partial k}>0,
$$
where \(i\in\{D,Q,B\}\). The intuition is that higher battery capacity increases consumers’ willingness to pay and expands the market for electric vehicles. But battery capacity is costly to develop. A higher R&D cost coefficient makes it more expensive for the battery supplier to improve capacity, which ultimately reduces demand and dampens the manufacturer’s profit. This tension is central to the electric vehicle supply chain. Manufacturers and suppliers must balance the positive market effect of high-capacity batteries against the negative cost effect of capacity R&D.
From a managerial perspective, battery suppliers and electric vehicle manufacturers should invest in product innovation that raises capacity without inflating R&D expenditure. They should also monitor consumer preferences closely, because a growing preference for range and fast charging increases the strategic value of capacity improvement. Government subsidies can amplify this effect by lowering the effective cost of high-capacity batteries, thereby encouraging suppliers to offer products that better match consumer preferences.
Corollary 2. In every subsidy regime, the quantity of returned retired batteries and the profit of the third-party recycler are increasing in the voluntary return base \(Q_0\) and in the recovery-effort sensitivity coefficient \(\gamma\). When the return-fee sensitivity coefficient \(\lambda\) is sufficiently high, the collection quantity and recycler profit are also increasing in \(\lambda\).
The monotonic effects of \(Q_0\) and \(\gamma\) come from two sources. First, a larger free-return base reduces the difficulty of achieving a given collection target. Second, stronger recovery-effort sensitivity means that the same recovery effort generates more returned batteries, which improves the efficiency of the recycler. Subsidies to the recycler strengthen this incentive and make the recycling business more attractive. From a policy point of view, the government should not rely only on subsidies; it should also educate consumers about the importance of returning retired electric vehicle batteries, because a larger voluntary-return base makes the entire recycling system more cost effective.
5.2 Production subsidy versus recycling subsidy
One important question is whether a subsidy should support upstream production and capacity or downstream recycling. Proposition 1 highlights the asymmetric effect.
Proposition 1. When the production subsidy is positive, the equilibrium battery capacity in the production-subsidy regime is larger than the equilibrium battery capacity in the two recycling-subsidy regimes; formally, \(h^{D*}>h^{Q*}=h^{B*}\). In contrast, recycling subsidies improve recovery decisions: the recovery effort and recovery fee are both higher in the recycling-subsidy regimes than in the production-subsidy regime, that is, \(e^{D*}<\min\{e^{Q*},e^{B*}\}\) and \(p_r^{D*}<\min\{p_r^{Q*},p_r^{B*}\}\).
This result is intuitive but has an important nuance. Receiving a production subsidy lowers the effective unit production cost of batteries. The supplier becomes willing to invest more aggressively in battery-capacity improvement because each unit sold generates a higher contribution margin. The resulting high-capacity battery increases consumers’ willingness to pay and stimulates electric vehicle demand. In contrast, a recycling subsidy changes the economics of collection but has no direct effect on the supplier’s marginal production cost. Therefore, recycling subsidies do not encourage the supplier to raise battery capacity.
At the same time, recycling subsidies are more direct instruments for improving recycling performance. The quantity-based subsidy and the capacity-based subsidy both increase the recycler’s effective margin, inducing the recycler to pay consumers a higher recovery fee and to exert more recovery effort. Which of the two recycling-subsidy policies leads to a higher recovery fee depends on the relative magnitude of \(s_q\) and \(s_h\). In particular, as \(s_q\) becomes larger, the quantity-based subsidy becomes more attractive to the recycler; as \(s_h\) becomes larger, the capacity-based subsidy becomes more attractive because it encourages the recycler to seek batteries with higher residual capacity.
Proposition 2. A positive production subsidy raises the demand for electric vehicles and increases both the manufacturer’s profit and the supplier’s profit relative to the recycling-subsidy regimes. A recycling subsidy increases the collection quantity and the recycler’s profit relative to the production-subsidy regime. The comparison between the two recycling-subsidy regimes depends on the relative values of \(s_q\) and \(s_h\).
Formally, when \(s_d>0\),
$$
D^{D*}>D^{Q*}=D^{B*}, \quad \pi_M^{D*}>\pi_M^{Q*}=\pi_M^{B*}, \quad \pi_S^{D*}>\max\{\pi_S^{Q*},\pi_S^{B*}\}.
$$
When \(s_q>0\) and \(s_h>0\), the collection quantity in either recycling-subsidy regime exceeds that in the production-subsidy regime, and consequently
$$
\pi_R^{D*}<\min\{\pi_R^{Q*},\pi_R^{B*}\}.
$$
These profit comparisons reveal a clear distributional consequence of subsidy design. If the objective is to strengthen upstream supply chains, stimulate electric vehicle demand, and improve the profitability of battery suppliers and electric vehicle manufacturers, then a demand-based production subsidy is the most powerful policy. If the objective is to increase the collection of retired batteries and support independent recyclers, then a recycling subsidy targeting the third-party recycler is more effective. Because the two policy goals are different, no single subsidy dominates universally. The government must decide whether its primary concern is the growth of the electric vehicle market or the environmental burden of retired batteries.
5.3 Social welfare comparison
Firm-level comparisons are not sufficient to evaluate government intervention because subsidies constitute a transfer from taxpayers to supply-chain members. I therefore define social welfare as the sum of the supply chain profit and consumer surplus minus the government’s subsidy expenditure:
$$
SW^{i} = \pi_S^{i}+\pi_M^{i}+\pi_R^{i}+CS^{i}-GS^{i},\quad i\in\{D,Q,B\},
$$
where consumer surplus is
$$
CS^{i}=\frac{(D^{i})^2}{2\beta}.
$$
In the production-subsidy regime, government expenditure is \(GS^{D}=s_dD^{D*}\). In the quantity-based recycling-subsidy regime, it is \(GS^{Q}=s_qQ^{Q*}\). In the capacity-based recycling-subsidy regime, it is \(GS^{B}=s_hh^{B*}Q^{B*}\).
Because closed-form welfare comparisons are algebraically complex, I supplement the analytical results with a numerical analysis. Table 4 reports the default parameter values used in the simulation.
| \(m=0.38\) | \(c_m=0.43\) | \(c_n=0.86\) | \(b=0.45\) |
| \(\alpha=2.5\) | \(k=0.52\) | \(k_e=1.30\) | \(Q_0=0.14\) |
| \(\lambda=0.40\) | \(c_h=0.48\) | \(\gamma=0.11\) | \(\beta\in[0.4,0.8]\) |
| \(s_d\in\{-0.4,0,0.4\}\) | \(s_q=0.60\) | \(s_h=0.45\) |
By setting \(s_d=-0.4\), I model a tax on production rather than a subsidy. By setting \(s_d=0\), I model an absence of production intervention. By setting \(s_d=0.4\), I model a positive demand-based production subsidy.
The simulation leads to the following observations.
Observation 1. In all three subsidy regimes, social welfare decreases as the retail-price sensitivity \(\beta\) increases. A more price-sensitive consumer base reduces the ability of the electric vehicle manufacturer to maintain margins. Market demand becomes more volatile, and the supply chain cannot easily pass through the cost of battery capacity and collection effort to consumers. As a result, supply-chain profit and social welfare fall.
Observation 2. Under a negative production subsidy, that is, a tax on battery production, social welfare in the production-subsidy regime is lower than the social welfare in either recycling-subsidy regime. This finding is at first sight surprising because a tax generates public revenue. However, the tax also raises the effective cost of the supplier and the electric vehicle manufacturer, suppresses demand for electric vehicles, and reduces upstream profits. The net welfare loss caused by lower demand more than offsets the direct tax revenue.
Observation 3. As the production subsidy changes from negative to zero and then to positive, social welfare in the production-subsidy regime increases monotonically. When the production subsidy is positive and sufficiently large, it yields higher social welfare than the two recycling-subsidy regimes. The reason is that the production subsidy lowers the final retail price of electric vehicles, expands consumer access, encourages investment in battery capacity, and raises supplier and manufacturer profits. Although the subsidy requires public expenditure, the resulting gains in demand and supply-chain profitability can dominate the subsidy cost.
Table 5 summarizes the qualitative social-welfare rankings implied by the numerical analysis.
| Value of \(s_d\) | Interpretation | Social-welfare ranking |
|---|---|---|
| \(s_d=-0.4\) | Production tax | \(SW^{D*}<\min\{SW^{Q*},SW^{B*}\}\) |
| \(s_d=0\) | No production intervention | The welfare gap between \(D\) and the recycling regimes narrows. |
| \(s_d=0.4\) | Production subsidy | \(SW^{D*}>\max\{SW^{Q*},SW^{B*}\}\) |
These results have clear policy implications. If the government has already committed to a battery-supply-chain subsidy program, a positive demand-based production subsidy appears to be the most effective instrument for raising social welfare, at least within the range of parameters considered. However, the capacity-based and quantity-based recycling subsidies may be socially valuable when the government’s objective is to improve the environmental performance of the electric vehicle sector rather than simply to maximize current social welfare.
6. Extensions
Two additional scenarios can change the conclusions. First, in practice, some electric vehicle manufacturers have become dominant in their supply chains and may act as Stackelberg leaders rather than followers. Second, leading electric vehicle manufacturers may vertically integrate with battery suppliers to secure capacity, reduce double marginalization, and coordinate investment in battery capacity. I analyze both cases below.
6.1 Electric vehicle manufacturer as the Stackelberg leader
In the base model, the battery supplier leads the Stackelberg game. I now reverse this order. The supply chain is the same, but the sequence becomes:
- The electric vehicle manufacturer first commits to its margin over the wholesale price, denoted by \(z=p-w\).
- The battery supplier observes \(z\), then chooses \(w\) and \(h\).
- The third-party recycler chooses \(e\) and \(p_r\).
In this extension, I consider the benchmark without government subsidy, since the purpose is to identify the pure effect of changing the leader. Let the superscript \(N\) denote the no-subsidy benchmark. The manufacturer’s profit in the manufacturer-led game is
$$
\pi_M^{L,N}=(z-c_n)D,
$$
where \(D=\alpha-\beta(w+z)+kh\). The supplier solves its problem taking \(z\) as given, and the recycler continues to maximize its profit at the last stage. Solving this game by backward induction yields the following proposition.
Proposition 3. The electric vehicle manufacturer always earns a higher profit when it acts as the Stackelberg leader than when it is a follower in the no-subsidy benchmark. If consumers’ preference for battery capacity is sufficiently strong, meaning
$$
k^2>\frac{4\beta c_h}{3},
$$
then the battery supplier is also better off when the electric vehicle manufacturer becomes the leader. In addition, social welfare under manufacturer leadership exceeds social welfare under supplier leadership.
The intuition is that the manufacturer, by moving first, internalizes part of the double-marginalization problem. When the manufacturer is the leader, it can choose a margin that induces the supplier to price more moderately. Because the manufacturer directly observes the retail margin before the supplier sets the wholesale price, the manufacturer avoids a myopic retail-pricing decision. The supplier may benefit from manufacturer leadership when consumers value battery capacity strongly. In that case, the manufacturer has an incentive to request a high-capacity battery, and the supplier’s investment is rewarded by stronger demand. However, if consumers do not value capacity highly, the manufacturer may squeeze the supplier by committing to a narrow margin, and the supplier is worse off than it would be as the Stackelberg leader. The social-welfare result is interesting because it suggests that a shift of bargaining power from upstream battery suppliers to downstream electric vehicle manufacturers may sometimes improve overall supply-chain efficiency.
This finding offers a strategic message for electric vehicle manufacturers: they should monitor consumer attitudes toward driving range and battery performance. When the market shows a strong preference for high-capacity batteries, taking a leadership position can benefit not only the electric vehicle manufacturer but also the battery supplier and consumers.
6.2 Manufacturer-supplier merger
Suppose the electric vehicle manufacturer decides to acquire the battery supplier and to form a vertically integrated system. In this case, the wholesale transaction between the supplier and the manufacturer is eliminated, and the integrated firm chooses the retail price \(p\) and battery capacity \(h\) simultaneously. The recycler remains independent and still collects retired batteries at the buyback price \(b\). The integrated firm pays a fixed merger fee \(F\) to acquire the supplier.
Without government subsidy, the profit of the integrated firm is
$$
\pi_{MF}^{N}=(p-c_n-c_m-m)D-bQ-\frac{c_h h^2}{2}.
$$
In contrast, the profit of the decentralized system is the sum of the manufacturer’s profit and the supplier’s profit, \(\pi_M^{N}+\pi_S^{N}\). Vertical integration is attractive only if it generates a higher joint profit than the decentralized system. Proposition 4 reports the condition.
Proposition 4. Let \(\hat{F}\) denote the threshold value of the fixed merger fee, given by
$$
\hat{F}=\frac{2c_h^3\beta^2 B^2}{M^2(2\beta c_h-k^2)}.
$$
If \(F<\hat{F}\), the manufacturer-supplier merger creates a centralized system whose profit exceeds the sum of the supplier’s and manufacturer’s profits in the decentralized benchmark. If \(F>\hat{F}\), the merger destroys value. When \(F=\hat{F}\), the manufacturer is indifferent between remaining decentralized and forming the centralized system.
The merger eliminates double marginalization and induces the integrated firm to set a lower retail price and to choose a higher battery capacity, all else being equal. Yet integration costs money. If the fixed fee needed to acquire the battery supplier is too large, the cost of the merger outweighs the efficiency gain. The threshold \(\hat{F}\) is higher when the demand potential \(B\) is large, when battery-capacity R&D has a moderate cost, and when the supply chain faces less severe double marginalization. In practice, electric vehicle manufacturers should conduct a careful cost-benefit analysis before acquiring battery suppliers. The threshold result clarifies that vertical integration is not always superior, even though it removes the wholesale distortion in the electric vehicle battery supply chain.
7. Conclusion and Policy Recommendations
This article has developed an analytical framework to study operational decisions in an electric vehicle power-battery supply chain under government production or recycling subsidies. The model captures important features of the electric vehicle sector: battery capacity is a key driver of consumer demand; retired power batteries are heterogeneous in their remaining capacity; and third-party recyclers play an essential role in closing the loop. I have compared the implications of a demand-based production subsidy, a quantity-based recycling subsidy, and a capacity-based recycling subsidy.
The main findings are as follows. First, regardless of the subsidy regime, the manufacturer’s profit is increasing in consumers’ preference for battery capacity and decreasing in the battery-capacity R&D cost coefficient. Collection quantity and recycler profit increase with the voluntary return base and with the recycler’s ability to convert effort into returns. Second, a positive production subsidy is the most effective instrument for raising battery capacity and expanding demand. It benefits the battery supplier and the electric vehicle manufacturer. By contrast, a recycling subsidy is the more direct instrument for improving collection volume, recovery effort, and the profit of the third-party recycler. Third, the social-welfare analysis suggests that a production tax is harmful to social welfare, while a positive production subsidy can raise social welfare above the level achieved by either recycling-subsidy policy. Fourth, if the electric vehicle manufacturer can lead the supply chain, it always gains; when consumer preference for battery capacity is strong, the battery supplier and social welfare also gain. Fifth, vertical integration between the electric vehicle manufacturer and the battery supplier is valuable only when the merger fee is below a threshold.
These findings yield several policy recommendations.
First, policy makers should be explicit about the objective of a subsidy. If the goal is to promote the diffusion of electric vehicles and strengthen the domestic battery-supply ecosystem, a demand-based production subsidy is more appropriate. If the goal is to reduce environmental pollution from retired power batteries, then a recycling subsidy directed at third-party recyclers is more appropriate.
Second, the design of a recycling subsidy should not ignore battery capacity. A quantity-based subsidy encourages recyclers to collect many batteries, but it does not differentiate between batteries with high residual value and those with almost no remaining capacity. A capacity-based subsidy may better align the recycler’s incentive with the economic value of the returned battery and with the safety of second-use applications.
Third, manufacturers should seek a balance between battery capacity and R&D cost. Consumers value electric vehicles with longer range, but excessive investment in capacity can erode profit. Governments can support manufacturers by subsidizing high-capacity battery models or by providing research grants that lower the effective cost of battery-capacity innovation.
Fourth, recycling subsidies should be accompanied by public-awareness campaigns and by the construction of standardized collection networks. Because the voluntary return base \(Q_0\) has a strong positive effect on recycling output, raising consumer willingness to return retired batteries is as important as paying subsidies to firms.
My study has some limitations. The government’s subsidy coefficient is assumed to be exogenous and static; in reality, governments may adjust subsidies dynamically and may need to prevent fraudulent subsidy claims. The model also abstracts from competition among multiple battery suppliers or multiple electric vehicle brands. In future research, I plan to extend the model to include multiple manufacturers, asymmetric information about residual battery capacity, and dynamic subsidy contracts. Empirical calibration of the parameters with real data from the electric vehicle industry would also be valuable. Despite these limitations, the model provides a systematic comparison of production and recycling subsidies in the electric vehicle battery supply chain, and it clarifies how subsidies affect demand, recycling, firm profitability, and social welfare.