
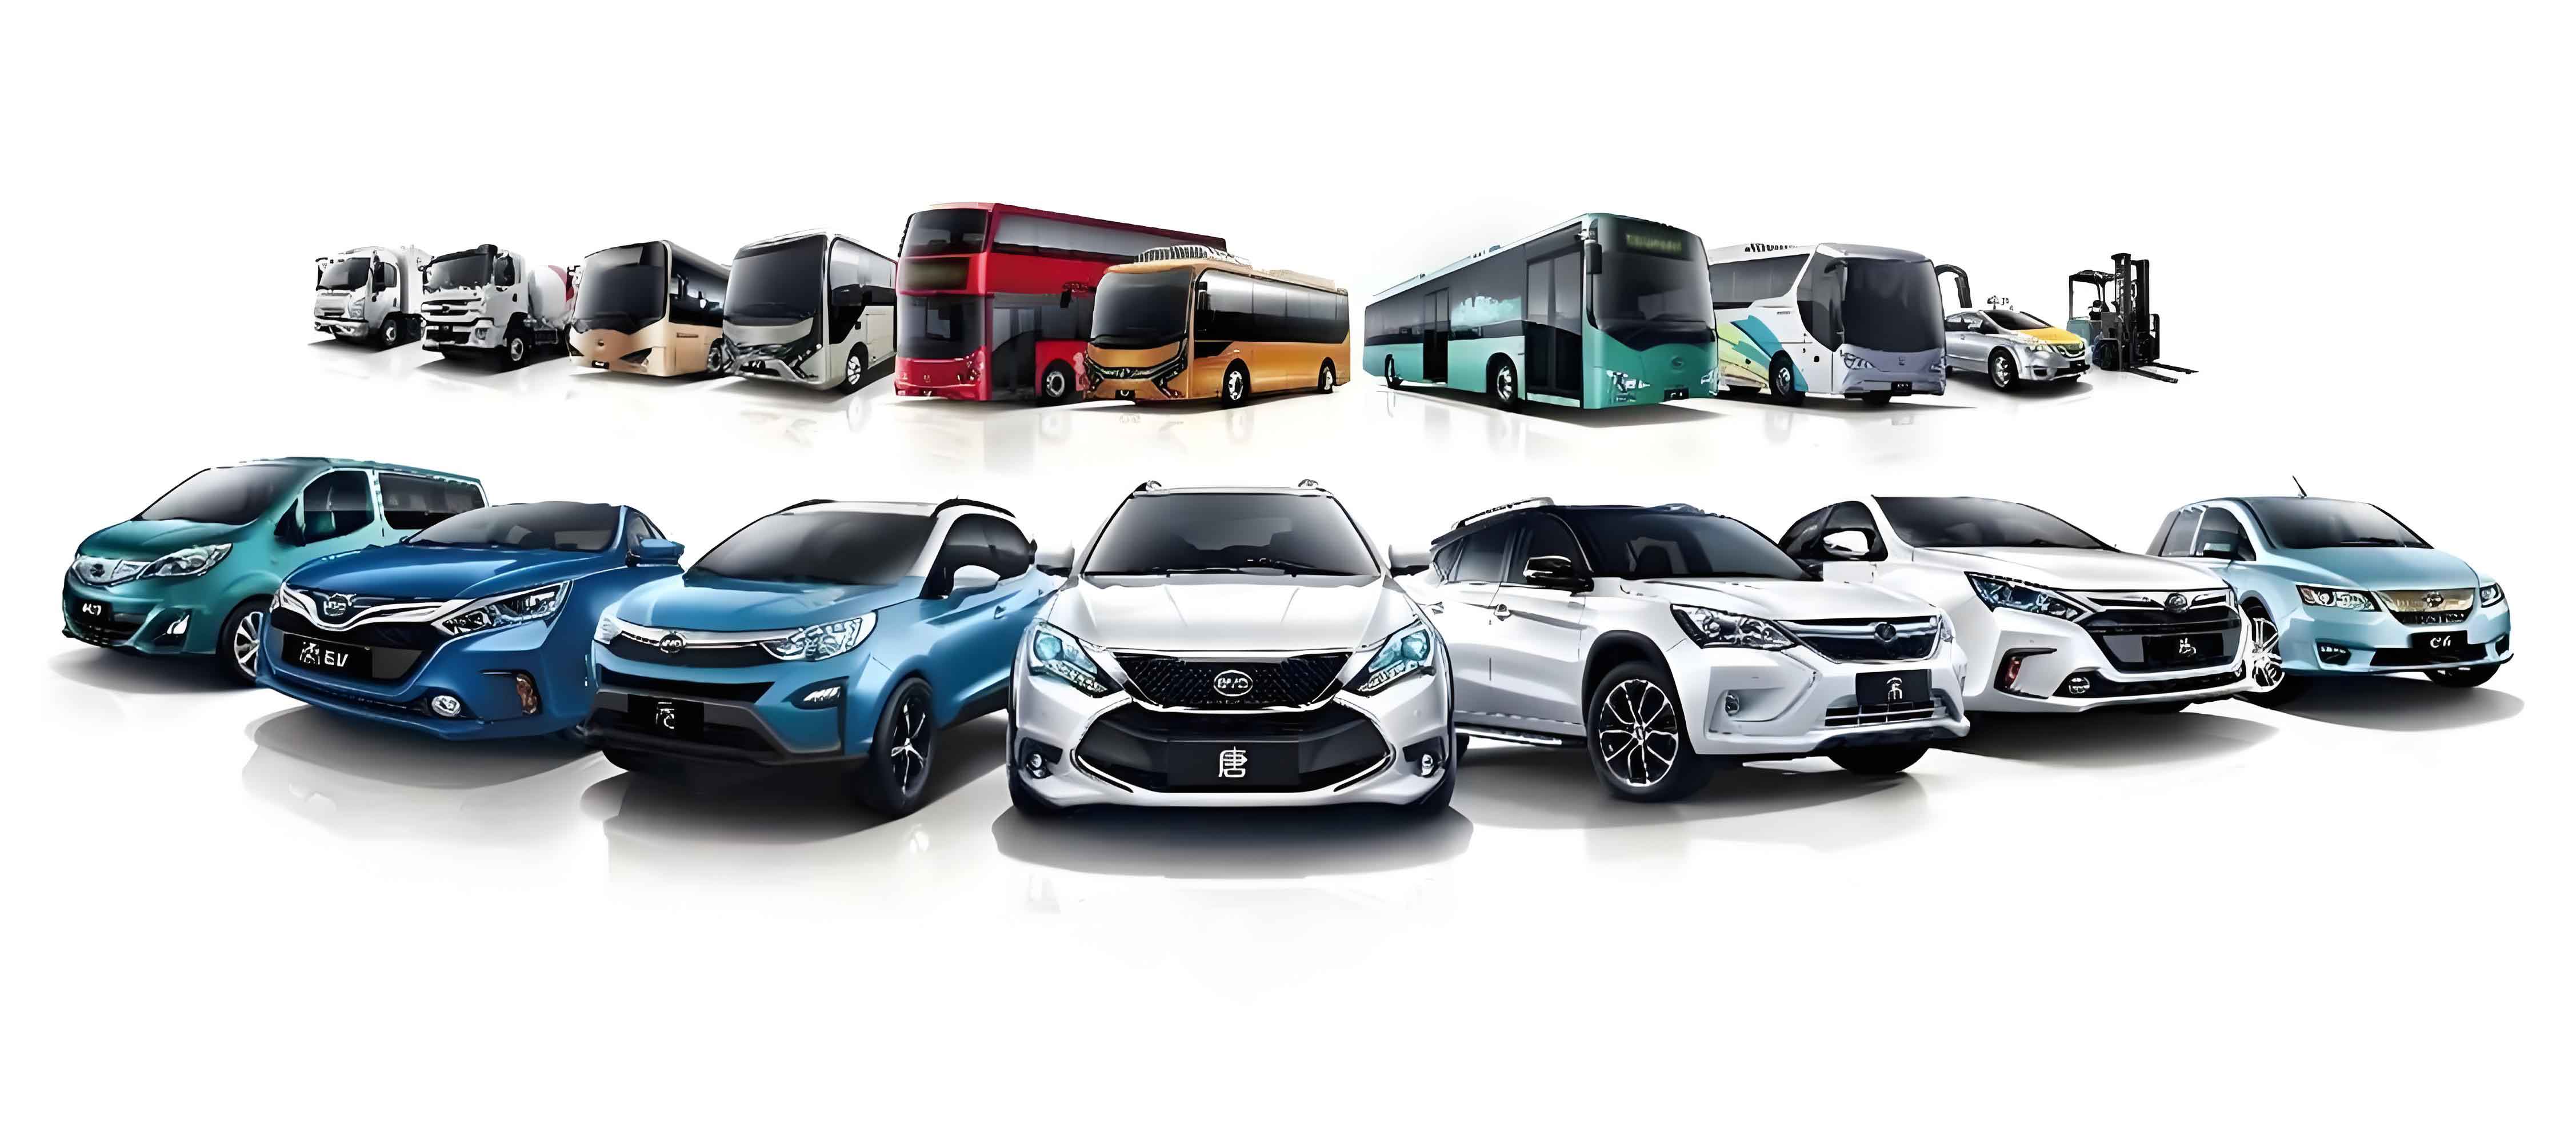
The rapid expansion of the electric vehicle market has brought the issue of end-of-life power battery management to the forefront of both industrial practice and academic research. As a researcher focusing on logistics and supply chain management, I have observed that the operational decisions surrounding power battery recycling are increasingly shaped by government intervention, particularly through production subsidies or recycling subsidy schemes. The core challenge lies in how different subsidy mechanisms influence the strategic interactions among battery suppliers, electric vehicle manufacturers, third-party recyclers, and consumers. In this article, I present a comprehensive analysis based on a Stackelberg game model that compares three distinct subsidy scenarios: demand-based production subsidies, collection-volume-based recycling subsidies, and battery-capacity-based recycling subsidies. The findings reveal nuanced and sometimes counterintuitive insights into how public policy instruments interact with private sector decision-making in the electric vehicle battery supply chain.
1. Introduction
The global push for sustainable transportation has positioned electric vehicles as a cornerstone of the low-carbon transition. My nation, alongside other major economies, has witnessed remarkable growth in electric vehicle adoption, with leading manufacturers achieving record-breaking sales volumes. However, this proliferation of electric vehicles brings with it an impending wave of retired power batteries. Based on the data I have examined from industry reports, the quantity of power batteries entering the scrap phase was approximately 200,000 tons in 2020, and this figure is projected to surge to 780,000 tons by 2025. Given that the average lifespan of a power battery ranges from five to eight years, and that batteries lose efficiency once their capacity falls below 70-80% of their original level, the safe disposal and recycling of these batteries has become an urgent environmental and operational necessity.
The operational complexity of power battery recycling is considerable. Upon collection, batteries must undergo residual capacity testing, manual disassembly of battery packs, and subsequent processing — all of which incur substantial costs. My analysis of the recycling ecosystem shows that the current recycling rate for retired electric vehicle batteries remains at only about 20%, highlighting the pressing need for policy interventions. Government subsidies have emerged as a primary tool to incentivize recycling activities. In my observation of various regional policies, I noted distinct approaches: some municipalities offer subsidies per battery pack collected to vehicle manufacturers, while others provide rewards based on the electricity capacity of the batteries recovered. These practical policy variations motivated my research into comparing production subsidies with two types of recycling subsidies within a unified analytical framework.
| Policy Instrument | Subsidy Base | Recipient | Real-world Example |
|---|---|---|---|
| Production Subsidy (D) | Consumer demand quantity | Battery supplier | Generalized production incentives for NEV supply chains |
| Collection-volume Recycling Subsidy (Q) | Quantity of batteries collected | Third-party recycler (3PR) | Municipal government offering per-pack subsidies |
| Capacity-based Recycling Subsidy (B) | Capacity of batteries collected | Third-party recycler (3PR) | Local government awarding per-kWh incentives |
My research objective is to systematically investigate how these three subsidy mechanisms affect the equilibrium decisions of supply chain members, their profit distributions, and overall social welfare in the electric vehicle power battery supply chain. By constructing a multi-tier supply chain model that captures the interactions between upstream battery material suppliers, midstream electric vehicle manufacturers, and downstream third-party recyclers, I aim to derive insights that can guide both enterprise strategy and government policy formulation.
2. Literature Review and Research Positioning
My review of the existing literature on electric vehicle power battery recycling reveals several major research streams. The first stream focuses on recycling channel design and mode selection. I found that scholars have extensively studied various recycling collaboration models, joint recycling strategies among electric vehicle manufacturers, and deposit-refund schemes. Some researchers have developed four-mode comparisons for battery collecting channels in closed-loop supply chains under cap-and-trade policies, while others have examined how production companies choose multi-channel recycling modes based on profit conditions and contract coordination in multi-level closed-loop supply chains.
The second stream of literature addresses government subsidy policies within the electric vehicle supply chain. In my examination of this research, I identified studies on how government subsidies for battery echelon utilization affect closed-loop supply chains under four scenarios, demonstrating that recycling subsidies significantly enhance recovery rates and the profitability of third-party recyclers. Other scholars constructed two-period closed-loop supply chain models to evaluate whether governments should provide recycling subsidies based on residual battery energy levels. Additionally, researchers have assessed the effects of reward-penalty mechanisms on power battery recycling under various single-channel and competitive dual-channel structures.
A third relevant research direction explores the intersection of battery characteristics and supply chain dynamics. I noted studies incorporating carbon quota trading policies, blockchain technology adoption, and system dynamics simulation approaches for evaluating comprehensive subsidy mechanisms in the post-subsidy era.
| Research Gap Area | Previous Approaches | My Contribution |
|---|---|---|
| Subsidy targeting | Same subsidy type given to different recipients; single-direction flow | Differentiated production vs. two types of recycling subsidies compared within one framework |
| Sensitivity to battery characteristics | Focus on collection quantity; overlooking battery capacity dimension | Modeling capacity-based recycling subsidy alongside production subsidy |
| Outcome measurement | Mainly enterprise profits; limited welfare analysis | Inclusion of social welfare with consumer surplus and government expenditure |
| Power structure variations | Fixed Stackelberg structure | Extensions: manufacturer-led and vertical integration scenarios |
My systematic comparison with previous publications, as I summarized in the detailed contrast table, identified several important gaps that my research aims to address. First, there is a lack of comprehensive comparison that simultaneously examines production subsidies and multiple forms of recycling subsidies, since prior research tends to focus on a single subsidy instrument or compares the same subsidy given to different entities. Second, the distinguishing attributes of power batteries — particularly the dual dimensions of collection quantity and residual capacity — have not been fully integrated into subsidy design comparisons. Third, while most studies measure outcomes solely by firm profitability, my framework extends the analysis to include social welfare, thereby capturing the broader societal implications of subsidy policies. By filling these gaps, my research provides a more holistic understanding of subsidy efficacy in the power battery recycling context, which is highly relevant for any country that seeks to promote the sustainable growth of its electric vehicle sector.
3. Model Framework and Principal Assumptions
In constructing my model, I considered a four-party electric vehicle supply chain architecture consisting of a power battery supplier (S), an NEEV manufacturer (M), a third-party power battery recycler (3PR), and consumers. The 3PR is responsible for collecting retired power batteries and delivering them to the battery supplier, who recycles them into usable materials for producing fresh batteries. These batteries are subsequently sold to the manufacturer for electric vehicle assembly, and the final vehicles are retailed to consumers. The government intervenes by providing financial incentives under one of the three subsidy frameworks previously mentioned.
3.1 Demand and Cost Functions
I modeled the market demand for electric vehicles using a linear function that reflects the influence of retail pricing and battery capacity:
$$D = \alpha – \beta p + kh$$
The baseline demand function that I apply in this research reflects consumer preferences for battery capacity while retaining price responsiveness. I use a quadratic cost function, commonly adopted in the context of low-carbon technology innovation, to characterize the battery supplier’s development cost as follows:
$$C_h = k_h h^2 / 2$$
where \( k_h \) represents the cost coefficient for battery capacity research and development, effectively capturing the increasing marginal cost of innovation.
For the recycling side of the system, I considered the return volume of spent batteries from the third-party recycler as a function of the collection price and the recycling effort:
$$Q = Q_0 + \lambda p_r + \gamma e$$
The formulation of this recycling quantity function incorporates \( Q_0 \) as the base return volume without financial incentives, along with sensitivity coefficients \( \lambda \) and \( \gamma \) for the collection price \( p_r \) and recycling effort \( e \), respectively. The recycling effort entails a convex cost:
$$C_e = k_e e^2 / 2$$
where \( k_e \) measures the cost efficiency of the recycling effort. I imposed a realistic scalar that imposes technological limitations on the recycling sensitivity coefficients by requiring \( 2\lambda k_e > \gamma^2 \). I also specify the exogenous transfer price \( b \) with the condition \( b > p_r \) in order to guarantee the supplier’s incentive to procure recycled material from the third-party collector.
3.2 Profit Functions and Game Structure
Depending on the subsidy arrangement, I derived profit functions for each counterparty. For instance, when the government awards a demand-based production subsidy \( s_d \) to the supplier, the profit expressions become:
$$\pi^D_S = (w – c_m – m + s_d) D – bQ – C_h$$
$$\pi^D_M = (p – w – c_n) D$$
$$\pi^D_{3PR} = (b – p_r) Q – C_e$$
Under the collection-volume-based recycling subsidy \( s_q \), the model allocates the subsidy to the 3PR rather than the supplier yielding:
$$\pi^Q_S = (w – c_m – m) D – bQ – C_h$$
$$\pi^Q_M = (p – w – c_n) D$$
$$\pi^Q_{3PR} = (b – p_r + s_q) Q – C_e$$
Similarly, the capacity-based recycling subsidy \( s_h \) leads to this profit expression for the recycler:
$$\pi^B_{3PR} = (b – p_r + s_h h) Q – C_e$$
In all profit formulations, \( c_m \) denotes the unit manufacturing cost of the battery, \( m \) is the unit raw material cost, and \( c_n \) is the production cost of the electric vehicle itself. The supplier’s decision variables are the wholesale price \( w \) and battery capacity \( h \); the manufacturer controls the retail price \( p \); and the 3PR determines the recycling effort \( e \) and collection price \( p_r \). The sequence of events follows a vertically structured Stackelberg game where the supplier initiates the first move, followed by the manufacturer, and finally the 3PR at the last stage.
3.3 Social Welfare Specification
Beyond private profitability, my work quantifies the social welfare associated with each policy regime. This variable captures the aggregate economic benefit of the supply chain. It includes in the analysis the sum of industry profits \( \pi \), consumer surplus \( CS \), and the government subsidy disbursement \( GS \). Since profit definitions differ by case, the corresponding subsidy-level expressions also follow the logic in the model. The consumer surplus is calculated based on the demand curve with the intercept price \( p_1 = (α+kh)/β \), which gives rise to:
$$CS = (p_1 – p)D / 2$$
Assembling the relevant elements defines each scenario’s welfare outcome, such as:
$$SW^D = \pi^D_S + \pi^D_M + \pi^D_{3PR} + \frac{k_h^2 \beta [\alpha – (c_m + c_n + m – s_d)\beta]^2}{2M^2} – s_d D^D$$
$$SW^Q = \pi^Q_S + \pi^Q_M + \pi^Q_{3PR} + \frac{k_h^2 \beta [\alpha – (c_m + c_n + m)\beta]^2}{2M^2} – s_q Q^Q$$
where \( M = 4\beta k_h – k^2 \) and \( N = 2\lambda k_e – \gamma^2 \) serve as convenient composite notation. The difference between subsidy types yields entirely different welfare outcomes.
4. Equilibrium Analysis under Alternative Subsidy Schemes
I derived the equilibrium decisions for all three subsidy regimes using backward induction, ensuring subgame perfection. The equilibrium wholesale price, battery capacity, retail price, recycling effort, and collection price are summarized below:
| Scenario | Wholesale Price \( w \) | Battery Capacity \( h \) | Retail Price \( p \) | Recycling Effort \( e \) | Collection Price \( p_r \) |
|---|---|---|---|---|---|
| Production subsidy (D) | \(\frac{2(A – s_d\beta)k_h – (c_m + m – s_d)k^2}{M}\) | \(\frac{k(B + s_d\beta)}{M}\) | \(\frac{\alpha + kh + \beta(c_n + w)}{2\beta}\) | \(\frac{\gamma(Q_0 + b\lambda)}{N}\) | \(b – \frac{(Q_0 + b\lambda)k_e}{N}\) |
| Volume recycling subsidy (Q) | \(\frac{2Ak_h – (c_m + m)k^2}{M}\) | \(\frac{kB}{M}\) | \(\frac{\alpha + kh + \beta(c_n + w)}{2\beta}\) | \(\frac{\gamma[Q_0 + (b + s_q)\lambda]}{N}\) | \(b + s_q – \frac{[Q_0 + (b + s_q)\lambda]k_e}{N}\) |
| Capacity recycling subsidy (B) | \(\frac{2Ak_h – (c_m + m)k^2}{M}\) | \(\frac{kB}{M}\) | \(\frac{\alpha + kh + \beta(c_n + w)}{2\beta}\) | \(\frac{\gamma[Q_0 + (b + s_h h)\lambda]}{N}\) | \(b + s_h h – \frac{[Q_0 + (b + s_h h)\lambda]k_e}{N}\) |
In the above, I define \( A = \alpha – (c_n – c_m – m)\beta \) and \( B = \alpha – (c_n + c_m + m)\beta \). Equilibrium demand, collection quantities, and key profit components across the three scenarios are summarized in the following table:
| Variable | Production Subsidy (D) | Volume Recycling Subsidy (Q) | Capacity Recycling Subsidy (B) |
|---|---|---|---|
| Demand \( D^* \) | \(\frac{\beta k_h (B + s_d\beta)}{M}\) | \(\frac{\beta k_h B}{M}\) | \(\frac{\beta k_h B}{M}\) |
| Recycling quantity \( Q^* \) | \(\frac{\lambda k_e (Q_0 + b\lambda)}{N}\) | \(\frac{\lambda k_e [Q_0 + (b + s_q)\lambda]}{N}\) | \(\frac{\lambda k_e (Q_0 + b\lambda)}{N} + \frac{\lambda k_e (k s_h B\lambda)}{M N}\) |
| Manufacturer profit \( \pi^*_M \) | \(\frac{\beta k_h^2 (B + s_d\beta)^2}{M^2}\) | \(\frac{\beta k_h^2 B^2}{M^2}\) | \(\frac{\beta k_h^2 B^2}{M^2}\) |
| 3PR profit \( \pi^*_{3PR} \) | \(\frac{k_e (Q_0 + b\lambda)^2}{2N}\) | \(\frac{k_e [Q_0 + (b + s_q)\lambda]^2}{2N}\) | \(\frac{k_e [k s_h B\lambda + M(Q_0 + b\lambda)]^2}{2N M^2}\) |
| Social welfare \( SW^* \) | \(\pi_D + \frac{k_h^2 \beta (B + s_d\beta)^2}{2M^2} – s_d D_D\) | \(\pi_Q + \frac{k_h^2 \beta B^2}{2M^2} – s_q Q_Q\) | \(\pi_B + \frac{k_h^2 \beta B^2}{2M^2} – s_h h_B Q_B\) |
Both the Hessian matrix negative definiteness conditions and the non-negativity constraints were verified to ensure that the equilibrium solutions are economically meaningful. The set of allowable parameters guarantees that \( M > 0 \), \( N > 0 \), and the transfer price remains within the bargaining range.
5. Comparative Statics and Discussion of Results
I derived a series of propositions through sensitivity analysis of the equilibrium solutions. First, I explored the effect of technology cost factors and consumer preferences on the performance of battery suppliers and electric vehicle manufacturers. My analysis demonstrates that in every subsidy scenario, certain relationships hold true:
| Sensitivity Result | Mathematical Expression | Practical Interpretation |
|---|---|---|
| Higher battery R&D cost reduces demand | \(\frac{\partial D^{i*}}{\partial k_h} < 0\) | Costly innovation raises supplier prices, thereby dampening electric vehicle sales. |
| Higher consumer preference increases demand | \(\frac{\partial D^{i*}}{\partial k} > 0\) | Consumers are willing to pay for higher battery capacity and that stimulates adoption. |
| Costlier R&D reduces manufacturer profits | \(\frac{\partial \pi^{i*}_M}{\partial k_h} < 0\) | Upstream R&D costs get passed through, compressing the manufacturer’s margin. |
| Stronger preference boosts manufacturer profit | \(\frac{\partial \pi^{i*}_M}{\partial k} > 0\) | Demand expansion from capacity preference outweighs the cost effect. |
These findings suggest that managers in the electric vehicle supply chain should carefully balance the trade-off between pursuing advanced battery capacity and controlling the associated research and development costs. The insight that demand and profit respond positively to consumer preference for capacity is consistent with the view that battery technology serves as a key differentiator in the electric vehicle market.
For the recycling side, my comparative statics analysis revealed additional insights. In any subsidy regime, the quantity of retired batteries collected and the profit of the third-party recycler increase with the base return amount \( Q_0 \) and the effort sensitivity coefficient \( \gamma \). This can be expressed as:
$$\frac{\partial Q^{i*}}{\partial Q_0} > 0, \qquad \frac{\partial \pi^{i*}_{3PR}}{\partial Q_0} > 0, \qquad \frac{\partial Q^{i*}}{\partial \gamma} > 0, \qquad \frac{\partial \pi^{i*}_{3PR}}{\partial \gamma} > 0$$
However, the responsiveness to the collection price sensitivity \( \lambda \) reveals a more complex pattern. The recycling quantity and 3PR profit increase with \( \lambda \), but only when \( \lambda \) exceeds certain thresholds \( \lambda_1 \) and \( \lambda_2 \), where:
$$\lambda_1 = \frac{b\gamma^2 + b\gamma^2(2k_e Q_0 + b\gamma^2)}{2b k_e}, \qquad \lambda_2 = \frac{Q_0}{b} + \frac{\gamma^2}{k_e}$$
This non-monotonic relationship suggests that simply raising the collection price does not guarantee higher returns unless the base recovery system has achieved a sufficient scale of efficiency. In practice, recyclers should seek to lower the unit cost of collection and improve their operational processes, so that financial incentives translate into meaningful increases in recovery volumes.
5.1 Comparative Outcome: Production Subsidy vs. Recycling Subsidies
One of the key comparative findings in my paper concerns battery capacity decisions. I found that the production subsidy leads to a higher equilibrium battery capacity level compared to either recycling subsidy scenario:
$$h^{D*} > h^{Q*} = h^{B*}$$
This result is counterintuitive at first glance, since recycling subsidies provide economic incentives for the collection of spent batteries, which in turn could be viewed as promoting a circular system that should foster battery innovation. Yet, why is the outcome different? I reason that the production subsidy reduces price frictions and expands the total addressable market for electric vehicles. Increased sales volume generates higher revenues, which can be reinvested into research and development for better battery technology. This indirect route for innovation seems stronger than the direct effect of subsidizing recycling, whose impact largely stays with the third-party collector and rarely trickles up to upstream suppliers.
By contrast, the recycling subsidies — in both the quantity-based and capacity-based modes — induce higher recycling efforts and collection prices relative to the production subsidy case. Formally:
$$e^{D*} < \min\{e^{Q*}, e^{B*}\}, \qquad p^{D*}_r < \min\{p^{Q*}_r, p^{B*}_r\}$$
This finding suggests that recycling subsidies are more targeted instruments for achieving environmental goals in the reverse supply chain. The comparison between the quantity-based and capacity-based recycling subsidies depends on the relative magnitude of subsidy coefficients \( s_q \) versus \( s_h \). If \( s_q \) is large enough relative to \( s_h \), the quantity-based recycling subsidy results in a higher collection price; otherwise, the capacity-based subsidy prevails.
5.2 Profit Distribution Effects
My analysis of profit distribution reveals a clear pattern of alignment between each subsidy type and the party that benefits the most. Under the demand-based production subsidy, both the electric vehicle manufacturer and the battery supplier achieve higher profits compared to the two recycling subsidy alternative cases:
$$D^{D*} > D^{Q*} = D^{B*}, \qquad \pi^{D*}_M > \pi^{Q*}_M = \pi^{B*}_M, \qquad \pi^{D*}_S > \max\{\pi^{Q*}_S, \pi^{B*}_S\}$$
The production subsidy lowers the effective cost basis for the supplier and supports broader output, thus benefiting the entire forward chain. Yet it provides no direct incentive to the recycling actor. In contrast, the 3PR entity sees higher returns under recycling subsidies:
$$Q^{D*} < \min\{Q^{Q*}, Q^{B*}\}, \qquad \pi^{D*}_{3PR} < \min\{\pi^{Q*}_{3PR}, \pi^{B*}_{3PR}\}$$
This divergence means that policy-makers must prioritize their objectives: if the goal is to foster a more robust recycling market and achieve environmental sustainability in battery recovery, then recycling subsidies are more suitable. If the aim is to strengthen the competitiveness of domestic electric vehicle manufacturing and accelerate battery technology innovation, production subsidies dominate.
5.3 Social Welfare Numerical Comparisons
Because the three subsidy schemes produce inconsistent advantages across supply chain members, I proceeded to compare how each subsidy affects overall social welfare. In my numerical analysis, I calibrated default parameter values to reflect realistic conditions in the electric vehicle battery market. My simulations varied the consumers’ price sensitivity coefficient \( \beta \) within the range [0.4, 0.8], while also considering negative values of \( s_d \) (taxation), a zero value (no government intervention), and positive values (subsidy).
My principal finding is that as the price sensitivity coefficient \( \beta \) increases, social welfare declines under all subsidy mechanisms. The rationale here is that greater price sensitivity amplifies market volatility and pricing pressure, lowering the equilibrium sales volume and escalating demand uncertainty — factors that are harmful to the stability of industry-wide value creation.
| Coefficient Scenario | Observation | Interpretation |
|---|---|---|
| \( s_d = -0.4 \) (tax) | \( SW^{D*} < \min\{SW^{Q*}, SW^{B*}\} \) | Taxation of the supply chain reduces output and consumer welfare, making the production-based instrument inferior to recycling subsidies. |
| \( s_d = 0 \) (no intervention) | Welfare under D scheme gradually increases with reduced \( \beta \) | Absence of production-based distortions allows the market to adjust more efficiently. |
| \( s_d = 0.4 \) (subsidy) | \( SW^{D*} > \max\{SW^{Q*}, SW^{B*}\} \) | A meaningful production subsidy improves demand, consumer surplus, and overall welfare above both recycling-subsidy levels. |
This indicates an interesting policy dynamic: production subsidies only outperform recycling subsidies once they reach a sufficiently generous level. When the production subsidy exists at low rates, the benefits may be too diluted to overcome the cost of public spending; but once the subsidy becomes substantial, it triggers a powerful expansion in the consumer market, creating a virtuous cycle of growing demand, scale economies, and improved social welfare.
6. Model Extensions
To further test the robustness of my findings, I developed two extensions to the basic framework. In the forward chain design, I assumed that the supplier is the Stackelberg leader. But real-world market structures can vary; hence, I considered how the balance of power between the manufacturer and supplier affects outcomes.
6.1 Manufacturer As Stackelberg Leader
In this extension, I inverted the sequence to evaluate what happens when the electric vehicle manufacturer leads the supply chain rather than the battery supplier. Assuming zero subsidies for all types, with profits written for the supplier \({S_m}\), the manufacturer \({M_m}\), and the recycler as before, I let the manufacturer set its price margin \( m_p \), and then the price is defined as \( p = m_p + w \). After solving by backward induction, I compared the outcomes to those of the baseline with supplier leadership. My analysis yields the following proposition:
$$\pi^{N*}_{Mm} > \pi^{N*}_{M}$$
Thus, there is a first-mover advantage and whoever is the Stackelberg leader captures higher profit in this power-battery supply chain. Interestingly, the supplier is not necessarily worse off when he loses leadership. Under the specific condition that consumer preference for battery capacity lies in an intermediate range:
$$\frac{4k_h\beta}{3} < k < 2k_h\beta$$
the supplier’s profit is actually larger when the manufacturer leads than when he leads himself:
$$\pi^{N*}_{Sm} > \pi^{N*}_{S}$$
Furthermore, manufacturer-led supply chains generate better aggregate social welfare:
$$SW^{N*}_m > SW^{N*}$$
The main managerial insight here is that the choice of chain captaincy matters. If the demand environment supports capacity innovation strongly enough, having the manufacturer set the tempo for the chain can coordinate the downstream better, resulting in greater industry profits and social benefits. Observing the evolution of the electric vehicle market, one can see some large OEMs increasingly orchestrating their upstream battery supply, either via joint ventures or by directly imposing technical standards, which aligns with the advantages described here.
6.2 Manufacturer Integrated with Supplier
The second extension considers vertical integration. In this scenario, the manufacturer and supplier merge into a single entity whose combined profit is:
$$\pi^N_{MF} = (p – c_n – c_m – m) D – bQ – C_h$$
I solved this integrated-model case for its optimal pricing and capacity decisions and compared the aggregate payoff to the sum of the separate profits of both entities in the decentralized chain. I obtained a threshold condition for the merger fee \( F \), from which the only time integration is worthwhile for the manufacturer is when the fee charged by the supplier remains below:
$$\hat{F} = \frac{2k_h^3 \beta^2 B^2}{M^2 (2\beta k_h – k^2)}$$
This generates a clear decision rule:
$$\pi^{N*}_{MF} > \pi^{N*}_{M} + \pi^{N*}_{S} \quad \text{ if } \quad F < \hat{F}$$
At the threshold level \( F = \hat{F} \), both the integrated and decentralized supply chains produce identical total profits. This means that decision-makers evaluating acquisitions or mergers should scrutinize the associated cost of integration and make the transformation only when it can be done for less than the value it generates through eliminating double marginalization. This result has direct relevance for electric vehicle enterprises considering backward integration into cell manufacturing or vertical control over key battery technologies.
7. Managerial Implications and Policy Recommendations
Based on my findings, I can provide practical guidance for different groups of decision-makers. First, on the operational side, the insights derived from comparing battery capacity versus cost dynamics reinforce the importance of constant innovation while controlling research and development costs. Since consumer preference for battery capacity amplifies profitability, electric vehicle manufacturers should invest in product differentiation through high-density battery packs, longer ranges, and improved charging characteristics — the main demand drivers in the electric vehicle segment.
Second, for third-party recyclers, my study shows that financial incentives truly matter. Whether aiming for higher collection volumes or better capacity utilization, recycling firms should actively engage with public bodies to secure favorable subsidy terms. Given that a larger value of \( \lambda \) (price sensitivity) only helps once it exceeds certain thresholds, these firms should also focus on improving infrastructure and operational efficiency in their sorting and collection systems. Over time, economies of scale are generated and the industry moves towards a point where the subsidy support becomes particularly effective.
For public policymakers, several important implications arise. A crucial conclusion from my study is that the choice of the subsidy target translates directly into different winners and losers across the industrial value chain:
| Policy objective | Recommended subsidy type | Rationale from my analysis |
|---|---|---|
| Enhance electric vehicle sales and adoption | Production subsidy (on demand) | Raises demand, strengthens overall market size and consumer surplus. |
| Promote battery recycling and sustainability | Collection-based or capacity-based recycling subsidy | Directly increases recycling effort, quantities, and 3PR profitability. |
| Improve social welfare when budget is limited | Recycling subsidies | Deliver environmental outcomes without overstimulating demand-side price distortions. |
| Improve social welfare when budget is sufficient | Production subsidy at scale | Creates a market expansion effect that surpasses the impact of recycling subsidies. |
Another important insight for government strategy is the need for differentiated tools based on maturity of the industry. In the earlier stage of the electric vehicle market, production subsidies have proven effective in building consumer adoption and developing a favorable environment for electric cars. Yet in mature stages, as battery installed base grows and the volume of retiring batteries begins to escalate, governments should shift their emphasis to well-calibrated recycling subsidy mechanisms. Ideally, ministries should apply both instruments simultaneously, adjusting the balance over time to maintain effectiveness, avoid excessive fiscal burdens, and minimize the potential for subsidy fraud or dependence.
From a broader perspective, the goals for the electric vehicle sector include not just market growth, but also so-called environmental justice. This includes lowering the carbon footprint of manufacturing and preventing the unsafe disposal of used batteries. The use of well-designed subsidies should therefore be paired with enhanced enforcement of environmental standards, mandatory extended producer responsibility schemes, and the creation of better collection and tracing platforms.
8. Sustainability Considerations and Limitations
I also examined whether the effects observed in these models are consistent with the long-term sustainable development aspirations of the electric vehicle industry. My study indicates that in terms of the circular economy, recycling subsidies indeed directly encourage the flow of retired batteries back into the value chain, preventing hazardous wastes from ending up in landfills and preserving valuable minerals for future reuse. However, even the production subsidy can provide indirect ecosystem benefits by scaling up the fleet of electric vehicles, thereby displacing fossil-fuel burning vehicles and lowering tailpipe emissions.
That said, my research is not without limitations. The analytical framework abstracts from real-world complexities such as information asymmetry across supply chain partners, consumer heterogeneity beyond a linear preference function, and dynamic changes in the policy environment over time. While I treat subsidy parameters as exogenous, governments may adjust the subsidy rate in response to observed firm behavior and technology progress, which would call for a more sophisticated two-stage policy game. Moreover, the values I set for the model, though grounded in prior literature and plausible industrial statistics, deserve further validation using actual production, sales and recycling figures from manufacturing firms. In the future, I plan to gather more data through web scraping and business analytics to parameterize this framework and test the accuracy of its predictions more comprehensively.
On balance, earlier findings from some scholars show that blockchain technology and system-dynamics modeling can be combined with reward-penalty schemes to promote battery traceability. Similarly, I see the possible applications of these methods to sustainable business models in which different subsidy types are selected based on the specific maturity of the battery-recycling infrastructure in distinct markets.
9. Conclusion
In this research, I offer a comprehensive analysis of how government production subsidies and two forms of recycling subsidies affect the operational and strategic decisions of an electric vehicle power battery supply chain. I used a Stackelberg game framework to determine equilibrium conditions under different subsidy regimes. The first key insight is that subsidy mechanism choice leads to a divided effect: demand-based production subsidies tend to improve capacity, demand, and supplier/manufacturer profits, while recycling-oriented subsidies are the only ones that benefit the third-party recycler and increase the recovery volume. From the social welfare perspective, the role of production subsidy is conditional on its magnitude: sufficiently substantial production subsidies can make this scenario socially preferable to either recycling-subsidy model.
Another prominent result of this research is that the battery supplier’s leadership is not necessarily inferior. The equilibrium structure between the supplier and the manufacturer is contextual. If the consumer preference for battery capacity is favorable, letting the manufacturer be the dominant actor in the chain can actually improve the payoffs of both firms and of society. In addition, my vertical integration analysis establishes a decisive benchmark for merger costs.
For commercial decision-makers, these insights translate into concrete recommendations about when electric vehicle producers should lobby for production-type incentives and when recyclers should campaign for recycling-type mechanisms. For public officials, the framework supplies a transparent tool for foreseeing who wins and who loses under alternative support policies, and how overall social impact will shift. My hope is that such modeling evidence will encourage more economically efficient and environmentally effective policy design to support the ongoing transition of the global transportation system toward electric mobility while managing battery lifecycles responsibly.