
1. Introduction and Research Background
The traction battery system is widely recognized as one of the most critical components in modern electric vehicles, fundamentally determining the driving range, safety performance, and overall lifetime of the vehicle. As the global automotive industry accelerates toward electrification and carbon neutrality, the demand for high-performance lithium-ion traction batteries continues to grow rapidly. Nevertheless, with repeated charge and discharge cycles, the capacity and power capability of traction batteries inevitably decline, a phenomenon generally referred to as battery degradation. Understanding the internal mechanisms that lead to performance deterioration and accurately diagnosing the degradation modes are essential for extending the service life of traction batteries, improving their safety, and optimizing battery management strategies. Two principal degradation modes are commonly identified in lithium-ion traction batteries: the loss of lithium inventory (LLI) and the loss of active material (LAM). Although substantial research efforts have been devoted to investigating these degradation modes, most existing approaches rely either on non-destructive external characteristic analyses that depend heavily on model assumptions, or on destructive post-mortem physiochemical characterizations that provide direct observation but permanently damage the cell. Bridging these two methodological categories through a quantitative micro-macro correlation framework remains an open and important challenge in the field of traction battery health diagnostics. To address this technical gap, this study focuses on a commercial lithium iron phosphate (LiFePO₄) traction battery and systematically investigates the evolution of LLI and LAM at multiple physical scales.
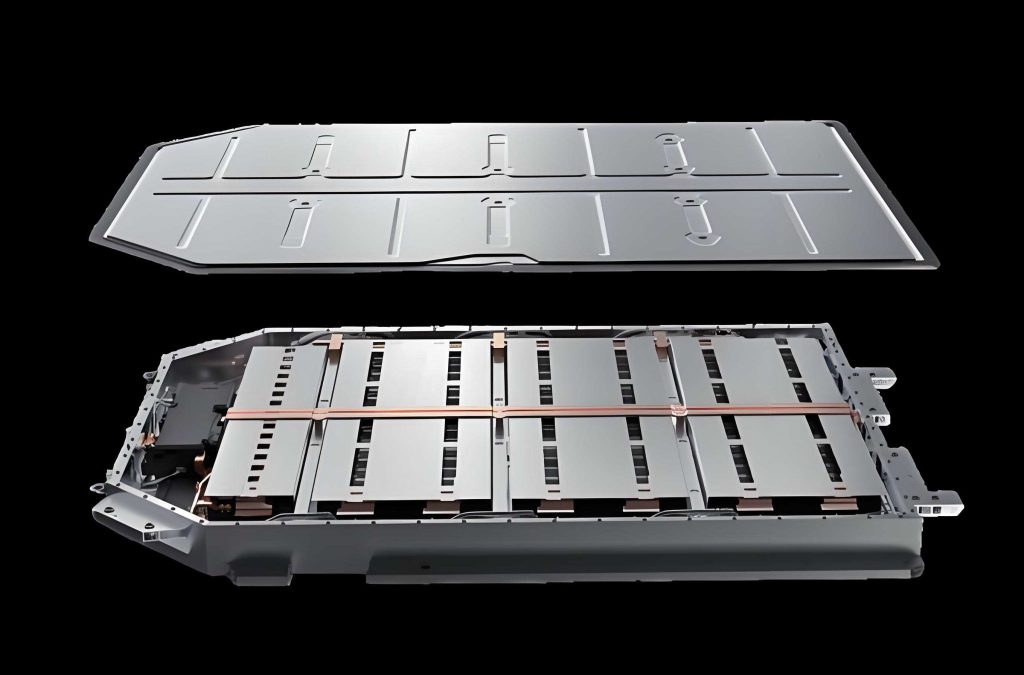
In this chapter, I first introduce the fundamentals of lithium-ion battery operation and the mechanisms of capacity fade, followed by a comprehensive review of state-of-the-art analytical methods for battery degradation diagnosis. I then summarize the research objectives and outline the technical roadmap of this work, highlighting the necessity of integrating macro-level voltage analysis with micro-level material characterization for accurate degradation mode evaluation.
2. Review of Traction Battery Degradation Mechanisms
Lithium-ion traction batteries convert chemical energy into electrical energy through reversible electrochemical reactions in which lithium ions shuttle between the positive and negative electrodes. Taking the LiFePO₄ battery as an example, the charging process involves the deintercalation of lithium ions from the LiFePO₄ positive electrode, migration through the electrolyte and separator, and intercalation into the graphite negative electrode, accompanied by the flow of electrons through the outer circuit. The corresponding electrode reactions may be expressed as follows:
$$ \text{LiFePO}_4 \xrightarrow{\text{charge}} \text{Li}_{1-x}\text{FePO}_4 + x\text{Li}^+ + x e^- \tag{1} $$
$$ x\text{Li}^+ + x e^- + 6\text{C} \xrightarrow{\text{charge}} \text{Li}_x\text{C}_6 \tag{2} $$
In an ideal reversible system, charge and discharge proceed without significant structural damage to the electrode materials. However, in real operating environments, various side reactions occur at the electrode-electrolyte interfaces, causing cumulative degradation of the traction battery. These internal aging causes can be categorized into the following aspects.
2.1 Internal Degradation Modes of Traction Batteries
Capacity fade in traction batteries mainly results from the loss of cyclable lithium inventory and the loss of active materials from either electrode. The primary mechanisms contributing to LLI include the continuous growth of the solid electrolyte interphase (SEI) layer on the graphite anode surface, lithium plating at low temperatures or under high charge rates, and the consumption of cyclable lithium ions through parasitic side reactions. The growth of the SEI layer consumes both lithium ions and electrolyte, gradually decreasing the number of lithium ions available for reversible intercalation and increasing the internal resistance of the traction battery. Meanwhile, lithium plating leads to metallic lithium deposition on the anode surface, which may react with the electrolyte and further exacerbate the loss of cyclable lithium.
On the other hand, LAM mostly originates from mechanical degradation of the electrode particles, including particle cracking, structural disordering, phase transformation, and loss of electrical contact between the active particles and the current collector. In the graphite anode, repeated lithium intercalation and deintercalation cause substantial volume changes, which induce mechanical stress that may crack the particles and even exfoliate the graphene layers. The exposure of fresh particle surfaces to the electrolyte triggers additional SEI formation, which consumes more lithium and thus couples LAM with LLI. In the LiFePO₄ cathode, although the olivine crystal structure provides excellent structural stability, dissolution of transition metals and corrosion of the aluminum current collector may still lead to capacity loss, although typically less pronounced than for other cathode chemistries.
2.2 External Factors Affecting Traction Battery Degradation
The progression of internal degradation in traction batteries is strongly influenced by external operational conditions. Temperature has a particularly significant impact: elevated temperatures accelerate the kinetics of parasitic side reactions, promoting the growth of the SEI layer and the degradation of electrode materials, whereas subzero temperatures raise electrolyte viscosity and hamper lithium-ion transport, facilitating lithium plating. The current rate also plays a crucial role, because high charge and discharge rates amplify polarization, increase the overpotential, and thereby promote LLI as well as structural damage of the active particles. Moreover, the depth of discharge is another critical factor: extremely deep charge or discharge excursions may cause irreversible structural transformation of the electrode materials and enhance the dissolution of the current collector. Table 1 summarizes the main external factors and their corresponding influences on traction battery degradation modes.
| External factor | Mechanistic consequence | Degradation mode |
|---|---|---|
| High temperature | Accelerated SEI growth; electrolyte decomposition; cathode degradation | LLI, LAMPE, internal resistance rise |
| Low temperature | Lithium plating; slow ionic diffusion; increased polarization | LLI |
| High current rate | Enhanced polarization; lithium plating; particle cracking | LLI, LAMNE |
| Over-charge / over-discharge | Structural damage; electrolyte decomposition; copper current collector dissolution | LAMPE, LAMNE, LLI |
| High depth of discharge | Mechanical stress; loss of electrical contact | LAM |
Table 1: Relationship between external factors and traction battery degradation modes.
3. Experimental Setup and Battery Testing Methodology
In this chapter, a comprehensive experimental platform was constructed to obtain characterization data at both macroscopic and microscopic scales, providing the basis for the quantitative analysis of degradation modes in the traction battery under investigation.
3.1 Test Object and Platform Description
The test object in this work is a commercial prismatic LiFePO₄ traction battery produced by a domestic manufacturer. Table 2 lists its principal specification parameters.
| Parameter | Value |
|---|---|
| Nominal capacity | 20 Ah |
| Nominal voltage | 3.2 V |
| Impedance | 7 mΩ |
| Weight | 485 g ± 15 g |
| Dimensions | 130 mm × 70 mm × 27 mm |
Table 2: Basic parameters of the traction battery used in this study.
The test bench comprises a battery test system (NBT5V20AC16-T) with voltage and current measurement accuracy of ±0.05% F.S., a programmable temperature and humidity chamber, a coin-cell battery tester, and a scanning electron microscope platform. All full-cell tests were carried out at a controlled temperature of 25 °C to ensure the reproducibility of experimental results.
3.2 Full-cell Performance Testing
I performed capacity calibration tests, cycle aging experiments, rate capability tests, and reference low-rate charge-discharge tests. Cycle aging was performed at a constant current of 15 A for both charge and discharge, with voltage limits of 3.65 V and 2.5 V, respectively. The cells were rested for 1.5 hours before and after each charge and discharge step. A capacity calibration test was repeated every 50 cycles, from which the corresponding state of health (SOH) was calculated as the ratio between current discharge capacity and rated capacity. Through this procedure, eight traction batteries having different SOH levels were obtained, designated as #1 to #8, whereas two additional fresh cells (#9 and #10) served as reference cells. Table 3 reports the SOH and numbering of all tested cells.
| Cell number | #1 | #2 | #3 | #4 | #5 | #6 | #7 | #8 | #9 | #10 |
|---|---|---|---|---|---|---|---|---|---|---|
| SOH (%) | 93.47 | 89.12 | 86.77 | 79.41 | 96.54 | 90.61 | 83.63 | 79.76 | 102.3 | 99.1 |
Table 3: SOH values for all traction battery cells tested in this work.
In the rate capability tests, the traction battery was discharged at various current rates, namely C/25, C/10, C/5, C/3, C/2 and 1C, after being fully charged using a standard constant-current constant-voltage protocol. The results reveal that the available discharge capacity gradually decreases as the current rate rises, owing to the increase in ohmic drop and polarization at higher current rates. This observation confirms that a reference small-current charge-discharge experiment must be performed before dismantling the cells so that all cells achieve a comparable initial state, regardless of their previous rate history. To satisfy this requirement, a low-rate C/25 charge-discharge sequence was applied before disassembly.
3.3 Electrode Harvesting and Half-cell Testing
After the completion of the full-cell electrical tests, the traction battery cells at different aging states were discharged to either the fully charged or the fully discharged state and then transferred to an argon-filled glove box for disassembly. Electrode disks were punched from the harvested positive and negative electrode sheets. Half-cells were assembled in CR2032 coin-cell configuration using lithium metal foil as the counter electrode and the harvested electrode disk as the working electrode. For the positive electrode half-cells, the upper and lower voltage limits were set to 3.7 V and 2.4 V, respectively. For the negative electrode half-cells, the corresponding voltage limits were set to 1.5 V and 0.01 V. All half-cells were cycled at a low current rate of C/25 to retrieve the quasi-open-circuit potential curves as functions of the state of lithiation.
To construct an accurate battery OCV model, I fitted the measured positive and negative electrode potential curves using a combination of exponential and hyperbolic tangent functions. For the positive electrode, whose potential profile contains two single-phase regions separated by a two-phase coexistence plateau, the fitting expression is given below:
$$ U_p(x) = a_p + c_{p,1} \left[\exp\left(-\frac{b_{p,1}-x}{e_{p,1}}\right) – \exp\left(\frac{b_{p,1}-x}{e_{p,1}}\right)\right] + c_{p,2} \left[\tanh\left(\frac{x-d_{p,1}}{e_{p,2}}\right) + \tanh\left(\frac{x-d_{p,2}}{e_{p,3}}\right)\right] \tag{3} $$
For the negative electrode, which has multiple staging transitions characteristic of graphite, the following expression was employed:
$$ U_n(x) = a_n + c_{n,1} \left[\exp\left(-\frac{b_{n,1}-x}{e_{n,1}}\right) – \exp\left(\frac{b_{n,1}-x}{e_{n,1}}\right)\right] + \sum_{j=1}^{3} c_{n,j+1} \tanh\left(\frac{x-d_{n,j}}{e_{n,j+1}}\right) \tag{4} $$
The comparison between the fitted curves and the measured data demonstrates that the fitting error remains below 0.05 V over the entire lithiation range for both the positive and the negative electrode, providing a reliable basis for subsequent OCV-based degradation diagnosis.
3.4 Microstructural Characterization
For the microscopic investigation, X-ray diffraction (XRD) analysis was performed using a PANalytical X’Pert³ Powder diffractometer with Cu Kα radiation, scanning in the 2θ range of 10° to 80° with a step size of 0.013°. In addition, field-emission scanning electron microscopy (SEM) measurements were carried out to observe the evolution of the electrode surface morphology as a function of the aging state.
The XRD pattern of the positive electrode harvested from a fully charged traction battery displays numerous diffraction peaks associated with the FePO₄ phase, whereas the pattern measured from a fully discharged cell corresponds to the LiFePO₄ phase. In both cases, the peaks are widely distributed and partially overlapping, rendering a reliable quantitative analysis difficult. By contrast, the XRD pattern of the negative electrode exhibits well-resolved and distinct diffraction peaks. In the fully charged state, peaks belonging to LiC₁₂ and LiC₆ are identifiable, and their intensities vary systematically with aging. For example, the intensity of the LiC₆ peaks tends to decrease as the traction battery ages, indicating that fewer lithium ions are available for intercalation during the final stages of charging. In the fully discharged state, the graphite diffraction peaks show a gradual weakening and broadening with progressing aging. This behavior suggests a loss of crystalline active material in the negative electrode. These observations indicate that the diffraction peak intensities of lithium-carbon compounds may serve as a microscopic indicator of the maximum lithium storage capability of the traction battery in each cycle, and hence of the loss of lithium inventory.
SEM images of negative electrodes from a fresh cell and from traction battery cells aged to different SOH levels reveal that as aging advances, the surface of graphite particles becomes increasingly rough, and a thicker layer forms on the particle edges. This new layer most plausibly corresponds to the SEI film that grows as a result of electrolyte decomposition at the negative electrode. The SEM results corroborate the XRD findings by confirming that the SEI coverage increases with aging and that its formation consumes cyclable lithium ions.
4. Quantitative Calculation and Correlation Analysis of Degradation Modes Across Micro-Macro Scales
This chapter presents a quantitative framework that couples the macro-level diagnosis of degradation modes based on the OCV curve with micro-level measurements performed on harvested electrodes. The overall goal is to validate the macro-diagnostic results through independent microscopic measurements and, in particular, to quantify the degradation modes of the traction battery at both the cell and material level.
4.1 Construction of the OCV-based Degradation Diagnosis Model
From a physical viewpoint, the OCV curve of a full traction battery cell is determined by the difference between the positive electrode potential and the negative electrode potential, each of which is expressed in its own coordinate system as a function of the electrode state of lithiation. Various degradation modes affect these electrode potential curves by shifting, stretching, or compressing the corresponding coordinate systems. To identify and quantify the degradation modes in a unified manner, I converted the positive and negative electrode coordinates into a common reference frame using a series of affine transformations. These transformations account for the following physical effects:
1. LAM in the positive electrode reduces the capacity of the positive electrode and therefore the range of the positive electrode state of lithiation, which corresponds to a compressive transformation of the positive coordinate axis.
2. LAM in the negative electrode reduces the capacity of the negative electrode, which corresponds to a compressive transformation of the negative coordinate axis.
3. LLI shifts the relative alignment between the positive and negative electrode operating windows, which corresponds to a translation of the coordinates.
After linearizing the transformation relationships, the coordinate conversion between the positive electrode state of lithiation and the negative electrode state of lithiation may be written in terms of four independent parameters. The first two parameters \(X_1\) and \(X_2\) represent the available positive and negative electrode capacities, respectively:
$$ X_1 = C_{PE} – \text{LAM}_{PE}^{li} – \text{LAM}_{PE}^{de} \tag{5} $$
$$ X_2 = C_{NE} – \text{LAM}_{NE}^{li} – \text{LAM}_{NE}^{de} \tag{6} $$
The third parameter captures the misalignment between the negative and positive electrode coordinate systems caused by the lithium inventory loss and the difference between the lithium-containing portion of the positive and negative LAM:
$$ X_3 = \text{LAM}_{NE}^{li} – \text{LAM}_{PE}^{de} + \text{LLI} \tag{7} $$
Finally, the fourth parameter corresponds to the lithiation state at the lower cutoff voltage of the full traction battery:
$$ X_4 = y_{neg,0} \tag{8} $$
Using the relation between capacity and lithiation state, the full-cell OCV curve can be expressed as:
$$ U_{ocv}(x_{ANE}) = U_p\left(\frac{X_2 x_{ANE} + X_3}{X_1}\right) – U_n\left(x_{ANE}\right) \tag{9} $$
where \(x_{ANE}\) is the state of lithiation in the available negative electrode coordinate system, \(U_p\) is the positive electrode potential function, and \(U_n\) is the negative electrode potential function. The four parameters were identified by minimizing the root-mean-square error between the model-predicted OCV curves and measured OCV curves obtained from the low-rate discharge experiments. The particle swarm optimization algorithm was used to solve the resulting nonlinear optimization problem.
4.2 Quantitative Diagnosis Results Based on the OCV Model
The identification results obtained from the battery cells at different aging states show that the available positive electrode capacity is nearly constant across the whole SOH range. In contrast, the available negative electrode capacity declines gradually with aging, and the third parameter increases almost linearly as the SOH decreases. Since the third parameter in this cell chemistry is dominated by the contribution of LLI, the result indicates that LLI is the dominant degradation mode in the early stages of aging.
After identifying the four model parameters, the separation between the lithium-containing and lithium-free portions of the active material losses can be derived under the assumption that the probability of particle fracture is independent of the lithiation state. When the active particles fracture, the corresponding isolated portion retains the same average lithiation state as the remaining active material. The average lithiation state of the active particles at the moment of fracture can be approximated as the midpoint between the minimum and maximum lithiation states reached during cycling:
$$ x_{crk,p} = \frac{x_{min}^{APE} + x_{max}^{APE}}{2}, \qquad x_{crk,n} = \frac{x_{min}^{ANE} + x_{max}^{ANE}}{2} \tag{10} $$
The lithium-containing portions of the active material losses are then expressed as follows:
$$ \text{LAM}_{PE}^{li} = C_{APE}^{fresh} \cdot x_{crk,p} \cdot \left[\frac{C_{APE}^{fresh} – C_{APE}^{aging}}{C_{APE}^{fresh}}\right] \tag{11} $$
$$ \text{LAM}_{NE}^{li} = C_{ANE}^{fresh} \cdot x_{crk,n} \cdot \left[\frac{C_{ANE}^{fresh} – C_{ANE}^{aging}}{C_{ANE}^{fresh}}\right] \tag{12} $$
where \(C_{APE}^{fresh}\), \(C_{ANE}^{fresh}\), \(C_{APE}^{aging}\), and \(C_{ANE}^{aging}\) denote the available positive and negative capacities for the fresh and aged traction battery cells, respectively. The lithium-free portions are then obtained by subtracting the lithium-containing portions from the total losses. Fig. 1 shows the evolution of the different capacity loss constituents as a function of the SOH of the traction battery.
Among the distinct loss components, LLI predominates and increases with aging, reaching a maximum value of 3.40 Ah at the lowest investigated SOH. The loss of negative electrode active material, both lithium-containing and lithium-free fractions, also grows with aging, reaching a combined total of 2.83 Ah at the most aged state. The losses of positive electrode active material remain negligible over the entire investigated SOH window, which is consistent with the well-known structural robustness of the olivine LiFePO₄ lattice. These macro-level diagnostic results suggest a clear degradation pathway for the traction battery under study: progressive consumption of cyclable lithium due to SEI growth combined with a gradual loss of negative electrode active material, while the positive electrode remains largely intact.
4.3 Microscopic-level Quantification of Degradation Modes
4.3.1 Half-cell Capacity Changes and LAM Correlation
To verify the macro-level diagnosis through an independent measurement, I assembled half-cells using the harvested electrode disks and measured their discharge capacities at low current rate. The positive electrode half-cell capacities remain almost unchanged regardless of the SOH of the parent traction battery, demonstrating that the positive electrode active material is essentially preserved during aging. In contrast, the negative electrode half-cell capacity decreases consistently with decreasing SOH, confirming the loss of negative electrode active material. This qualitative agreement between half-cell measurements and OCV diagnosis is illustrated in Fig. 2, where the half-cell capacity and the OCV-diagnosed available negative electrode capacity are plotted on the same figure using different ordinate scales.
To quantitatively compare the half-cell capacity loss with the negative electrode active material loss diagnosed from the OCV model, I performed a normalization procedure using cell #5, whose SOH is closest to that of a fresh cell, as a reference. The normalized values are summarized in Table 4.
| Parameter | #5 | #6 | #7 | #8 |
|---|---|---|---|---|
| Half-cell capacity loss (%) | 0 | 4.55 | 8.91 | 11.54 |
| OCV-diagnosed LAM (%) | 0 | 3.20 | 7.93 | 10.40 |
Table 4: Comparison of normalized negative electrode capacity losses between half-cell measurement and OCV diagnosis.
The maximum discrepancy between the two approaches is only 1.35 percentage points, indicating an excellent agreement between the half-cell measurement and the OCV-based diagnosis for the negative electrode active material loss.
4.3.2 Maximum Lithium Content Calculation and LLI Correlation
For the quantification of the loss of lithium inventory at the microscopic scale, the maximum lithium content per cycle was derived from the XRD measurements of negative electrodes harvested from fully charged traction battery cells. Since the negative electrode capacity is not limiting during the final stage of charging, the total amount of lithium intercalated into the negative electrode at the fully charged state can be expressed using the diffraction intensities of the LiC₆ and LiC₁₂ phases:
$$ x_{LiC}^{aging} = \frac{I_{LiC_6}}{I_{LiC_6}+I_{LiC_{12}}} \cdot \frac{1}{6} + \frac{I_{LiC_{12}}}{I_{LiC_6}+I_{LiC_{12}}} \cdot \frac{1}{12} \tag{13} $$
where \(I_{LiC_6}\) and \(I_{LiC_{12}}\) are the corresponding diffraction intensities. The loss of lithium inventory based on the XRD data was then calculated by comparing the lithium content of the aged cell with that of a fresh cell:
$$ \text{LLI}_{XRD} = \frac{x_{LiC}^{fresh} – x_{LiC}^{aging}}{x_{LiC}^{fresh}} \times 100\% \tag{14} $$
Fig. 3 plots the computed maximum lithium content change against the SOH of the traction battery. The result reveals that the maximum lithium content change follows a generally increasing trend with aging, growing roughly linearly until about 85% SOH and rising more steeply afterwards. However, the maximum lithium change reaches 24.96%, which is substantially greater than the total cell capacity loss. The root cause of this overprediction lies in the normalization of the XRD data by the total graphite content, because the negative electrode active material itself decreases with aging. The overestimation becomes increasingly pronounced as aging proceeds, which is consistent with the progressive LAM in the negative electrode.
To correct this bias, I used the half-cell capacity changes measured from the fully discharged electrodes as an indicator of the actual active material loss in the negative electrode. Since the cells #1-#4 and #5-#8 were aged to similar SOH values, the half-cell capacity losses measured from the latter group can be interpolated to estimate the active-material correction factor for the former group. The corrected lithium content is then given by:
$$ x_{LiC}^{‘} = \frac{1}{1-\text{LAM}_{NE}’} \left[ \frac{I_{LiC_6}}{I_{LiC_6}+I_{LiC_{12}}} \cdot \frac{1}{6} + \frac{I_{LiC_{12}}}{I_{LiC_6}+I_{LiC_{12}}} \cdot \frac{1}{12} \right] \tag{15} $$
$$ \text{LLI}^{‘} = \frac{x_{LiC}^{‘fresh} – x_{LiC}^{‘aging}}{x_{LiC}^{‘fresh}} \times 100\% \tag{16} $$
Fig. 4 compares the corrected maximum lithium content loss with the OCV-diagnosed LLI. After correction, the two independent methods agree both in trend and in magnitude, with a maximum deviation of only 1.68 percentage points. The joint results successfully demonstrate that the OCV-based degradation diagnostic model quantitatively reproduces the lithium inventory loss in the traction battery, thereby validating its accuracy and applicability.
5. IC Curve-based Diagnosis of Traction Battery Degradation Modes
Although the OCV-based diagnostic model provides an accurate and cross-validated tool for determining the degradation modes of traction batteries, its computational complexity makes it less convenient for practical applications. Conversely, the incremental capacity (IC) curve, which is the derivative of the capacity with respect to voltage, amplifies subtle voltage variations and maps them into clearly distinguishable peaks. Because IC analysis relies only on voltage and current data, it is computationally efficient and thus well-suited for onboard traction battery management. In this chapter, I study the relationship between the degradation modes and the features of both the OCV and the IC curves, and I propose a quantitative IC-based diagnostic method for LLI and LAM.
5.1 Influence of Degradation Modes on OCV and IC Curves
To systematically investigate the effect of each degradation mode on the OCV and IC curves, I generated synthetic voltage curves by varying individually the values of lithium inventory loss (LLI), lithium-free negative electrode active material loss (LAMⁱⁿᵈᵉᵉ), and lithium-containing negative electrode active material loss (LAMⁿᵉ). Positive electrode losses were neglected because the previous diagnostic results showed that they remain negligible for the LiFePO₄ cell chemistry under consideration.
The simulation parameters were selected based on the actual diagnosis of the tested traction battery cells and are listed in Table 5. The constructed cells reproduce the progression from a fresh cell to a severely aged cell by proportionally increasing the magnitude of each degradation mode.
| Constructed cell | LAMⁱⁿᵈᵉ (Ah) | LAMⁿᵉ (Ah) | LLI (Ah) |
|---|---|---|---|
| 1 | 0 | 0 | 0 |
| 2 | 0.25 | 0.25 | 0.50 |
| 3 | 0.50 | 0.50 | 1.00 |
| 4 | 0.75 | 0.75 | 1.50 |
| 5 | 1.00 | 1.00 | 2.00 |
| 6 | 1.25 | 1.25 | 2.50 |
| 7 | 1.50 | 1.50 | 3.00 |
| 8 | 1.75 | 1.75 | 3.50 |
Table 5: Specific degradation mode values used for synthetic battery cells.
The OCV curves of the synthetic cells indicate that both LLI and LAMliNE cause a progressive compression of the accessible lithiation window, which is a direct consequence of the early attainment of the upper voltage limit. By contrast, LAMdeNE induces almost no change in the overall range of the lithiation window, since the positive electrode is the limiting electrode in the charged state. The combined effect of multiple degradation modes results in a more severe compression than any single mode applied independently.
From the constructed cells, I next calculated the IC curves using the voltage-capacity relation and characterized the influence of the degradation modes on the individual peaks. The IC curve of the fresh LiFePO₄ traction battery displays three distinct peaks in the charging direction, which are labelled in increasing voltage order as ⑤*II peak, ②*II peak, and ①*II peak. The simulation results show that the loss of lithium inventory predominately reduces the amplitude and the area of the ①*II peak, while leaving the ②*II peak nearly intact. The lithium-containing negative electrode active material loss reduces both the ②*II peak and the ①*II peak. In contrast, the lithium-free negative electrode active material loss has an opposite effect on the high-voltage peak: it increases the ①*II peak area while decreasing the ②*II peak area. When both lithium-containing and lithium-free negative losses act together, their opposite influences on the ①*II peak tend to cancel, so that the reduction of the ①*II peak area can be primarily attributed to the loss of lithium inventory. Meanwhile, the ②*II peak area is found to be governed by the total negative electrode active material loss.
5.2 Quantitative IC-based Diagnostic Method
The experimental IC curves measured from the eight aged traction battery cells reproduce the same qualitative trends as observed in the simulation study. However, the characteristic peaks in the experimental curves exhibit a slight shift toward higher voltages with aging, which originates from the increase of internal resistance and its associated polarization contribution, an effect not captured in the simple simulation model.
I compared two alternative feature metrics, namely, the peak height and the peak area, for calculating the degradation modes. The peak area appears to be a more robust indicator than the peak height, because the area integral represents the overall compression of the curve better than the local maximum value, which is more sensitive to smoothing and noise. The diagnostic formulas for the total negative electrode active material loss and the lithium inventory loss based on peak areas are given below:
$$ \text{LAM}_{NE} = \frac{\text{Area}_{B,fresh} – \text{Area}_{B,aging}}{\text{Area}_{B,fresh}} \times 100\% \tag{17} $$
$$ \text{LLI}_{IC} = \frac{\text{Area}_{C,fresh} – \text{Area}_{C,aging}}{\text{Capacity}_{fresh}} \times 100\% \tag{18} $$
where \(\text{Area}_{B,fresh}\) and \(\text{Area}_{B,aging}\) denote the areas of the ②*II peak for the fresh and aged traction batteries, respectively, while \(\text{Area}_{C,fresh}\) and \(\text{Area}_{C,aging}\) denote the same quantities for the ①*II peak. The denominator in Eq. (18) uses the full capacity of the fresh traction battery rather than the initial value of the peak area, because the influence of the lithium inventory loss on the OCV curve manifests as a shift of the entire voltage window, which is not captured accurately by the area of a single peak alone.
Fig. 5 compares the IC-based diagnostic results with the OCV-based reference results. It can be seen that the LLI values obtained from the IC method and the OCV method show strong agreement, with the maximum difference being only 1.79 percentage points. The LAM values are also consistent, with the maximum deviation limited to 1.62 percentage points. The validation demonstrates that the IC-based diagnostic method can reliably determine the main degradation modes of the traction battery, provided an appropriate baseline for the fresh cell is available.
5.3 Applicability of the IC-based Method under Different Current Rates
In actual traction battery operation, current rates rarely remain as low as C/25, which was used in the previous analysis. Therefore, it is essential to examine the influence of the current rate on the IC-based diagnosis. I collected capacity-voltage data at C/10, C/5 and C/3 and applied the same diagnostic methodology to investigate the rate dependence of the calculated degradation modes.
Two important effects are observed when the current rate increases. First, the resistance polarization shifts the characteristic peaks of the IC curves along the voltage axis: the charging peaks move toward higher voltages, whereas the discharging peaks move toward lower voltages. Second, the peak amplitudes decrease at higher rates because the effective capacity utilization is reduced by the polarization. These modifications affect the peak areas and therefore bias the diagnostic results if no correction is applied.
The LAMNE values obtained at C/10, C/5 and C/3 follow the same basic trend as the reference values determined at C/25, although the values at each rate display some scatter. This scatter originates from the non-symmetric shape of the ②*II peak, whose integration boundary is more difficult to determine accurately when the peak is deformed by polarization effects. In contrast, the LLI values exhibit a systematic negative bias as the current rate increases; the absolute errors at C/10, C/5 and C/3 reach maximum values of 3.25%, 4.77% and 6.07%, respectively.
Because the rate-dependent bias in the LLI result follows an approximately linear relationship with the inverse of the C-rate, I introduced a rate correction factor krate defined with respect to the C/25 reference. The correction factors determined from the measured data are listed in Table 6.
| C-rate | C/25 | C/10 | C/5 | C/3 |
|---|---|---|---|---|
| Correction factor | 1.00 | 1.19 | 1.26 | 1.47 |
Table 6: Rate correction factors of the LLI diagnosis results.
Application of the correction factors substantially improves the diagnostic accuracy. Table 7 presents the corrected LLI values at the three higher rates, together with the reference C/25 values. The maximum deviation between the corrected results and the C/25 reference is reduced to 1.68 percentage points, demonstrating the robustness and practical applicability of the proposed rate-corrected IC-based diagnostic method.
| SOH (%) | C/25 | C/10 (corrected) | C/5 (corrected) | C/3 (corrected) |
|---|---|---|---|---|
| 96.54 | 1.08 | 1.21 | 1.28 | 1.49 |
| 93.47 | 4.10 | 3.93 | 4.47 | 2.77 |
| 90.61 | 5.05 | 6.33 | 5.77 | 5.39 |
| 89.12 | 7.83 | 7.32 | 7.54 | 6.84 |
| 86.77 | 10.99 | 10.57 | 10.84 | 10.96 |
| 83.63 | 13.46 | 12.20 | 11.87 | 13.11 |
| 79.76 | 16.43 | 14.91 | 14.75 | 15.26 |
| 79.41 | 16.89 | 16.60 | 16.29 | 15.95 |
Table 7: Corrected LLI results at different C-rates and different SOH values of the traction battery.
These results confirm that the IC curve combined with a rate-correction procedure offers a computationally efficient yet reliable route to the online degradation diagnosis of traction batteries. The methodology aligns well with real-world operation, where charge/discharge rates vary across a broad range depending on driving conditions and charging infrastructure.
6. Conclusions and Outlook
In this thesis, I have developed a systematic framework for diagnosing the degradation modes of LiFePO₄ traction batteries by combining macroscopic electrical analyses with microscopic material characterizations. The main conclusions of the work are summarized below.
First, the analysis of full-cell performance data together with XRD and SEM measurements of aged electrodes reveals a clear qualitative correlation between microscopic features and the macroscopic aging state of the traction battery. The diffraction peak intensity of lithium-carbon compounds in fully charged negative electrodes decreases systematically with aging, signifying fewer available lithium insertion sites per cycle. Likewise, SEM images demonstrate that the SEI layer thickens progressively as aging proceeds. These observations suggest that the loss of cyclable lithium inventory is coupled to the continuous growth of the surface film on the negative electrode.
Second, a quantitative OCV-based degradation diagnostic model was constructed. The model is built on the affine coordinate transformations between the positive and negative electrode lithiation axes and contains four physically meaningful parameters. Applying this model to traction battery cells aged to different SOH levels enabled the decomposition of the total capacity loss into contributions from LLI, lithium-containing and lithium-free losses of negative electrode active material, and corresponding losses in the positive electrode. The diagnostic results show that the positive electrode of the LiFePO₄ cell remains practically unchanged, whereas LLI and the negative electrode LAM accumulate with aging up to maximum capacity losses of 3.40 Ah and 2.83 Ah, respectively.
Third, the macro-level diagnostic results were quantitatively validated at the microscopic level. Half-cell capacity measurements performed on harvested negative electrode disks correlate very closely with the OCV-diagnosed negative electrode LAM, the maximum deviation being only 1.35 percentage points. The maximum lithium storage capability was estimated from the XRD peak intensities of the lithium-graphite intercalation compounds, and after correcting for the loss of negative electrode active material, the resulting lithium inventory loss is in excellent agreement with the OCV-diagnosed LLI, with a maximum error of only 1.68 percentage points. This cross-validation firmly establishes the accuracy and reliability of the OCV-based macro-diagnostic model.
Fourth, the sensitivity analysis of the OCV and IC curves with respect to distinct degradation modes clarified their quantitative relationship. The lithium-free and lithium-containing negative electrode active material losses exert opposite influences on the high-voltage IC peak, and their combination largely cancels out, making the change in its area a suitable proxy for the loss of lithium inventory. Conversely, the middle IC peak area is insensitive to LLI and mainly responds to the total loss of negative electrode active material. By exploiting these unique relationships, I proposed an IC-based diagnostic method that calculates LLI and LAM directly from the peak areas. The comparison with the OCV-based results demonstrates a maximum difference of only 1.79% and 1.62 for LLI and LAM, respectively.
Finally, the practical adaptability of the IC-based diagnostic method was evaluated at various charge/discharge rates. Although the LAM results remain essentially unchanged at all rates studied, the LLI values exhibit a negative bias at higher current rates. To compensate for this rate dependence, a multiplicative correction factor was introduced. After correction, the maximum error in the LLI values decreases to just 1.68 percentage points, confirming the robustness of the proposed method and its suitability for real-world traction battery applications.
Several avenues for future work remain open. In particular, the polynomial center-smoothing method used to compute the IC curves can be refined to handle non-symmetric peaks more accurately, thereby reducing the residual scatter in the calculated LAM values. Moreover, the rate-correction coefficients derived in this work were obtained under well-controlled laboratory conditions. Future efforts could focus on reconstructing the OCV curves from real vehicle operation data and updating the rate-correction factors online, enabling robust and automated degradation-mode diagnostics for traction batteries under real driving conditions.