
I approach electric vehicle charging assembly as a system problem rather than a collection of isolated workstation tasks. The rapid growth of electric vehicle charging demand has changed the production logic of charging equipment: small-batch, manual-heavy build methods are increasingly insufficient when orders become larger, configurations become more varied, and delivery windows become shorter. In my assessment, the central challenge is not simply to add automation, but to create a traceable, repeatable, and balanced electric vehicle charging assembly process in which structural work, electrical connection, testing, data capture, and quality feedback support one another. I therefore focus on the practical relationship among process sequence, workstation cycle time, modular preassembly, smart equipment, and a closed-loop quality record. The purpose of my analysis is to show how an electric vehicle charging intelligent production line can reduce waiting, misassembly, rework, and late-stage inspection pressure while improving product consistency and delivery reliability.
I see electric vehicle charging products as dense electromechanical assemblies. A single cabinet may contain a enclosure, mounting plates, doors, thermal paths, protective components, circuit breakers, contactors, power modules, metering units, control boards, communication modules, terminal blocks, grounding conductors, wiring harnesses, displays, emergency-stop devices, and user-interface components. Each item has its own installation tolerance, tightening requirement, routing rule, and inspection logic. If the process is designed only around functional completion, the line may appear to work in low-volume conditions but becomes fragile when volume rises. My view is that electric vehicle charging assembly should be designed from the beginning as a data-linked flow in which every material batch, torque value, test result, and repair action can be associated with a specific product identity.
My Analytical Frame for Electric Vehicle Charging Production
I begin with the line takt because electric vehicle charging assembly efficiency is meaningless without a demand rhythm. If a line is expected to deliver a certain number of units per shift, the available production time and the demand volume define the target takt. I express this as:
$$TT=\frac{T_{available}}{Q_{demand}}$$
Here, \(TT\) is the target takt time, \(T_{available}\) is the effective production time after planned breaks, maintenance, and changeovers, and \(Q_{demand}\) is the required output quantity. I use this value as the reference for every workstation. A work element that exceeds takt becomes a bottleneck; a work element that is far below takt may indicate wasted capacity or poor work combination. In electric vehicle charging assembly, the target takt should be calculated separately for different cabinet families, because high-power cabinets, AC cabinets, and modular charging units do not have identical component counts or testing durations.
I also use a workstation cycle-time model to separate pure work from waiting and quality loss:
$$CT_i=t_i+w_i+q_i+r_i$$
In this expression, \(CT_i\) is the observed cycle time at workstation \(i\), \(t_i\) is the value-adding assembly time, \(w_i\) is waiting time caused by material delay or line imbalance, \(q_i\) is inspection and confirmation time, and \(r_i\) is rework or retry time. My purpose in separating these elements is to avoid treating all time as equal. In many electric vehicle charging assembly lines, the largest hidden loss is not the actual tightening or wiring action, but the repeated search for parts, the waiting for test results, and the handling of preventable defects.
For line balance, I calculate balance efficiency and smoothness index as follows:
$$E_{balance}=\frac{\sum_{i=1}^{n} t_i}{n \cdot CT_{max}} \times 100\%$$
$$SI=\sqrt{\sum_{i=1}^{n}\left(CT_{max}-CT_i\right)^2}$$
\(E_{balance}\) tells me how well the total work content is distributed across workstations, while \(SI\) shows the dispersion of cycle times. A high balance efficiency with a low smoothness index is preferable because it indicates that work is both well distributed and stable. In electric vehicle charging assembly, I do not pursue perfect numerical balance at the cost of excessive task fragmentation. Too many small work elements can increase handling, scanning, and coordination losses, especially when harnesses and power modules are involved.
The overall equipment effectiveness of automated or semi-automated electric vehicle charging workstations can be summarized as:
$$OEE=A \times P \times Q$$
where \(A\) is availability, \(P\) is performance efficiency, and \(Q\) is quality rate. I apply this formula to smart torque tools, automated wire-processing equipment, testing benches, and automated guided vehicles. For example, if a torque tool is available 95% of the scheduled time, performs at 92% of its rated action rate, and produces 99% acceptable fastening results, its OEE is approximately \(0.95 \times 0.92 \times 0.99 = 0.865\), or 86.5%. This kind of calculation keeps my attention on the combined effect of downtime, speed loss, and quality loss rather than on a single indicator.
I summarize the main process objects of an electric vehicle charging assembly line in the table below.
| Process object | Typical content in electric vehicle charging assembly | My control focus | Data to capture |
|---|---|---|---|
| Cabinet structure | Base frame, enclosure, mounting plate, door, sealing, protective parts | Positioning datum, squareness, gap, fastener torque | Cabinet code, fixture ID, torque value, first-piece result |
| Electrical components | Breakers, contactors, power modules, control boards, meters, communication modules | Model verification, mounting direction, clearance, terminal orientation | Component batch, scan result, operator ID, station time |
| Wiring harness | Main circuit, control circuit, communication circuit, grounding conductor | Route separation, terminal crimp, insertion depth, strain relief | Harness part number, crimp force, continuity result, route confirmation |
| Thermal system | Heat sink, fan, air duct, thermal pad, ventilation path | Contact pressure, airflow clearance, fastener sequence | Thermal pad batch, fan ID, torque record, functional test result |
| Testing and commissioning | Grounding, insulation, dielectric strength, communication, charging simulation, aging | Mandatory test sequence, pass-fail lock, fault code | Test equipment ID, raw value, limit, result, repair history |
| Final release | Appearance, labeling, accessory completeness, packing | Traceability completeness, final visual check, release authorization | Final inspection record, label image, release time, packing list |
I use the following formula to describe the relationship between throughput and bottleneck cycle time:
$$C_{line}=\frac{3600}{CT_{bottleneck}}$$
where \(C_{line}\) is the theoretical hourly capacity and \(CT_{bottleneck}\) is measured in seconds. If the bottleneck is the wiring and commissioning station with a cycle time of 1,500 seconds, the theoretical capacity is 2.4 units per hour. I treat this value as a planning reference only, because actual output is also affected by material availability, changeovers, test retries, and operator variance. The key point is that improving a non-bottleneck station in electric vehicle charging assembly may not increase line output at all; it may only increase work-in-process inventory.
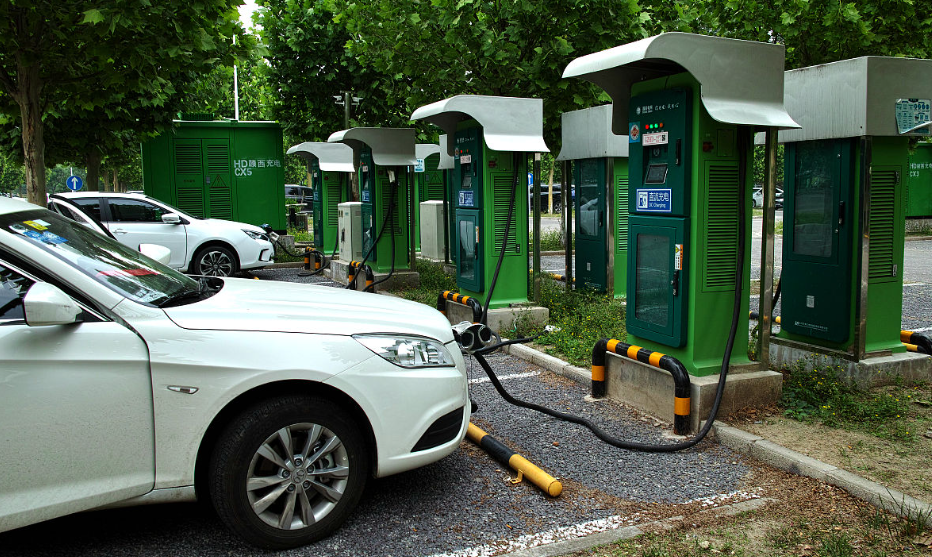
Assembly Process Architecture in Electric Vehicle Charging
I structure electric vehicle charging assembly into five connected layers: structural preparation, electrical build, module integration, test and commissioning, and final release. The sequence matters because a structural defect can propagate into electrical alignment problems, while a late electrical defect can force unnecessary retesting and cabinet reopening. I prefer to place verification as close as possible to the action that creates quality. This reduces the distance between cause and detection and makes the electric vehicle charging quality record more meaningful.
A practical route I recommend is cabinet preassembly, structural verification, component installation, harness connection, module installation, parameter writing, safety testing, functional testing, aging, final inspection, and packing. I do not treat this as a rigid sequence for every product family. For high-power electric vehicle charging cabinets, power module installation and thermal-interface checks may need a separate sub-line before final integration. For smaller AC charging units, structural and electrical tasks may be combined into fewer stations, provided that the traceability locks remain intact.
| Stage | Main work content | Required process lock | Typical output record |
|---|---|---|---|
| Cabinet preassembly | Base alignment, mounting plate fixing, door and seal installation, protective parts | Fixture scan and first-piece confirmation | Cabinet ID, fixture ID, torque result, visual result |
| Structural verification | Verticality, hole alignment, door gap, grounding point preparation | Measurement entry before release | Measured values, pass-fail status, inspector ID |
| Component installation | Breakers, contactors, power modules, control boards, meters, communication units | Component scan and mounting-direction check | Batch code, model code, station time, scan result |
| Harness connection | Main circuit, control circuit, communication circuit, grounding, labeling | Harness scan, terminal check, continuity test | Harness ID, torque or crimp data, continuity result |
| Module integration | Power module, display module, metering module, thermal module | Module code binding and interface confirmation | Module serial number, interface check, fastening record |
| Parameter writing | Firmware version, configuration, communication address, calibration data | Automatic version validation | Firmware hash, configuration ID, write result |
| Safety testing | Grounding continuity, insulation resistance, dielectric strength | Hard interlock to next station | Raw value, limit, test equipment ID, pass-fail |
| Functional testing | Communication, metering, display, emergency stop, start-stop simulation | Automatic test script and fault code capture | Test log, fault code, retest count |
| Aging | Continuous operation, thermal monitoring, communication stability | Time-based completion and anomaly lock | Temperature curve, communication log, aging result |
| Final release | Appearance, labels, accessories, packing, document completeness | Traceability completeness check | Final inspection record, release authorization, packing record |
I use a simple readiness condition for each electric vehicle charging workstation:
$$R_i = M_i \cdot S_i \cdot D_i \cdot T_i$$
where \(M_i\) indicates material readiness, \(S_i\) indicates fixture and tool readiness, \(D_i\) indicates data and instruction readiness, and \(T_i\) indicates operator qualification readiness. Each factor is binary in the simplest form, so \(R_i=1\) only when all four are available. In my experience, many line stoppages in electric vehicle charging assembly are caused by one of these factors being false even though the station itself is technically capable. Making readiness explicit prevents the line from starting work that will later be interrupted.
Structural Assembly Control in Electric Vehicle Charging
I treat structural assembly as the geometric foundation of electric vehicle charging quality. Cabinet positioning, mounting-plate flatness, door alignment, sealing continuity, and protective-component installation determine whether later electrical components can be installed without stress. If a mounting plate is distorted, a power module may not sit correctly on its thermal interface; if a door is misaligned, sealing performance and appearance may fail; if a grounding point is painted or contaminated, electrical safety testing may become unstable. I therefore place fixture-based positioning and first-piece verification at the front of the line rather than relying on final inspection.
For bolted joints, I use a torque window rather than a single nominal value:
$$T_{min} \le T_{actual} \le T_{max}$$
where \(T_{actual}\) is the recorded torque, \(T_{min}\) is the lower control limit, and \(T_{max}\) is the upper control limit. For critical electric vehicle charging connections, I also require a recheck mark after fastening. The mark is not merely a visual symbol; it is connected to the torque record and the product identity. If a joint is reworked, the original torque record should not be silently overwritten. I prefer to keep a revision history that shows the original value, the reason for rework, the new value, and the person or station that performed the correction.
I estimate structural assembly time using a work-element model:
$$t_{struct}=\sum_{j=1}^{m} \left(a_j + b_j \cdot n_j\right)$$
Here, \(a_j\) is the fixed time for work element \(j\), \(b_j\) is the time per repeated action, and \(n_j\) is the number of repetitions. For example, mounting-plate fastening may have a fixed positioning time plus a per-screw tightening time. This model helps me decide whether to combine tasks, add a second operator, or move a subassembly to a preassembly area. If the repeated-action term dominates, a smart tool or fixture improvement may be effective. If the fixed-time term dominates, work sequencing or material presentation may be more important.
| Structural control point | Why it matters in electric vehicle charging | My verification method | Release condition |
|---|---|---|---|
| Cabinet datum | Determines alignment of all later components | Fixture stop and datum check | No visible gap and datum confirmed |
| Mounting plate flatness | Affects thermal contact and component stress | Straightedge or laser measurement | Within drawing tolerance |
| Door and panel gap | Affects sealing, appearance, and service access | Gap gauge and visual check | Uniform gap within limit |
| Fastener torque | Prevents loosening under vibration and thermal cycling | Smart torque tool with record | Within torque window and marked |
| Grounding point condition | Supports safe electric vehicle charging operation | Visual check and continuity test | Clean metal contact and continuity pass |
| Sealing path | Protects internal components from dust and moisture | Visual check and sample seal test | Continuous seal and no damage |
I also pay attention to material presentation in structural assembly. If cabinets, rails, brackets, seals, and doors are delivered in an order that does not match the assembly sequence, operators tend to search, lift, and reposition parts repeatedly. This creates fatigue and increases the chance of wrong-part installation. In an electric vehicle charging intelligent line, I prefer sequenced material kits and scan-based confirmation. The scan should confirm not only the part number but also the applicable cabinet family and the current order. This is especially important when multiple electric vehicle charging models share similar brackets or door hardware.
Electrical Assembly Control in Electric Vehicle Charging
I regard electrical assembly as the highest-risk area in electric vehicle charging production because it combines dense components, multiple voltage domains, communication wiring, and safety-critical grounding. The work should begin with a layout check, followed by main-circuit, control-circuit, communication-circuit, and protective-circuit connection. I do not allow wiring to proceed until the component layout has been confirmed, because correcting a misplaced contactor or power module after harness installation is far more expensive than catching it at the installation station.
For terminal crimping, I use a pull-force acceptance condition:
$$F_{pull} \ge F_{spec}$$
where \(F_{pull}\) is the measured pull force and \(F_{spec}\) is the minimum specified force for the conductor and terminal combination. I combine this with a visual check of strand damage, insulation insertion, and terminal deformation. In electric vehicle charging harnesses, a terminal that passes continuity but has insufficient pull force may fail later under vibration or thermal cycling. Therefore, continuity alone is not enough for my quality logic.
I also use a routing separation rule between power and signal conductors:
$$d_{ps} \ge d_{min}$$
where \(d_{ps}\) is the physical separation distance between power and signal routes and \(d_{min}\) is the minimum separation required by the design. When physical separation is not possible, I require a documented barrier, shielded route, or approved crossing angle. The purpose is to reduce electromagnetic interference and improve communication stability during electric vehicle charging operation. I prefer to encode this rule directly in the harness routing instruction and workstation visual aid rather than leaving it to individual interpretation.
The probability of a wiring defect can be modeled as:
$$P_{defect}=1-\prod_{k=1}^{K}\left(1-p_k\right)$$
where \(p_k\) is the probability of defect type \(k\). This formula helps me see that even small error probabilities can accumulate quickly across many terminals and connections. If a harness has many opportunities for terminal, route, or label errors, the overall defect probability becomes significant unless error-proofing is applied. Scan verification, color-coded connectors, keyed terminals, preassembled harness kits, and automatic continuity testing are therefore not optional extras in electric vehicle charging assembly; they are necessary controls.
| Electrical assembly area | Main risk | My error-proofing method | Record requirement |
|---|---|---|---|
| Main circuit | Wrong breaker rating, loose terminal, incorrect phase sequence | Component scan, torque tool, phase-sequence test | Component batch, torque value, test result |
| Control circuit | Wrong terminal, reversed polarity, damaged insulation | Keyed connector, color code, continuity test | Continuity result, route confirmation |
| Communication circuit | Crossed signal pair, poor shielding, wrong address | Prebuilt harness, address scan, communication test | Harness ID, address, communication log |
| Grounding system | Paint contamination, missing fastener, high resistance | Dedicated grounding point, torque record, continuity test | Resistance value, torque value, inspector ID |
| Power module interface | Poor thermal contact, uneven fastening, connector damage | Fastening sequence, thermal pad check, connector inspection | Torque sequence, module serial number, visual result |
| Labeling | Wrong label, missing label, illegible content | Label printer with scan validation and image capture | Label content, image, print time |
I use a harness preparation model to decide whether to move wiring work upstream:
$$CT_{total}=CT_{prep}+CT_{install}+CT_{verify}+CT_{rework}$$
If \(CT_{prep}\) can be performed off-line with higher repeatability, the total assembly cycle may fall even though the total work content is not eliminated. In my experience, harness preassembly is one of the most practical improvements in electric vehicle charging assembly because it separates the high-skill crimping and routing preparation from the constrained total-assembly station. The main line then receives a verified harness package instead of a bundle of loose wires.
Testing and Commissioning in Electric Vehicle Charging
I organize testing and commissioning by risk priority. Safety tests should come before functional tests, and functional tests should come before aging and final release. A typical sequence is grounding continuity, insulation resistance, dielectric strength, communication check, metering check, display check, emergency-stop check, start-stop simulation, charging simulation, parameter validation, aging, and final confirmation. I do not permit functional testing to proceed if a safety test has failed. The line control system should enforce this sequence automatically rather than relying on human memory.
For insulation resistance, I use a threshold condition:
$$R_{ins} \ge R_{limit}$$
where \(R_{ins}\) is the measured insulation resistance and \(R_{limit}\) is the minimum acceptable value under the specified test voltage and duration. For grounding continuity, I use the opposite directional condition:
$$R_{gnd} \le R_{gnd,max}$$
where \(R_{gnd}\) is the measured grounding resistance. I record the raw measurement, not only the pass-fail result, because raw values help me detect drift in components, test fixtures, or assembly methods. A product that passes near the limit may still indicate a process trend that deserves investigation.
I calculate first-pass yield for each critical test station as:
$$FPY_i=\frac{N_{pass,i}}{N_{total,i}}$$
and the rolled throughput yield for the full electric vehicle charging assembly line as:
$$RTY=\prod_{i=1}^{n}FPY_i$$
If five critical test stations each have a first-pass yield of 97%, the rolled throughput yield is approximately \(0.97^5=0.859\), or 85.9%. This means that even if each station appears strong, the cumulative probability of passing all stages without rework is much lower. I use this result to justify investing in early detection and root-cause correction rather than accepting repeated retesting.
I also monitor test-equipment capability using a simple repeatability ratio:
$$\%GRR=\frac{GRR}{TV}\times 100\%$$
where \(GRR\) reflects measurement variation and \(TV\) reflects total variation. If a test bench has high repeatability variation, operators may see inconsistent pass-fail results and may be tempted to retest until a product passes. In electric vehicle charging production, this is a dangerous practice because it hides real defects. I prefer to qualify test benches, lock calibration status, and record retest reasons so that repeated tests are visible in the quality data.
| Test stage | Purpose | Example acceptance logic | My data use |
|---|---|---|---|
| Grounding continuity | Confirm protective bonding path | \(R_{gnd} \le R_{gnd,max}\) | Trend by cabinet family and grounding-point design |
| Insulation resistance | Confirm isolation between live parts and accessible parts | \(R_{ins} \ge R_{limit}\) | Detect contamination, cable damage, and assembly stress |
| Dielectric strength | Verify withstand capability | No breakdown during specified test | Link failures to component batch and wiring route |
| Communication test | Confirm module-to-controller communication | Stable message exchange and correct address | Identify harness route, firmware, or connector issues |
| Charging simulation | Verify start-stop, metering, and protection behavior | Expected sequence completed without fault | Compare cycle signature across products |
| Aging | Expose early-life instability | No abnormal temperature, alarm, or communication loss | Use trend data to improve thermal and electrical design |
I treat test data as production intelligence, not as an archive. If a batch of electric vehicle charging units shows a rising trend in communication retries, I want to know whether the cause is a connector batch, a harness length change, a firmware version, or a test-fixture issue. The same data can support supplier discussions, process changes, and maintenance planning. This is why I link each test result to the product identity and the exact station configuration.
Process Flow Optimization for Electric Vehicle Charging
I begin process optimization by breaking the electric vehicle charging assembly into work elements and measuring them with a consistent method. I do not rely on rough estimates from memory. A work element should be small enough to observe clearly but not so small that measurement overhead becomes excessive. After observation, I classify each element as value-adding, necessary non-value-adding, waiting, or rework. This classification helps me decide whether to eliminate, combine, rearrange, or simplify the task.
I use a standard-time model for each workstation:
$$ST_i=NT_i \times \left(1+PF_i\right)+AT_i$$
where \(ST_i\) is the standard time, \(NT_i\) is normal time, \(PF_i\) is the allowance factor for fatigue, personal needs, and unavoidable delay, and \(AT_i\) is the allowance for tool changes or material handling. This formula is useful in electric vehicle charging assembly because different stations have different physical demands. A heavy cabinet positioning station may require a larger allowance than a light display-module installation station. Using a single allowance for the whole line would distort the balance.
I compare observed time with target takt using a bottleneck index:
$$BI_i=\frac{CT_i}{TT}$$
If \(BI_i>1\), the station is above takt and requires attention. If \(BI_i\) is close to 1, the station has little buffer and should be protected from variability. If \(BI_i\) is much lower than 1, I examine whether the station can absorb additional work or whether it is constrained by tooling, space, or safety requirements. I do not move work to a station simply because it has idle time; I also consider skill requirements and physical layout.
| Workstation | Typical work content | My target time reference | Possible improvement |
|---|---|---|---|
| Cabinet preassembly | Base, plate, door, seal, protective parts | Approximately 8 minutes | Fixture improvement, sequenced kit, parallel preparation |
| Component installation | Breakers, contactors, power modules, control boards | Approximately 15 minutes | Scan confirmation, modular component tray, smart torque tool |
| Harness connection | Main, control, communication, grounding, labeling | Approximately 25 minutes | Prebuilt harness, color code, continuity lock, route aid |
| Parameter writing | Firmware, configuration, address, calibration | Approximately 5 minutes | Automatic script, version validation, barcode binding |
| Testing and commissioning | Safety, communication, metering, charging simulation | Approximately 20 minutes | Test-sequence lock, parallel test benches, fault-code analysis |
| Aging and final release | Aging monitoring, final inspection, packing | Varies by product family | Scheduling by order, digital checklist, defect-code review |
I use a line-balance improvement formula to estimate the effect of reallocating work:
$$\Delta E=\frac{\sum t_i}{n \cdot CT_{max,new}}-\frac{\sum t_i}{n \cdot CT_{max,old}}$$
A positive \(\Delta E\) indicates improved balance efficiency after the change. However, I do not accept a change only because the formula improves. I also check whether the new work combination increases fatigue, reduces inspection quality, or creates new material-handling losses. In electric vehicle charging assembly, a small numerical gain may be outweighed by a higher risk of terminal errors if an operator is asked to switch between too many connector types.
I also apply a simple queuing indicator to detect excessive work-in-process:
$$WIP_i=\lambda_i \cdot CT_i$$
where \(\lambda_i\) is the arrival rate at station \(i\). If the calculated work-in-process exceeds the physical buffer capacity, the line will either block or create informal stacking. I prefer to size buffers deliberately and use visual signals when buffers reach a threshold. Uncontrolled cabinets and half-finished electric vehicle charging units on the floor increase handling damage and make traceability weaker.
Modular Assembly in Electric Vehicle Charging
I see modular assembly as one of the most effective ways to improve electric vehicle charging efficiency without simply pushing operators to work faster. The principle is to move complex, repeatable, and testable work into a preassembly area where the environment is stable and the operator can focus on a limited set of tasks. The main line then receives a verified module and performs a shorter integration task. This reduces task switching, tool changes, and congestion at the total-assembly station.
I model the effect of modular preassembly as:
$$CT_{main}=CT_{integrate}+CT_{verify}+CT_{adjust}$$
If preassembly reduces \(CT_{integrate}\) and \(CT_{verify}\) by more than the added logistics and module-handling time, the overall line benefits. I also check the quality effect. A module that is tested before installation can be corrected in a dedicated area with better access and specialized tools. This is often easier than repairing the same module after it is buried inside an electric vehicle charging cabinet.
I use a modularity benefit index:
$$MBI=\frac{\Delta CT_{main}+\Delta R_{rework}+\Delta Q_{loss}}{C_{module}+C_{logistics}}$$
where \(\Delta CT_{main}\) is main-line cycle-time reduction, \(\Delta R_{rework}\) is rework-time reduction, \(\Delta Q_{loss}\) is quality-loss reduction, \(C_{module}\) is the cost of modularization, and \(C_{logistics}\) is the added logistics cost. A value greater than 1 suggests that the modular approach is economically attractive under the assumed operating conditions. I use this as a screening tool, not as a final financial decision, because some benefits such as traceability and operator safety are difficult to monetize directly.
| Module type | Preassembly content | Main-line content after modularization | My expected benefit |
|---|---|---|---|
| Harness module | Cutting, stripping, crimping, labeling, continuity test, bundling | Route, connect, scan, final continuity confirmation | Shorter main-line wiring time, fewer terminal errors |
| Power module | Heat-sink preparation, thermal pad placement, fastener preassembly, basic check | Position, fasten, connect, torque verification | Better thermal control and less congested main-line work |
| Control module | Board mounting, firmware check, connector inspection | Install, connect, address confirmation | Higher first-pass yield and easier fault isolation |
| Display module | Panel assembly, cable preparation, functional check | Install, connect, appearance check | Reduced cosmetic damage and faster final testing |
| Metering module | Terminal preparation, calibration check, label confirmation | Install, connect, parameter verification | Improved metering consistency and traceability |
| Thermal module | Fan, duct, heat sink, fastener and clearance check | Integrate into cabinet and confirm airflow path | Fewer thermal defects and less rework after aging |
I insist on interface standardization before scaling modular assembly. If each electric vehicle charging model uses different mounting holes, terminal numbers, harness lengths, and connector directions, the modular benefit is limited by changeover and confusion. I prefer to establish a small number of standard module packages and bind each package to a module code, inspection record, and applicable product family. This makes multi-model production more manageable and allows the main line to focus on integration rather than on reinterpreting unique wiring instructions.
I also consider the physical logistics of modules. A preassembled module should arrive at the main line in a container that protects it from damage and presents it in the correct orientation. If the operator must unpack, rotate, and inspect the module before use, the time saved by preassembly may be lost. I therefore treat module packaging and presentation as part of the process design, not as a secondary concern.
Smart Equipment Application in Electric Vehicle Charging
I evaluate smart equipment by three criteria: whether it reduces human error, whether it shortens auxiliary time, and whether it leaves useful process data. Equipment that only looks advanced but does not improve one of these criteria is not a priority in my plan. In electric vehicle charging assembly, the most valuable applications are often not fully automated robots but targeted smart tools that make critical actions verifiable.
For fastening, I use a torque and angle monitoring model:
$$T_{record}=f(T_{target}, \theta_{measured}, t_{fasten})$$
where \(T_{record}\) is the recorded fastening signature, \(T_{target}\) is the target torque, \(\theta_{measured}\) is the measured rotation angle, and \(t_{fasten}\) is the fastening duration. This signature helps distinguish a normal joint from a cross-thread, stripped thread, or missing component. A torque value alone may not reveal a joint that reached torque without proper engagement. I link the signature to the product identity and workstation so that later analysis can compare joints by component batch and operator method.
For wire processing, I use a capability check:
$$C_{pk}=\min\left(\frac{USL-\mu}{3\sigma},\frac{\mu-LSL}{3\sigma}\right)$$
where \(USL\) and \(LSL\) are the upper and lower specification limits for crimp height, pull force, or cut length, \(\mu\) is the process mean, and \(\sigma\) is the standard deviation. A high \(C_{pk}\) indicates that the wire-processing equipment is consistently producing within specification. I prefer to monitor this indicator for critical harness parameters because a small drift in crimp height can create intermittent electrical failures that are difficult to find at final test.
| Equipment | Electric vehicle charging application | Main benefit | Data captured |
|---|---|---|---|
| Smart torque tool | Power module, grounding bar, terminal block, cabinet fasteners | Prevents missed or excessive tightening | Torque, angle, time, station, product ID |
| Automatic wire cutter and crimper | Harness preparation for main, control, and communication circuits | Reduces cut-length and crimp variation | Length, crimp height, batch, equipment status |
| Barcode or RFID scanner | Component verification, product travel, material binding | Reduces wrong-part installation | Scan time, material code, product ID, operator ID |
| Automated guided vehicle | Cabinet and module delivery to stations | Reduces manual handling and material search | Route, delivery time, payload, station call |
| Online safety tester | Grounding, insulation, and dielectric strength testing | Enforces test sequence and automatic lock | Raw value, limit, test duration, pass-fail |
| Functional test bench | Communication, metering, display, charging simulation | Shortens commissioning and improves fault isolation | Test script version, fault code, retest count |
I also use equipment-status indicators to plan maintenance. For a critical test bench, I calculate mean time between failures and mean time to repair:
$$MTBF=\frac{T_{operating}}{N_{failures}}$$
$$MTTR=\frac{T_{downtime}}{N_{repairs}}$$
These values help me decide whether to keep a backup test bench, train a maintenance technician, or redesign a fixture that causes repeated stoppages. In electric vehicle charging production, a test bench failure can block the entire line because all products must pass through safety and functional verification. I therefore treat test-equipment reliability as part of line capacity, not as a support function outside production.
Data and Quality Closed Loop in Electric Vehicle Charging
I design the data architecture around one product identity. Each electric vehicle charging unit should receive a unique code at the start of assembly and retain that code through structural build, electrical build, testing, aging, final release, and packing. The code should bind order information, material batches, workstation records, equipment parameters, test results, repair history, and final documents. Without this binding, quality analysis becomes a search across paper forms, local test files, and informal logs.
I use a traceability completeness condition:
$$TC=\frac{N_{recorded}}{N_{required}} \times 100\%$$
A product should not be released if \(TC\) is below the required threshold. I prefer this rule to be enforced by the system rather than by a supervisor’s judgment. If a torque record is missing, a safety test is not uploaded, or a component batch is not scanned, the system should block release. This is especially important in electric vehicle charging assembly because a missing record may only become relevant months later when a field issue appears.
I use a quality-loss index to prioritize improvement actions:
$$QLI=w_1D+w_2R+w_3T$$
where \(D\) is defect frequency, \(R\) is rework cost, and \(T\) is the time lost due to the defect, while \(w_1\), \(w_2\), and \(w_3\) are weights chosen by management. This index helps me compare defect types that are not directly comparable. For example, a cosmetic label defect may occur frequently but require little rework, while an insulation failure may occur less often but cause long testing delays and safety risk. The weighted index gives a more balanced view.
| Data field | Source | Why I capture it in electric vehicle charging | Use in closed-loop quality |
|---|---|---|---|
| Product unique code | Label printer or RFID station | Links all records to one unit | Full traceability and field issue investigation |
| Material batch | Component scan | Identifies supplier and production batch | Batch containment and supplier feedback |
| Fastening record | Smart torque tool | Confirms critical joint integrity | Trend analysis and rework verification |
| Harness record | Wire-processing equipment and continuity test | Confirms crimp and routing quality | Detection of terminal and routing defects |
| Safety test record | Grounding, insulation, and dielectric testers | Confirms electrical safety | Mandatory release gate and failure analysis |
| Functional test record | Automated test bench | Confirms charging behavior and communication | Fault-code clustering and retest monitoring |
| Repair record | Repair station | Shows what was corrected and why | Root-cause analysis and process improvement |
| Final release record | Final inspection and packing | Confirms completeness before shipment | Release authorization and document control |
I use a simple defect-closure condition:
$$CAPA_{closed}=Action_{verified} \times Effectiveness_{confirmed}$$
This means that a corrective action is not closed merely because it has been implemented. It is closed only when the action has been verified and its effectiveness has been confirmed through data. In electric vehicle charging assembly, this could mean checking that a new harness guide reduces continuity failures over a defined production period, or that a new torque sequence reduces rework at the power-module station. I prefer to define the verification window and metric before the action is launched so that closure is based on evidence rather than opinion.
I also use a daily quality review structure based on the top defect categories. For each category, I want to know the frequency, the affected electric vehicle charging product family, the station where the defect was detected, the station where it likely originated, the material batch, and the containment action. This structure prevents the review from becoming a general discussion. It also helps me decide whether the next improvement should target design, supplier quality, workstation method, tooling, or training.
Efficiency Evaluation and Performance Measurement
I evaluate electric vehicle charging assembly efficiency with a balanced set of indicators rather than a single output number. High output achieved through excessive rework or skipped verification is not acceptable. I therefore combine productivity, quality, and stability metrics. The indicators I use most often are takt compliance, first-pass yield, rolled throughput yield, OEE, rework rate, changeover time, and traceability completeness.
I calculate takt compliance as:
$$TC_{comp}=\frac{N_{on\_takt}}{N_{total}} \times 100\%$$
and rework rate as:
$$RR=\frac{N_{rework}}{N_{total}} \times 100\%$$
I also use a line-loss breakdown model:
$$L_{total}=L_{wait}+L_{material}+L_{equipment}+L_{quality}+L_{changeover}+L_{other}$$
This model helps me avoid vague statements such as “the line is inefficient.” Instead, I can identify whether the loss is caused by waiting, material shortage, equipment stoppage, quality retries, changeover, or another factor. In electric vehicle charging assembly, changeover loss is often underestimated when multiple models share a line. A changeover may involve different harness kits, mounting plates, test scripts, label templates, and torque programs. If these are not prepared in advance, the line may appear to be running while actually waiting for configuration.
| Indicator | Formula or definition | My interpretation in electric vehicle charging | Typical corrective direction |
|---|---|---|---|
| Takt compliance | \(TC_{comp}=N_{on\_takt}/N_{total}\) | Shows whether stations meet demand rhythm | Balance work, reduce waiting, improve material presentation |
| First-pass yield | \(FPY=N_{pass}/N_{total}\) | Shows quality at a specific test station | Error-proofing, fixture improvement, training |
| Rolled throughput yield | \(RTY=\prod FPY_i\) | Shows cumulative probability of defect-free flow | Focus on early detection and root-cause removal |
| OEE | \(OEE=A \times P \times Q\) | Shows combined equipment effectiveness | Maintenance, speed loss reduction, quality improvement |
| Rework rate | \(RR=N_{rework}/N_{total}\) | Shows hidden capacity consumption | Standard work, component verification, test lock |
| Changeover time | Measured from last good unit to next good unit | Shows flexibility for multi-model electric vehicle charging | External preparation, standard kits, digital work instructions |
| Traceability completeness | \(TC=N_{recorded}/N_{required}\) | Shows whether quality records are release-ready | System enforcement and scan discipline |
I also use a capacity-planning relationship that combines availability and quality:
$$C_{effective}=C_{theoretical} \times A \times Q$$
This formula reminds me that a line rated for a certain hourly capacity will not deliver that capacity if equipment availability or quality is low. In electric vehicle charging assembly, a test bench with frequent retests may reduce effective capacity even if its nominal test time is short. The same applies to a wiring station with high first-pass yield loss; the rework consumes capacity that was originally planned for new production.
Implementation Roadmap for Electric Vehicle Charging Assembly
I prefer a phased implementation because electric vehicle charging assembly improvement involves process, equipment, data, and people. A single large change can disrupt production and make it difficult to isolate the effect of each improvement. My roadmap starts with measurement and stabilization, then moves to modularization and smart tools, then to data integration and closed-loop quality, and finally to continuous optimization.
| Phase | Main actions | My expected output | Verification method |
|---|---|---|---|
| Phase 1: Baseline and stabilization | Measure work elements, identify bottlenecks, standardize critical torque and routing rules, improve material presentation | Stable cycle times and clearer standard work | Time study, first-pass yield, defect Pareto |
| Phase 2: Modular preassembly | Create harness, power, control, display, metering, and thermal module packages; define interfaces | Shorter main-line cycle and fewer wiring errors | Before-and-after cycle time, rework rate, module test yield |
| Phase 3: Smart tools and equipment | Deploy smart torque tools, wire-processing equipment, scanners, test-sequence locks, and AGV delivery | Lower human error and better process records | OEE, torque exception rate, scan error rate, test retest rate |
| Phase 4: Data integration | Bind product code to material, process, equipment, and test data; enforce release gates | Complete traceability and faster root-cause analysis | Traceability completeness, fault-code closure time |
| Phase 5: Continuous improvement | Use quality and efficiency data for weekly review, supplier feedback, and workstation redesign | Sustained improvement in electric vehicle charging assembly | RTY trend, OEE trend, cost per unit, changeover time |
I use a prioritization score to decide which improvement to launch first:
$$PS=Impact \times Feasibility \times Urgency$$
This simple multiplicative model prevents me from selecting a high-impact but impractical project while ignoring a moderate-impact but highly feasible improvement. In electric vehicle charging assembly, a low-cost harness guide or scan interlock may be more valuable in the short term than a large automated cabinet-handling system, especially if the main defect source is terminal error rather than heavy lifting.
Risk Control and Governance in Electric Vehicle Charging Production
I recognize that electric vehicle charging assembly carries safety, quality, and operational risks that must be governed explicitly. Safety risk includes electrical shock during testing, accidental energization, and improper grounding. Quality risk includes wrong component installation, loose terminals, damaged insulation, and incomplete test records. Operational risk includes equipment failure, material shortage, changeover error, and data loss. I prefer to treat these risks through engineering controls, process locks, and verification routines rather than through reminders alone.
I use a risk-priority number as a screening tool:
$$RPN=S \times O \times D$$
where \(S\) is severity, \(O\) is occurrence, and \(D\) is detection difficulty. A high RPN indicates that the failure mode deserves attention. For electric vehicle charging, a loose grounding connection may have high severity, moderate occurrence, and moderate detection difficulty, leading to a high priority. I then ask whether the risk can be eliminated by design, reduced by process control, or detected by an additional test. My preference is to eliminate or reduce the risk before adding inspection.
| Risk area | Example failure mode | My control approach | Verification |
|---|---|---|---|
| Electrical safety | Incomplete grounding or insulation damage | Dedicated grounding point, torque record, automatic safety test lock | Raw resistance value and pass-fail record |
| Component installation | Wrong breaker rating or reversed module | Scan confirmation, keyed connector, visual aid | Station scan log and first-piece check |
| Harness routing | Power and signal wires crossed or pinched | Prebuilt harness, route guide, separation rule | Continuity test and visual confirmation |
| Test integrity | Retesting until pass without recording cause | Retest reason code and system lock | Retest count and fault-code review |
| Data integrity | Missing material batch or test result | Mandatory scan and release gate | Traceability completeness check |
| Changeover | Wrong program or label template for a model | Digital work instruction and program selection by product code | First-piece confirmation and scan validation |
I also use a simple audit sampling rule for process discipline:
$$n_{audit}=\left\lceil \frac{N_{batch}}{k} \right\rceil$$
where \(N_{batch}\) is the batch size and \(k\) is the sampling interval. This is not a substitute for full traceability, but it helps me verify that the process is being followed. I prefer audits that check objective evidence, such as torque records, scan logs, and test uploads, rather than only observing whether the operator appears busy. In electric vehicle charging assembly, a process that looks orderly can still hide missing scans or skipped verification if the data system is not checked.
My Practical Observations on Electric Vehicle Charging Assembly
I have found that the most common efficiency losses in electric vehicle charging assembly are not dramatic equipment breakdowns but small, repeated interruptions: searching for a harness kit, waiting for a test bench, rechecking a component model, reopening a cabinet after a late defect, or retesting a unit without recording the reason. These losses are difficult to see from a distance because the line may appear active. They become visible when work elements are measured, when data are linked to product identity, and when defect categories are reviewed consistently.
I have also found that modular assembly works best when the module interface is stable. If the module is not standardized, the main line may receive a preassembled unit that still requires adaptation. This can create a false sense of improvement. I therefore prioritize interface standardization before expanding module variety. For electric vehicle charging, the most valuable standard modules are often the harness package, power module interface, control module, and display module, because these areas combine high error risk with high test value.
I do not treat automation as a goal in itself. A smart torque tool that records every critical fastening is often more valuable than a robot that performs a non-critical movement. An automatic test-sequence lock that prevents a product from bypassing a safety test is often more valuable than a faster conveyor. The question I ask is whether the equipment reduces a specific loss or closes a specific quality gap. If the answer is unclear, I delay the investment and first improve the process definition.
I also emphasize the human side of electric vehicle charging assembly. Operators need clear instructions, consistent material presentation, and immediate feedback when an error occurs. If the system alarms for every minor deviation, operators may begin to ignore alarms. I therefore set alarm thresholds carefully and distinguish between a stop-the-line condition, a correct-and-continue condition, and a record-only condition. This hierarchy keeps attention on the most important risks.
My Conclusions on Electric Vehicle Charging Assembly Optimization
My conclusion is that electric vehicle charging assembly optimization should be built on four connected foundations: a stable structural and electrical process, modular preassembly, targeted smart equipment, and a data-driven quality closed loop. The structural process provides the geometric and mechanical basis for reliable electric vehicle charging operation. The electrical process determines safety, communication stability, and maintainability. Modular preassembly shortens the main line and moves complex work into a more controlled environment. Smart equipment reduces human error and creates objective records. The quality closed loop turns those records into corrective action and prevents repeated defects.
I believe that efficiency improvement in electric vehicle charging should be measured through a balanced set of indicators. Output alone is insufficient. I want to see takt compliance, first-pass yield, rolled throughput yield, OEE, rework rate, and traceability completeness move in the right direction together. A line that produces more units but hides rework or skips test records is not a sustainable improvement. A line that produces slightly fewer units but achieves stable first-pass yield and complete traceability may be far more valuable over time.
I also conclude that the sequence of improvement matters. Before adding automation, I prefer to stabilize work elements and standardize interfaces. Before expanding data collection, I prefer to define which decisions the data will support. Before modularizing every component, I prefer to start with modules that have high error risk and high test value. This disciplined sequence prevents the line from becoming a collection of disconnected smart devices that do not improve the overall electric vehicle charging assembly flow.
Finally, I see continuous improvement as a normal operating condition rather than a one-time project. Electric vehicle charging products will continue to change in power level, communication capability, thermal design, and user interface. The assembly line must therefore be able to absorb change without losing traceability or quality discipline. My recommended path is to keep the process modular, the data linked, the equipment purposeful, and the quality feedback fast. With this approach, an electric vehicle charging intelligent production line can improve assembly efficiency while maintaining the consistency and safety that electric vehicle charging products require.