
As the global transportation sector shifts toward electrification, the safety of the electric vehicle battery pack has become a central concern. I have focused my research on the passive control of thermal runaway propagation in lithium-ion batteries for vehicles. In an electric vehicle battery pack, a single cell failure caused by mechanical abuse, electrical abuse, or thermal abuse can trigger a chain reaction that rapidly spreads to neighboring cells. This cascading thermal runaway can lead to fire, explosion, and complete destruction of the electric vehicle battery pack. My work combines experiments and numerical simulations to investigate the thermal runaway behavior of 18650 lithium-ion cells and to develop effective passive insulation structures that prevent propagation.
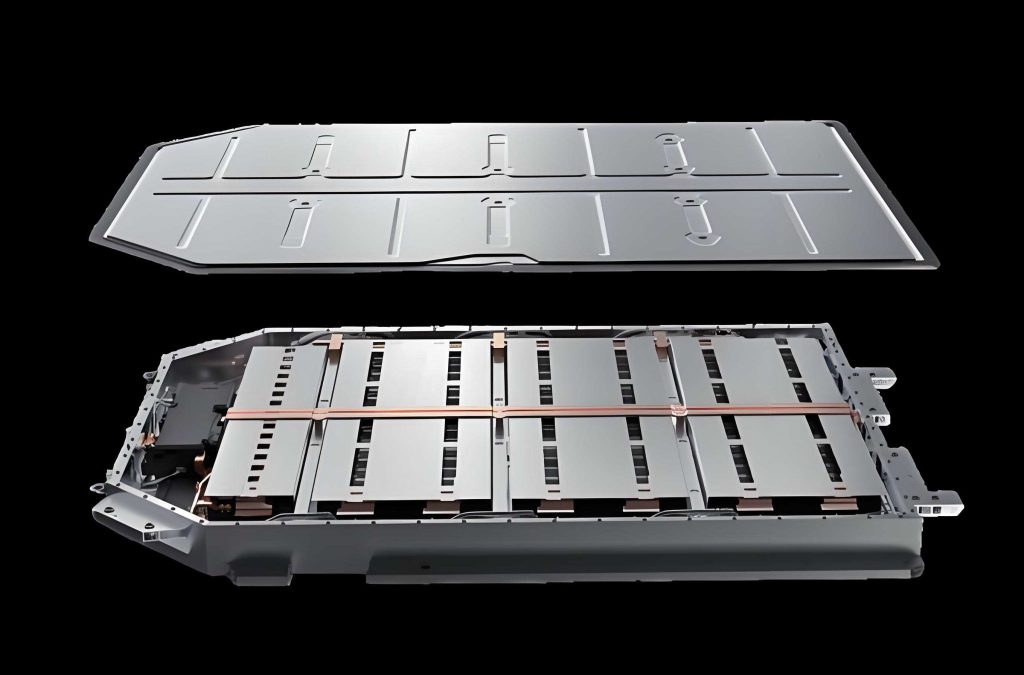
Lithium-ion batteries offer high energy density, long cycle life, and low self-discharge, which makes them ideal for electric vehicle battery packs. However, the same high energy density that provides driving range also introduces severe safety risks. When a cell undergoes thermal runaway, the released heat can raise the temperature of adjacent cells above their critical thresholds. The propagation of thermal runaway inside an electric vehicle battery pack is difficult to suppress without dedicated control measures. Therefore, I designed a series of experiments and simulations to study passive control methods based on ceramic fiber silica aerogel composites and optimized three-layer insulation structures.
Thermal Runaway Theory and Governing Equations
Thermal runaway in lithium-ion cells involves a sequence of exothermic reactions. The process begins with the decomposition of the solid electrolyte interphase (SEI) layer, followed by reactions between the negative electrode and the electrolyte, melting of the separator, decomposition of the positive electrode, and decomposition of the electrolyte. These reactions release heat and flammable gases. The overall heat generation rate can be expressed as the sum of contributions from each reaction:
$$\dot{Q}_{\text{chem}} = \dot{Q}_{\text{SEI}} + \dot{Q}_{\text{anode}} + \dot{Q}_{\text{cathode}} + \dot{Q}_{\text{ele}}$$
Each reaction rate follows an Arrhenius-type expression. For example, the SEI decomposition rate is:
$$\frac{d\chi_{\text{SEI}}}{dt} = -A_{\text{SEI}} \chi_{\text{SEI}} \exp\left(-\frac{E_{a,\text{SEI}}}{RT}\right)$$
Similarly, the anode reaction, cathode reaction, and electrolyte decomposition rates are:
$$\frac{d\chi_{\text{anode}}}{dt} = -A_{\text{anode}} \chi_{\text{anode}} \exp\left(-\frac{E_{a,\text{anode}}}{RT}\right) \exp\left(-\frac{z}{z_0}\right)$$
$$\frac{d\chi_{\text{cathode}}}{dt} = -A_{\text{cathode}} \chi_{\text{cathode}} (1-\chi_{\text{cathode}}) \exp\left(-\frac{E_{a,\text{cathode}}}{RT}\right)$$
$$\frac{d\chi_{\text{ele}}}{dt} = -A_{\text{ele}} \chi_{\text{ele}} \exp\left(-\frac{E_{a,\text{ele}}}{RT}\right)$$
The corresponding heat release rates are:
$$\dot{Q}_{\text{SEI}} = -m_{\text{SEI}} H_{\text{SEI}} \frac{d\chi_{\text{SEI}}}{dt}$$
$$\dot{Q}_{\text{anode}} = -m_{\text{anode}} H_{\text{anode}} \frac{d\chi_{\text{anode}}}{dt}$$
$$\dot{Q}_{\text{cathode}} = -m_{\text{cathode}} H_{\text{cathode}} \frac{d\chi_{\text{cathode}}}{dt}$$
$$\dot{Q}_{\text{ele}} = -m_{\text{ele}} H_{\text{ele}} \frac{d\chi_{\text{ele}}}{dt}$$
Heat transfer in the electric vehicle battery pack occurs through conduction, convection, and radiation. Fourier’s law describes conduction:
$$\Phi = -\lambda A \frac{dt}{dx}$$
Newton’s law of cooling describes convection:
$$\Phi = hA\Delta t$$
The Stefan-Boltzmann law describes radiation:
$$\Phi = \varepsilon A \sigma T^4$$
For the computational fluid dynamics simulations, I solved the mass, momentum, and energy conservation equations. The mass conservation equation is:
$$\frac{\partial \rho}{\partial t} + \frac{\partial (\rho u)}{\partial x} + \frac{\partial (\rho v)}{\partial y} + \frac{\partial (\rho w)}{\partial z} = 0$$
The momentum conservation equations in three directions are:
$$\frac{\partial (\rho u)}{\partial t} + \text{div}(\rho u \vec{u}) = -\frac{\partial p}{\partial x} + \frac{\partial \tau_{xx}}{\partial x} + \frac{\partial \tau_{yx}}{\partial y} + \frac{\partial \tau_{zx}}{\partial z} + F_x$$
$$\frac{\partial (\rho v)}{\partial t} + \text{div}(\rho v \vec{u}) = -\frac{\partial p}{\partial y} + \frac{\partial \tau_{xy}}{\partial x} + \frac{\partial \tau_{yy}}{\partial y} + \frac{\partial \tau_{zy}}{\partial z} + F_y$$
$$\frac{\partial (\rho w)}{\partial t} + \text{div}(\rho w \vec{u}) = -\frac{\partial p}{\partial z} + \frac{\partial \tau_{xz}}{\partial x} + \frac{\partial \tau_{yz}}{\partial y} + \frac{\partial \tau_{zz}}{\partial z} + F_z$$
The energy conservation equation is:
$$\frac{\partial (\rho T)}{\partial t} + \text{div}(\rho \vec{u} T) = \text{div}\left(\frac{\lambda}{C_p} \text{grad}(T)\right) + S_T$$
I used the Realizable \(k-\varepsilon\) turbulence model, which provides good accuracy for buoyancy-driven flows. The transport equations for turbulent kinetic energy \(k\) and dissipation rate \(\varepsilon\) are:
$$\frac{\partial (\rho k)}{\partial t} + \frac{\partial (\rho k u_i)}{\partial x_i} = \frac{\partial}{\partial x_j}\left[\left(\mu + \frac{\mu_t}{\sigma_k}\right)\frac{\partial k}{\partial x_j}\right] + G_k – \rho \varepsilon$$
$$\frac{\partial (\rho \varepsilon)}{\partial t} + \frac{\partial (\rho \varepsilon u_i)}{\partial x_i} = \frac{\partial}{\partial x_j}\left[\left(\mu + \frac{\mu_t}{\sigma_\varepsilon}\right)\frac{\partial \varepsilon}{\partial x_j}\right] + \rho C_1 E \varepsilon – \rho C_2 \frac{\varepsilon^2}{k + \sqrt{\nu \varepsilon}}$$
Experimental Setup and Cell Specifications
I selected commercial 18650 lithium-ion cells with a nickel-cobalt-aluminum (NCA) cathode. The nominal capacity was 3000 mAh, and the nominal voltage was 3.6 V. The cells were charged to 100% state of charge before each test. I used a battery test system for charging and discharging, a constant-temperature chamber, a high-temperature heating rod as the thermal abuse source, K-type thermocouples for temperature measurement, a data logger, a digital multimeter for voltage measurement, and an infrared thermal camera for visualization. The key cell parameters are summarized in Table 1.
| Parameter | Value |
|---|---|
| Cell type | 18650 NCA |
| Nominal capacity | 3000 mAh |
| Nominal voltage | 3.6 V |
| Charge cutoff voltage | 4.2 V |
| Discharge cutoff voltage | 2.0 V |
| Diameter × height | 18 mm × 65 mm |
| Mass | 46.6 ± 1.5 g |
For the passive insulation, I used a ceramic fiber silica aerogel composite. This material has a nanoporous structure, low thermal conductivity, and excellent flame retardancy. Its properties are listed in Table 2.
| Property | Value |
|---|---|
| Density | 300 ± 20 kg/m³ |
| Thermal conductivity at 25°C | 0.023 W/(m·K) |
| Thermal conductivity at 100°C | 0.030 W/(m·K) |
| Thermal conductivity at 300°C | 0.036 W/(m·K) |
| Thermal conductivity at 500°C | 0.072 W/(m·K) |
| Specific heat capacity | 0.774 J/(g·K) |
| Flame rating | A class, V0 |
Thermal Runaway Experiments on Single Cells
I conducted thermal abuse experiments by placing a heating rod in direct contact with the cell. The heating rod had a diameter of 16 mm and a heated length of 90 mm. Its rated power was 350 W. The cell was placed vertically, and three thermocouples were attached to the surface facing the heater at top, middle, and bottom positions. The average of these three temperatures was defined as the maximum surface temperature. The voltage was recorded simultaneously. The heating continued until thermal runaway occurred.
The thermal runaway process can be divided into four stages. Table 3 summarizes the key temperatures and events.
| Stage | Event | Temperature or time |
|---|---|---|
| I | Continuous heating and SEI decomposition | Up to internal short circuit (ISC) at 190.74°C |
| II | Internal short circuit and voltage drop | Voltage fluctuations, temperature rise |
| III | Safety valve opening and gas venting | 219.13°C, voltage drops to near 0 V |
| IV | Thermal runaway and jet combustion | 243.4°C trigger, maximum 786.41°C |
In stage I, the cell surface temperature rose steadily. The voltage remained relatively stable with small fluctuations of about 0.01 V. In stage II, the separator melted, causing internal short circuit. The voltage dropped sharply and fluctuated. In stage III, the safety valve opened, releasing high-temperature gases. The voltage dropped to nearly 0 V. In stage IV, a violent jet of burning material erupted from the positive terminal. The surface temperature reached 786.41°C within 15 s, and the maximum temperature rise rate was 167.88°C/s. The entire process from internal short circuit to thermal runaway took only 89 s. I also observed one case where the cell exploded through the side wall, demonstrating the stochastic nature of thermal runaway and the risk to adjacent cells in an electric vehicle battery pack.
Thermal Propagation Control Experiments with Single-Layer Aerogel
I then performed thermal propagation control experiments using single-layer ceramic fiber silica aerogel composites. I first tested the thinnest available thickness (1.5 mm) and the thickest (5 mm). The heating time was set to 1200 s, which is 2.4 times the time to thermal runaway in the bare cell test. If the cell did not enter thermal runaway within 1200 s, the insulation was considered successful.
For the 1.5 mm aerogel, the cell still underwent thermal runaway. The time to thermal runaway was extended by 357 s, an increase of about 72.3%. The average temperature rise rate after 200 s was kept below 0.3°C/s. The key temperatures are compared in Table 4.
| Parameter | Bare cell | 1.5 mm aerogel |
|---|---|---|
| Internal short circuit temperature | 190.74°C at 405 s | 194.2°C at 605 s |
| Safety valve opening temperature | 219.13°C at 459 s | 218.08°C at 737 s |
| Thermal runaway trigger temperature | 243.4°C at 494 s | 231.75°C at 851 s |
For the 5 mm aerogel, the cell did not undergo thermal runaway within 1200 s. The voltage remained stable with only about 0.01 V variation. The maximum surface temperature remained around 120°C. The temperature rise rate showed a trend of first increasing and then decreasing, with a maximum of 0.403°C/s. This confirmed that a single-layer aerogel can successfully control thermal propagation.
Numerical Simulation and Validation
I built a transient computational fluid dynamics model in STAR-CCM+ to simulate the thermal propagation control process. The model included the heating rod, the aerogel insulation, the lithium-ion cell, and the surrounding air. I used polyhedral mesh with boundary layers. The air was modeled as an ideal gas. The turbulence model was Realizable \(k-\varepsilon\). The cell thermal properties were anisotropic: radial conductivity 0.413 W/(m·K) and axial conductivity 1.780 W/(m·K). The surface emissivity of the cell was 0.9. The aerogel emissivity was 0.794. The heating power was 350 W. The initial temperature was 27°C.
I performed a mesh independence study. Table 5 shows the temperature at three monitoring points for different mesh sizes. The temperature change became negligible beyond 3,041,836 cells. I selected 5,586,296 cells for the final simulations.
| Mesh case | Cell count | T1 (°C) | T2 (°C) | T3 (°C) |
|---|---|---|---|---|
| 1 | 855,246 | 282.397 | 181.959 | 160.865 |
| 2 | 1,134,693 | 282.134 | 181.172 | 161.151 |
| 3 | 1,603,588 | 282.324 | 180.736 | 161.628 |
| 4 | 2,029,072 | 282.353 | 180.933 | 161.723 |
| 5 | 3,041,836 | 282.455 | 181.083 | 161.944 |
| 6 | 5,586,296 | 282.558 | 181.042 | 161.981 |
| 7 | 8,275,925 | 282.564 | 181.055 | 161.894 |
I validated the simulation against the 5 mm aerogel experiment. The maximum error was 5.6%, which confirmed the accuracy of the simulation method.
Selection of Optimal Single-Layer Insulation Thickness
Since the manufacturer provided aerogel thicknesses of 1.5, 2, 3, 4, and 5 mm, I used simulations to find the minimum thickness that ensures cell safety. I ran simulations for thicknesses from 5.0 mm down to 1.7 mm in steps of 0.3 mm. The maximum cell surface temperature after 1200 s is shown in Table 6.
| Case | Aerogel thickness (mm) | Maximum cell surface temperature (°C) |
|---|---|---|
| 1 | 5.0 | 133.60 |
| 2 | 4.7 | 135.60 |
| 3 | 4.4 | 137.90 |
| 4 | 4.1 | 140.20 |
| 5 | 3.8 | 144.00 |
| 6 | 3.5 | 149.60 |
| 7 | 3.2 | 155.50 |
| 8 | 2.9 | 166.10 |
| 9 | 2.6 | 185.00 |
| 10 | 2.3 | 204.90 |
| 11 | 2.0 | 225.68 |
| 12 | 1.7 | 247.80 |
I fitted a cubic polynomial to the data:
$$y = -2.445x^3 + 38.87x^2 – 206.4x + 500.8$$
The coefficient of determination \(R^2\) was 0.9975. Using the safety criterion that the cell surface temperature should remain below 142.1°C (100 s before internal short circuit in the bare cell test), I selected 4 mm as the optimal single-layer thickness. A dedicated experiment with 4 mm aerogel confirmed that the cell remained safe, with a maximum surface temperature of 137.82°C in simulation and 142.1°C in experiment.
Thermal and Flow Field Analysis for the Optimal Single-Layer Structure
I analyzed the temperature field, heat flux, and flow field for the 4 mm aerogel case. The cell surface temperature was highly non-uniform due to the low radial thermal conductivity. The maximum surface temperature difference exceeded 70°C. The heat flux was concentrated in the central region facing the heater. The air flow was driven by natural convection. The maximum air velocity in the entire domain was 0.64 m/s. Near the cell, the air velocity was much lower than near the heater. At 200 s, the maximum air velocity near the cell was about 0.14 m/s, which is about 35% of that near the heater. This reduced convective heat transfer to the cell.
I also applied the 4 mm single-layer insulation to a 3×3 cell module representing a simplified electric vehicle battery pack. I tested three heating rod positions: center, diagonal corner, and side. The maximum cell surface temperatures are summarized in Table 7.
| Heating position | Cell index | Maximum surface temperature (°C) |
|---|---|---|
| Center | Cell 1 | 60.18 |
| Center | Cell 2 | 133.55 |
| Diagonal corner | Cell 1 | 28.30 |
| Diagonal corner | Cell 4 | 30.65 |
| Diagonal corner | Cell 5 | 59.98 |
| Diagonal corner | Cell 7 | 35.17 |
| Diagonal corner | Cell 8 | 133.73 |
| Side | Cell 1 | 134.31 |
| Side | Cell 3 | 60.08 |
| Side | Cell 4 | 132.65 |
| Side | Cell 6 | 30.69 |
| Side | Cell 7 | 34.69 |
In all cases, the maximum cell surface temperature remained below 134.31°C, and the farthest cells remained near 30°C. This demonstrates that the 4 mm single-layer aerogel can effectively control thermal propagation in an electric vehicle battery pack.
Optimized Three-Layer Insulation Structure
To further improve the thermal barrier performance without significantly increasing the total thickness, I proposed a three-layer structure consisting of a 4 mm aerogel core sandwiched between two thin metal sheets. I first studied the effect of copper sheet thickness. Table 8 shows the backside temperature of the insulation after 1200 s heating.
| Copper thickness (mm) | Average temperature at 1100–1200 s (°C) | Maximum temperature (°C) | Time to reach steady state (s) |
|---|---|---|---|
| 0.1 | 159.8 | 161.2 | 720 |
| 0.2 | 149.6 | 151.4 | 660 |
| 0.3 | 150.1 | 151.9 | 670 |
| 0.4 | 150.3 | 152.0 | 675 |
| 0 (bare aerogel) | 309.1 | 312.5 | 450 |
The 0.2 mm copper sheet provided the best balance between thermal performance and weight. I then compared different metals: copper, tungsten, iron, and Inconel 718. The results for backside temperature and cell thermal propagation control are shown in Table 9 and Table 10.
| Metal | Average temperature at 1100–1200 s (°C) | Maximum temperature (°C) | Time to steady state (s) |
|---|---|---|---|
| Copper | 151.41 | 152.07 | 660 |
| Tungsten | 151.64 | 152.88 | 881 |
| Iron | 162.56 | 163.56 | 707 |
| Inconel 718 | 154.35 | 157.85 | 564 |
| Metal | Maximum cell surface temperature at 1200 s (°C) |
|---|---|
| Copper | 91.59 |
| Tungsten | 98.30 |
| Iron | 101.24 |
| Inconel 718 | 100.53 |
The three-layer structure with 0.2 mm copper sheets reduced the maximum cell surface temperature by 39.18°C compared with the single-layer aerogel, a decrease of about 29.96%. The voltage response also improved, with only a slight increase instead of a drop.
Mechanism of the Three-Layer Insulation
The ceramic fiber silica aerogel composite contains numerous pores, fibers, and silica particles. Its solid conduction is extremely low due to the nanoscale pore size, which is comparable to the phonon mean free path. The pores also suppress gaseous convection. At high temperatures, radiation becomes more significant. The metal layers, especially copper, have a low surface emissivity (about 0.03 when clean and unoxidized). According to Kirchhoff’s law, low emissivity means low absorptivity for thermal radiation. Therefore, a large fraction of the incident radiation from the heating rod is reflected back. The aerogel core then receives much less heat. The metal layers also reduce the air flow between the heater and the cell, decreasing convective heat transfer. Table 11 summarizes the thermal protection mechanisms.
| Mechanism | Effect |
|---|---|
| Low solid conduction in aerogel | Reduces heat transfer through the core |
| Nanoporous structure | Suppresses gaseous convection |
| Metal layer low emissivity | Reflects thermal radiation |
| Metal layer barrier | Reduces air flow and convective heat transfer |
Conclusions
I have investigated passive control methods for thermal runaway propagation in lithium-ion batteries for electric vehicle battery packs. The main findings are as follows. A bare 18650 NCA cell under thermal abuse undergoes four stages: continuous heating, internal short circuit, safety valve opening, and thermal runaway. The maximum surface temperature reached 786.41°C, and the maximum temperature rise rate was 167.88°C/s. A 1.5 mm silica aerogel layer delayed thermal runaway but did not prevent it. A 5 mm layer prevented thermal runaway within 1200 s. Through simulations, I identified 4 mm as the optimal single-layer thickness, keeping the maximum cell surface temperature below 142.1°C. In a 3×3 module representing an electric vehicle battery pack, the 4 mm aerogel limited the maximum cell surface temperature to below 134.31°C, with the farthest cells remaining near 30°C. I further developed a three-layer insulation structure with a 4 mm aerogel core and two 0.2 mm copper sheets. This structure reduced the maximum cell surface temperature by 39.18°C compared with the single-layer aerogel, an improvement of about 29.96%. The mechanism combines low solid conduction, suppressed convection, and radiation reflection. These results provide a practical passive strategy for improving the safety of electric vehicle battery packs.
In future work, I plan to extend the experiments to full battery modules and real electric vehicle battery pack configurations. I will also incorporate the heat generation from SEI decomposition at lower temperatures to improve the accuracy of the thermal model. The optimized three-layer insulation structure shows promise for integration into next-generation electric vehicle battery packs without significantly increasing weight or volume.