
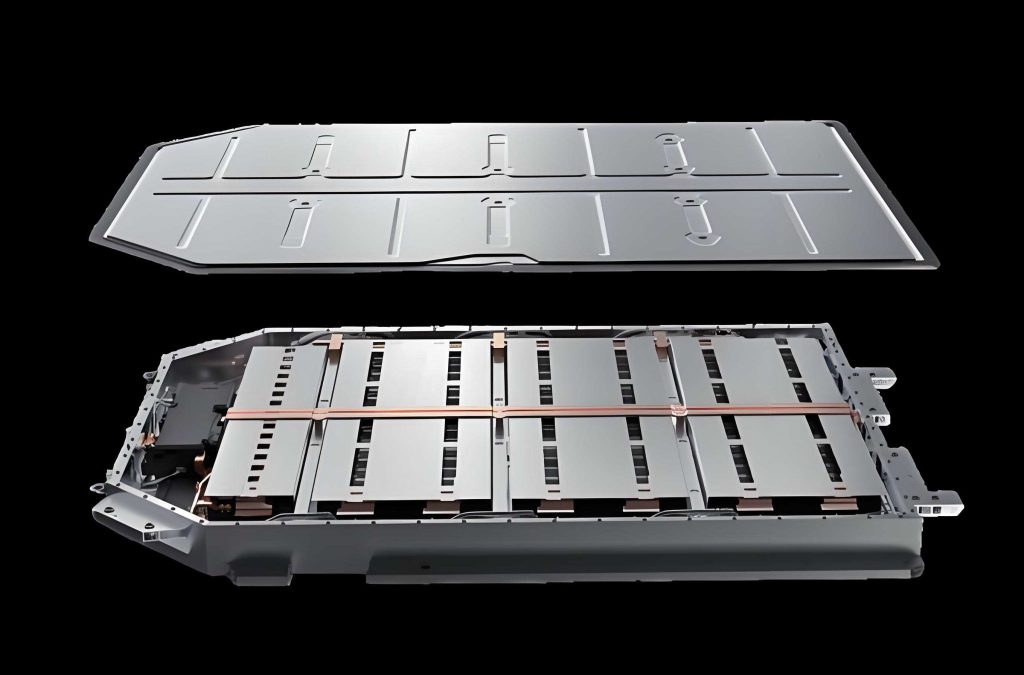
Electric vehicles (EVs) have become one of the most promising solutions to reduce greenhouse-gas emissions and petroleum dependence. Among the various storage technologies, lithium-ion batteries dominate modern EV battery packs owing to their high energy density and long cycle life. Nevertheless, performance, lifetime, and safety of an EV battery pack strongly depend on its operating temperature. When a battery pack operates outside the recommended range of 15–40°C, reversible and irreversible capacity losses are accelerated, and severe thermal runaway may even occur at elevated temperatures. Therefore, a properly designed battery thermal management system (BTMS) is essential for any EV battery pack intended to operate reliably under high discharge rates. In this dissertation, I systematically investigate the thermal behaviour of a liquid-cooled EV battery pack combined with flat heat pipes. The work starts from heat generation modelling, continues through experimental validation of a custom liquid-cooling plate, develops a series of liquid-channel topological improvements, and finishes with a multi-objective optimisation using response-surface surrogates and the NSGA-II algorithm. Finally, I integrate the optimised liquid cold plate with flat heat pipes in a battery module and analyse the influence of coolant conditions on the overall cooling performance.
1. Introduction and Motivation
The rapid growth of the EV market places increasing demands on battery durability and safety. In an EV battery pack, each cell generates heat during charge and discharge due to electrochemical reactions, ohmic resistance, polarisation, and possible side reactions. If this heat is not removed efficiently, the temperature of the pack rises, leading to non-uniform current distribution and accelerated ageing. A liquid-cooling system is regarded as one of the most effective active thermal-management methods because water or a water-glycol mixture has high specific heat and thermal conductivity compared with air. However, liquid cooling also introduces challenges such as parasitic pump power and uneven cooling between the centre and edge of the pack. Many researchers have therefore turned to hybrid BTMS architectures that combine liquid cooling with passive high-conductivity elements such as heat pipes. In such a design, heat pipes spread heat from the core cells to the liquid cold plates, which then reject the heat to the coolant. The present study addresses this need by proposing a novel liquid-cooling plate that contains a series of circular chambers and specially shaped spoiler fins. I also evaluate the influence of different fin shapes, chamber numbers, and inlet/outlet configurations. A subsequent multi-objective optimisation balances the average cold-plate temperature and pressure drop, providing an optimal set of geometric parameters for practical EV battery pack applications.
2. Lithium-Ion Battery Heat Generation and Material Properties
The cell used in this work is a square-shaped lithium iron phosphate (LiFePO₄) cell with a rated capacity of 15 Ah and a nominal voltage of 3.2 V. Its principal characteristics are summarised below.
| Property | Value |
|---|---|
| Mass | 0.35 kg |
| Density | 2136.8 kg m⁻³ |
| Specific heat capacity | 1633 J kg⁻¹ K⁻¹ |
| Rated capacity | 15 Ah |
| Nominal voltage | 3.2 V |
| Internal resistance | 4 mΩ |
| Dimensions (width × height × thickness) | 65 mm × 140 mm × 18 mm |
The total heat generated by a lithium-ion cell can be decomposed into reaction heat \(Q_r\), Joule heat \(Q_j\), polarisation heat \(Q_p\), and side-reaction heat \(Q_s\). For normal charging/discharging, the side-reaction heat is negligible. A widely used expression for the volumetric heat-generation rate is the Bernardi model, which writes
$$ Q = I\left(U_{OCV} – U\right) + I T \frac{\partial U_{OCV}}{\partial T}, $$
where \(I\) is the current, \(U_{OCV}\) is the open-circuit voltage, \(U\) is the terminal voltage, \(T\) is the cell temperature, and \(\partial U_{OCV}/\partial T\) expresses the reversible entropic heat coefficient. Combining the irreversible Joule-heat contribution with the reversible term yields
$$ Q_1 = I R_j + I R_p + I T \frac{\partial U_{OCV}}{\partial T} = I^2 R + I T \frac{\partial U_{OCV}}{\partial T}, $$
where \(R\) is the equivalent internal resistance. The energy absorbed by the cell when it heats up is equal to
$$ Q_2 = mc_p \frac{dT}{dt}. $$
Assuming an adiabatic condition during the temperature-rise test, \(Q_1 = Q_2\). From measured temperature-ramp data of the bare cell, I fitted the following relation:
$$ \frac{\partial T}{\partial t} = 7\times10^{-6} I^2 + 2\times10^{-4} I, $$
$$ \frac{dT}{dt} \approx (1.06I^2 + 0.114 I) / (m c_p). $$
After substituting the mass and specific-heat capacity, the volumetric heat-generation rate becomes
$$ q = \frac{Q}{V_b} = 24.42 I^2 + 696 I \; \text{(W m}^{-3}), $$
with \(I\) expressed in amperes. By converting the discharge current to the C-rate, the heat-generation parameters shown in the following table were used as the heat-source boundary conditions in the CFD simulations:
| Discharge C-rate | Volumetric heat generation (W m⁻³) | Surface heat flux (W m⁻²) |
|---|---|---|
| 1C | 15,935 | 287 |
| 2C | 42,858 | 771 |
| 3C | 80,769 | 1,454 |
| 4C | 129,670 | 2,334 |
| 5C | 189,560 | 3,412 |
3. Liquid-Cooled Battery Module and CFD Model
3.1 Geometry
The proposed EV battery pack module consists of four prismatic LiFePO₄ cells and two liquid cold plates. The cold plates are placed on the two outer sides of the module to provide direct face cooling. The overall plate dimensions are 140 mm × 72 mm × 4 mm. Inside each plate, a network of longitudinal channels is connected by large circular chambers, and spoiler columns are inserted in the chambers to enhance mixing and increase the heat-transfer area. The baseline plate has a channel height of 2 mm and inlet/outlet ports of width 6 mm. At the initial stage, the cross-sectional area of the circular spoiler column was chosen as 16 mm².
3.2 Governing Equations and Numerical Setup
I assumed that the coolant is incompressible, steady-state, and single-phase liquid water. The aluminium cold-plate walls follow the standard heat-conduction equation, while the fluid domain obeys the conservation equations:
Continuity:
$$ \frac{\partial u}{\partial x} + \frac{\partial v}{\partial y} + \frac{\partial w}{\partial z} = 0. $$
Momentum (x-component):
$$ \rho\left(u\frac{\partial u}{\partial x}+v\frac{\partial u}{\partial y}+w\frac{\partial u}{\partial z}\right) = \mu\left(\frac{\partial^2 u}{\partial x^2}+\frac{\partial^2 u}{\partial y^2}+\frac{\partial^2 u}{\partial z^2}\right)-\frac{\partial P}{\partial x}, $$
with analogous equations for the \(y\)- and \(z\)-components. The energy equation for the coolant is:
$$ \rho_f c_{p,f}\left(u\frac{\partial T}{\partial x}+v\frac{\partial T}{\partial y}+w\frac{\partial T}{\partial z}\right) = k_f\left(\frac{\partial^2 T}{\partial x^2}+\frac{\partial^2 T}{\partial y^2}+\frac{\partial^2 T}{\partial z^2}\right). $$
For the solid aluminium domains, the steady-state conduction equation is
$$ \frac{\partial^2 T}{\partial x^2} + \frac{\partial^2 T}{\partial y^2} + \frac{\partial^2 T}{\partial z^2} = 0. $$
The thermo-physical properties used in the numerical analyses are listed in Table 3.
| Material/Property | Specific heat (J kg⁻¹ K⁻¹) | Thermal conductivity (W m⁻¹ K⁻¹) | Density (kg m⁻³) | Dynamic viscosity (Pa s) |
|---|---|---|---|---|
| Aluminium | 871 | 202.4 | 2719 | – |
| Liquid water | 4182 | 0.6 | 998.2 | 0.001003 |
The hydraulic diameter of the rectangular channel is expressed as
$$ D_h = \frac{2ab}{a+b}, $$
where \(a\) and \(b\) are the cross-sectional channel dimensions. The Reynolds number was computed as
$$ Re = \frac{\rho_f v D_h}{\mu}, $$
with \(v\) the mean flow velocity. In all simulations, I kept the inlet mass-flow rate such that the maximum Reynolds number was lower than 400, so the flow remained laminar. The pressure drop and heat-transfer performance were quantified using the Fanning-friction coefficient and the Nusselt number:
$$ f = \frac{\Delta P}{L/D_h \left(\rho_f v_{in}^2 / 2\right)}, \quad Nu = \frac{h D_h}{k_f}, $$
$$ h = \frac{q_A}{T_{ave} – (T_{in} + T_{out})/2}, $$
where \(q_A\) is the applied heat flux on the heated surface, \(T_{ave}\) is the average cold-plate surface temperature, and \(T_{in}\), \(T_{out}\) are the coolant temperatures at the inlet and outlet.
For the boundary conditions, the ambient and inlet temperatures were set to 25°C. The heated surfaces where the cold plates contact the battery cells were prescribed with a constant surface heat flux equal to the battery surface heat flux at the desired C-rate. All other external walls exchanged heat with the surroundings through a natural-convection coefficient of 5 W m⁻² K⁻¹. The inlet boundary used a mass-flow inlet and the outlet used a pressure-outlet condition. I employed SIMPLE pressure–velocity coupling and second-order upwind schemes in ANSYS Fluent. In the initial liquid-cooled battery module, the total mass flow per plate was set to 0.8 g s⁻¹.
3.3 Grid Independence and Experimental Validation
To ensure accurate and economical simulations, I examined six mesh sizes from 250,000 to 1,500,000 cells. Increasing the mesh count beyond one million cells changed the average temperature by only 0.04% and the pressure drop by less than 0.2 Pa. Therefore, a mesh with approximately one million elements was adopted for the cold-plate parametric study and about three million elements for the complete battery module with heat pipes.
For experimental validation, I fabricated an aluminium test piece corresponding to the baseline liquid cold plate. The plate was machined using a CNC engraving machine and consisted of a base plate and a cover plate held together by bolts. The internal channel depth was 2 mm. The experimental loop used a constant-temperature water bath, a peristaltic pump, a rotameter, a DC power supply, five PT100 resistance-temperature detectors, and a data-acquisition unit. To simulate the battery heat source, I embedded heating rods in an aluminium block that was pressed against the cold plate, supplying a total heating power of 31 W, which corresponds to a 5C discharge of a 15 Ah cell. I conducted four experiments by setting the coolant mass-flow rate to 0.6, 1.0, 1.4, and 1.8 g s⁻¹. After allowing the test cell to reach steady-state for 720 s, the average temperatures measured at the five PT100 points were compared with the CFD predictions. The relative errors were 4.76%, 3.05%, 1.65%, and 4.88% for the four flow rates, respectively. Because all deviations were below 5%, the numerical model was judged reliable for subsequent optimisation studies.
4. Effects of Spoiler-Fin Geometry on Flow and Thermal Performance
The initial circular spoiler columns were intended to break the thermal boundary layer in the liquid channel. To systematically evaluate the shape effect, I compared the following six cross-sectional shapes while keeping the cross-sectional area constant at 16 mm²: circular, rectangular, rhombic, triangular, shuttle-shaped, and teardrop-shaped fins. A conventional straight channel without fins was used as a reference. For comparison, the Reynolds number was varied from 149.55 to 398.8.
4.1 Flow-Field Characteristics
Numerical visualisation of the velocity contours and streamlines showed that all finned configurations produce alternating acceleration and deceleration zones. When the coolant passes around a fin, the flow area changes abruptly, generating recirculation regions in the wake. Among the six shapes, the triangular fin created the widest wake zone and even produced a small local vortex immediately downstream of the fin tip. Such vortices promote mixing between cold and warm fluid and thus enhance convective heat transfer. The shuttle-shaped fin, on the other hand, produced the smallest wake and the least flow disturbance, resulting in a gentler velocity gradient. Teardrop-shaped fins also exhibited relatively small wakes but maintained a continuous smooth acceleration on the upstream side, which balances heat-transfer enhancement against pressure loss.
4.2 Pressure Drop and Heat Transfer
For all geometries, the pressure drop increased linearly as the Reynolds number increased. At a fixed Reynolds number, the triangular fin caused the highest pressure drop, while the shuttle-shaped fin gave the lowest pressure drop. At \(Re = 149.55\), the difference between the triangular and shuttle fins was 0.77 Pa; at \(Re = 398.8\), this difference increased to 4.36 Pa. The heat-transfer coefficient, in contrast, was largest for the triangular fin and smallest for the shuttle fin. Thus, there exists a clear trade-off between thermal performance and hydraulic loss.
I therefore used the comprehensive performance factor \(HTPF\) to identify the best geometry for an EV battery pack:
$$ HTPF = \frac{Nu/Nu_0}{\Delta P/\Delta P_0}, $$
where the subscript 0 refers to the conventional straight-channel design. Table 4 lists the relative Nusselt number, relative pressure drop, and HTPF evaluated at \(Re = 199.4\).
| Fin shape | \(Nu/Nu_0\) | \(\Delta P/\Delta P_0\) | \(HTPF\) |
|---|---|---|---|
| Straight (reference) | 1.000 | 1.000 | 1.000 |
| Circular | 1.212 | 0.843 | 1.437 |
| Rectangular | 1.278 | 0.892 | 1.433 |
| Rhombic | 1.168 | 0.821 | 1.423 |
| Triangular | 1.310 | 1.025 | 1.278 |
| Shuttle | 1.127 | 0.761 | 1.481 |
| Teardrop | 1.258 | 0.924 | 1.361 |
Although the triangular fin provides the highest heat-transfer enhancement, its HTPF is the lowest among the finned cases because of a large increase in pressure loss. The shuttle fin has the largest HTPF value of 1.481, meaning an improvement of 48.1% over the straight-channelled plate. However, when considering a more balanced combination of heat transfer and pressure-drop penalties in the final module design, the teardrop geometry was selected because it offers not only a high HTPF, but also a robust wake structure that avoids severe local hot spots. In fact, the teardrop fin improves the overall performance by 36.1% compared with the traditional straight channel. In this thesis I use the teardrop fin for the remaining geometric modifications.
5. Channel Architecture and Boundary Improvements
5.1 Number of Circular Chambers
With the teardrop-finned geometry fixed, I next varied the number of circular chambers in each straight channel from 5 to 9. The chamber radius and fin size were kept unchanged. The simulation results indicated that increasing the chamber number from 5 to 9 enhances the heat-transfer coefficient by 14.61% while reducing the pressure drop by 6.25%. This improvement is explained by the additional heat-transfer area provided by the chambers and by the more uniform development of the boundary layer. The best comprehensive performance appeared at \(m = 9\), where \(HTPF = 1.60\), corresponding to a 17.4% improvement over \(m = 5\). Therefore, I fixed the chamber count to nine for all later simulations.
5.2 Inlet/Outlet Arrangements
A one-inlet/one-outlet manifold around the middle channel often causes an uneven coolant distribution: the central small channels receive more flow than the side channels. To mitigate this, I compared five inlet/outlet configurations: the original one-inlet/one-outlet at the bottom centre; a Z-type one-inlet/one-outlet; a one-inlet/two-outlet; a two-inlet/one-outlet; and a two-inlet/two-outlet. The thermal–hydraulic results are summarised below for a total mass flow equivalent to 0.8 g s⁻¹.
| Configuration | Heat-transfer coefficient (W m⁻² K⁻¹) | Pressure drop (Pa) | HTPF |
|---|---|---|---|
| Original (1-in 1-out) | 1437.3 | 15.99 | 1.000 |
| Z type (1-in 1-out) | 1501.9 | 22.53 | 0.742 |
| 1-in 2-out | 1490.2 | 13.42 | 1.236 |
| 2-in 1-out | 1478.4 | 14.27 | 1.153 |
| 2-in 2-out | 1495.0 | 12.28 | 1.348 |
The two-inlet/two-outlet arrangement provides the most uniform distribution among the five parallel sub-channels and simultaneously reduces the pressure loss by 23.2% compared to the original configuration. Its HTPF improvement reaches 34.77%. Consequently, I chose the two-inlet/two-outlet scheme as the default architecture for the subsequent single-factor analyses and multi-objective optimisations.
6. Single-Factor Analyses of Principal Geometric Parameters
To provide quantitative guidance for the optimiser, I first performed a univariate study on four design parameters: the head radius of the teardrop fin \(R\), the channel width \(W\), the inlet-port distance \(D_1\), and the outlet-port distance \(D_2\). The ranges are listed in Table 6.
| Parameter | Lower bound (mm) | Upper bound (mm) |
|---|---|---|
| R | 1.0 | 2.5 |
| W | 2.0 | 6.0 |
| D₁ | 6 | 48 |
| D₂ | 6 | 48 |
Because the cold plate has two mirrored inlet ports at one side and two outlet ports at the other side, \(D_1\) and \(D_2\) are measured from the centre plane to the centres of two ports on the same header. The average plate temperature \(T_{ave}\) and pressure drop \(\Delta P\) were selected as the performance indicators.
The single-factor results can be summarised as follows:
- As \(R\) increased from 1 to 2.5 mm, \(T_{ave}\) decreased slightly from 36.14°C to 35.84°C, while \(\Delta P\) rose sharply from 10.68 Pa to 15.21 Pa (an increase of 42.4%). Thus, changing \(R\) is efficient for modifying the hydraulic resistance but gives only a minor cooling benefit.
- As \(W\) increased from 2 to 6 mm, \(T_{ave}\) increased by about 0.3°C, reflecting a larger hydraulic diameter and lower heat-transfer coefficient, whereas \(\Delta P\) decreased because of reduced flow friction. The trends become flattened for large \(W\).
- Increasing \(D_1\) and \(D_2\) from 6 to 48 mm slightly raised \(T_{ave}\). Both \(D_1\) and \(D_2\) produced a minimum pressure drop near a value of 24 mm, which corresponds to placing each port halfway between the centre and the outer wall. For larger distances, the additional travel length causes the friction loss to rise again, suggesting the existence of an optimal intermediate position.
These findings clearly expose the conflicting nature of the heat-transfer and hydraulic objectives. For an EV battery pack, the cooling objective demands a small \(T_{ave}\) while the parasitic-pump objective demands a small \(\Delta P\). A multi-objective optimisation methodology is therefore required to obtain the best trade-off.
7. Multi-Objective Optimisation of the Liquid-Cold-Plate Structure
7.1 Optimisation Framework
I adopted a surrogate-assisted optimisation workflow. First, the decision variables were \(x_1 = R\), \(x_2 = W\), \(x_3 = D_1\), and \(x_4 = D_2\). The two objective functions were the average cold-plate temperature \(f_1(x) = T_{ave}\) and the pressure drop \(f_2(x) = \Delta P\). The formal constrained problem can be written as:
$$ \min_{x} \left[ f_1(x),\; f_2(x) \right]^T, $$
$$ s.t. \quad 1 \le x_1 \le 2.5,\quad 2 \le x_2 \le 6,\quad 6 \le x_3 \le 48,\quad 6 \le x_4 \le 48. $$
To construct the surrogate models, I used the Optimal Latin Hypercube Design (OLHD) to generate 41 sample points in the four-dimensional parameter space. For each sample, the steady-state CFD simulation was performed to obtain the average temperature and pressure drop. Then I fitted fourth-order polynomial response-surface models for both objectives. The quality of the fits was assessed by the coefficient of determination \(R^2\). The resulting response surfaces had values of \(R^2 = 0.979\) for \(T_{ave}\) and \(R^2 = 0.996\) for \(\Delta P\), both exceeding the practical threshold of 0.9. Therefore, the surrogate models accurately represented the underlying CFD data.
The explicit polynomial fitted for \(T_{ave}\) was approximately:
$$ \begin{aligned} f_1(x) &= 34.098 + 6.434x_1 + 0.359x_2 – 0.012x_3 – 0.013x_4 \\
&- 6.326x_1x_2 + 0.143x_1x_3 + 0.0008x_2x_3 – \cdots \end{aligned} $$
and for \(\Delta P\) was approximately:
$$ \begin{aligned} f_2(x) &= 82.803 + 17.927x_1 – 63.076x_2 + 0.006x_3 – 0.002x_4 \\
&- 12.696x_1x_2 + 6.0x_1x_3 – 19.233x_1x_4 – \cdots \end{aligned} $$
The full fourth-order expressions, although lengthy, were used inside the optimisation algorithm.
7.2 NSGA-II implementation and Pareto Front
The non-dominated sorting genetic algorithm NSGA-II was chosen to solve the bi-objective problem. The algorithm parameters were a population size of 20, a generation limit of 12, and a crossover probability of 0.9. After 241 iterations, a Pareto front was obtained that clearly illustrates the conflict between \(T_{ave}\) and \(\Delta P\). Along the Pareto front, one cannot reduce the average temperature without increasing the pressure drop. I selected the design that maximised the comprehensive performance factor HTPF on the Pareto front. The optimal geometric parameters were found to be:
$$ x^* = (R=1.97\ \mathrm{mm},\; W=5.11\ \mathrm{mm},\; D_1=6.01\ \mathrm{mm},\; D_2=45.42\ \mathrm{mm}). $$
The predicted objective values at this optimum were \(T_{ave}=35.90^\circ\mathrm{C}\) and \(\Delta P=10.67\ \mathrm{Pa}\). I verified the optimum with a direct CFD simulation, which produced \(T_{ave}=35.82^\circ\mathrm{C}\) and \(\Delta P=10.40\ \mathrm{Pa}\). The relative deviations were 0.22% for temperature and 2.56% for pressure drop, confirming that the surrogate-assisted optimisation was both accurate and reliable.
7.3 Comparative Improvement
Table 7 compares the original straight-channel design, the initial finned design, the geometrically improved design before multi-objective optimisation, and the final optimal design.
| Design | Average temperature (°C) | Pressure drop (Pa) |
|---|---|---|
| Straight channel (no fins) | 37.79 | 16.96 |
| Initial circular fin + 5 chambers | 36.54 | 16.49 |
| Teardrop fin + 9 chambers + 2-in/2-out | 35.92 | 11.53 |
| Multi-objective optimum | 35.82 | 10.40 |
Compared with the initial circular-finned design, the optimum reduced \(T_{ave}\) by 0.72°C (about 2%) and reduced \(\Delta P\) by 6.09 Pa (about 36.9%). Compared with the straight-channel reference, the pressure drop decreased by 38.7% while the average temperature dropped by 5.21%. These gains demonstrate the effectiveness of the proposed channel topology and the surrogate-based multi-objective optimisation in a practical EV battery pack liquid-cooling system.
8. Hybrid Liquid-Cold-Plate and Flat-Heat-Pipe Battery Thermal Management
8.1 Configuration of the Coupled System
Even with an optimised cold plate, a pure side-cooling arrangement can still leave the central portion of the battery module warmer than the edges, especially under a high discharge rate. To overcome this issue, I integrated flat heat pipes between the adjacent battery cells. The heat pipes act as high-conductivity heat spreaders that transport heat from the inner cells toward the side-mounted liquid cold plates. In the integrated module, four 15 Ah cells are arranged in a row, with five flat heat pipes interleaved between them and at the outer sides. The thickness of each heat pipe is 3 mm, and the height matches the battery height. The heat pipes are modelled as solid conductors with an equivalent thermal conductivity of 2000 W m⁻¹ K⁻¹, which reproduces the effective performance of a typical sintered flat heat pipe while reducing computational cost.
I investigated three distinct heat-pipe routing shapes, which I denote Model 1, Model 2, and Model 3. Model 1 uses three Z-shaped heat pipes and two L-shaped heat pipes. Model 2 uses three large U-shaped and two small U-shaped pipes. Model 3 uses one Z-shaped, two large L-shaped, and two small L-shaped pipes. All these flat heat pipes are arranged so that their evaporator sections are in direct contact with the battery surfaces and their condenser sections are clamped by the liquid cold plates. The coolant enters at 25°C with a mass flow rate of 0.8 g s⁻¹ per cold plate and the pack discharges at 5C (75 A for this pack).
8.2 Cooling Performance of the Three Models
Figure here is not referenced. After the discharge, the maximum temperature and maximum temperature difference for each model were extracted. A bottom-heated pure liquid-cooling case without heat pipes was also simulated for comparison. The results are listed in Table 8.
| Cooling method | Maximum temperature (°C) | Maximum temperature difference (°C) |
|---|---|---|
| Liquid cooling only | 45.59 | 15.32 |
| Liquid cooling + Model 1 | 41.42 | 5.10 |
| Liquid cooling + Model 2 | 41.74 | 6.03 |
| Liquid cooling + Model 3 | 40.16 | 2.41 |
Model 3 yielded the lowest maximum temperature of 40.16°C and the smallest temperature spread of 2.41°C. Compared with pure liquid cooling on the same EV battery pack, Model 3 reduced the maximum temperature by 5.43°C (11.9%) and the maximum temperature difference by 12.91°C (84.27%). The addition of the heat pipes not only decreases the hot spot temperature but, more importantly, equalises the temperature distribution across the whole pack, which is crucial for cycle life and safety.
8.3 Effect of Coolant Flow Direction
In the above simulations, the coolant flow directions through the two side plates were identical, i.e., both inlets were located at the bottom. Because the coolant warms up along its path, the pack tends to be hotter near the outlets. I therefore tested a reversed layout in which the two cold plates were mirrored so that one coolant flows from bottom to top and the other from top to bottom. At 5C discharge with the Model 3 heat-pipe configuration, reversing the flow direction of one plate reduced the maximum temperature from 40.16°C to 39.61°C (a 1.37% reduction) and the maximum temperature difference from 2.41°C to 1.81°C (a 24.91% reduction). The counter-flow arrangement creates a more symmetric temperature distribution across the module because the hotter side of one plate now coincides with the cooler side of the other plate, thereby compensating temperature gradients between cells. Consequently, I used the reversed-flow arrangement for the subsequent parameter studies.
9. Parametric Analysis of Coolant Conditions
9.1 Coolant Mass-Flow Rate
The coolant mass-flow rate directly affects convective heat transfer and pumping power. For the hybrid Model 3 with reversed flow, I varied the mass-flow rate over 0.4, 0.8, 1.2, 1.6, and 2.0 g s⁻¹ per plate at discharge rates of 3C, 4C, and 5C. The maximum battery temperatures for each case are reported in Table 9.
| C-rate | 0.4 g/s | 0.8 g/s | 1.2 g/s | 1.6 g/s | 2.0 g/s |
|---|---|---|---|---|---|
| 3C | 32.66°C | 31.81°C | 31.35°C | 31.10°C | 30.98°C |
| 4C | 36.21°C | 35.09°C | 34.32°C | 33.87°C | 33.58°C |
| 5C | 41.05°C | 39.61°C | 38.64°C | 37.86°C | 37.41°C |
Larger flow rates always decrease the maximum temperature, but the marginal benefit diminishes as the flow rate increases. The maximum temperature differences in the hybrid module all remained below 5°C under the whole range of tested flows. From a system point of view, choosing the smallest flow that meets the 40°C limit conserves energy. At 5C, for example, a flow rate of about 0.8 g/s already satisfies this requirement; increasing to 2.0 g/s further lowers the temperature, but the extra cooling enhancement is less than 1°C. This indicates that the heat pipes already provide excellent thermal equalisation, and excessive coolant pumping is unnecessary.
9.2 Coolant Inlet Temperature
In many practical EV battery packs, the coolant temperature is governed by the chiller or heat-pump circuit. I thus evaluated five coolant inlet temperatures from 15°C to 35°C while keeping the mass flow at 0.8 g/s. Regardless of the discharge C-rate, the maximum battery temperature increased almost linearly with the coolant inlet temperature. As an example, for a 5C discharge the maximum temperature goes from 36.75°C at a 15°C-coolant inlet to 43.90°C at a 35°C-coolant inlet, corresponding to a slope close to one. On the other hand, the maximum temperature difference is rather insensitive to the coolant temperature; it changes by less than 0.02°C between adjacent settings. Hence, the biggest benefit of choosing a low coolant-inlet temperature is the reduction of the absolute temperature level, not the enhancement of temperature uniformity. A trade-off must be made because lowering the coolant temperature significantly increases the energy consumption of the refrigeration system.
10. Discussion and General Design Recommendations
Combining the experimental, numerical, and optimisation results, I can draw several guidelines for designing the liquid-cooled hybrid BTMS of an EV battery pack. First, the introduction of spoiler fins is an effective strategy to enhance heat transfer without necessarily increasing the pressure loss, provided that the fin shape is streamlined. Teardrop-shaped fins achieve an excellent balance by reducing the wake size while still causing enough flow mixing. Second, the distribution of the coolant across the parallel channels is as important as the total mass flow. A symmetric two-inlet/two-outlet manifold avoids the short-circuit flow that often plagues a single centred port. Third, when multiple geometric parameters are optimised simultaneously, surrogate-assisted multi-objective optimisation can substantially reduce the CFD burden and provide a near-optimal design. In this case, a fourth-order response surface was sufficient to locate the trade-off optimum with high confidence. Finally, flat heat pipes are ideally suited to homogenise the temperature field of any EV battery pack with a flat cooling surface. Heat pipes are passive, have no moving parts, and their high effective conductivity allows the heat to be transferred to the remote liquid cold plate with only a few degrees of temperature drop.
11. Conclusions
In this dissertation, I performed a comprehensive investigation into the thermal design of a coupled liquid-cooling and flat-heat-pipe BTMS for an EV battery pack. The main outcomes can be summarised as follows:
- Using the Bernardi heat-generation model and experimentally fitted temperature-rise behavior, I established the volumetric heat source and surface heat flux for a 15 Ah LiFePO₄ cell at discharge rates up to 5C.
- I manufactured and tested a prototype aluminium liquid cold plate. The CFD predictions matched the experimental surface temperatures with a relative error below 5% for a range of coolant mass-flow rates, proving the numerical model suitable for design optimisation.
- Six spoiler-fin geometries were compared. The teardrop fin was selected because it improved the comprehensive HTPF by 36.1% over the straight-channel baseline while providing acceptable heat-transfer enhancement.
- Increasing the number of chambers from 5 to 9 and switching to a two-inlet/two-outlet manifold further increased the HTPF by 17.4% and 34.77%, respectively.
- Using OLHD sampling, fourth-order response surfaces, and the NSGA-II algorithm, I found the optimal design variables \(R = 1.97\,\)mm, \(W = 5.11\,\)mm, \(D_1 = 6.01\,\)mm, and \(D_2 = 45.42\,\)mm. At this optimum, the average cold-plate temperature is 35.82°C and the pressure drop is 10.40 Pa, which is a 36.9% pressure-drop reduction compared to the initial finned plate.
- Adding flat heat pipes between the cells decreases the maximum temperature by up to 5.43°C and the maximum temperature difference by 12.91°C at 5C discharge. The best heat-pipe configuration was Model 3, which combines Z-shaped and two L-shaped pipes to achieve a maximum pack temperature of 40.16°C.
- Reversing the flow direction in the two side cold plates improved the temperature uniformity further by 24.91%, while an increase in coolant flow rate or a decrease in coolant inlet temperature monotonically lowers the maximum temperature. The maximum temperature difference, however, is barely influenced by the inlet temperature, which indicates that heat pipes are responsible for the thermal homogenisation.
The proposed hybrid architecture, combining a geometrically optimised liquid cold plate with high-conductivity flat heat pipes, represents a practical solution for ensuring the safe and durable operation of an EV battery pack under severe fast-charging or high-discharge scenarios. Further studies are planned to analyse the dynamic behaviour under realistic drive cycles, include the influence of cell-to-cell manufacturing tolerances, and extend the optimisation to the full pack-level structure.