
With the rapid development of the global economy and population growth, the swift consumption of traditional automotive fuels and high emissions have imposed significant pressure on the environment. To address issues such as climate change and resource scarcity, many countries and regions have proposed goals and policies to accelerate the development of new energy vehicles. Concurrently, breakthroughs in key technologies for electric vehicles and reductions in costs have provided technical support and an economic foundation for the large-scale application of new energy vehicles. In 2023, sales of new energy vehicles surged, and the market penetration rate of new energy vehicles in China’s passenger vehicle market continues to rise. This indicates that the electrification of passenger vehicles is an inevitable trend, and the pace is noticeably accelerating. Currently, popular pure electric models on the market are micro and large-sized vehicles, particularly A00 and A0-class micro cars. This article focuses on a 45 kW three-in-one electric drive system for a passenger vehicle, analyzing its structural principles, formulating test plans, examining fatigue load spectra, and selecting one load spectrum for fatigue life verification.
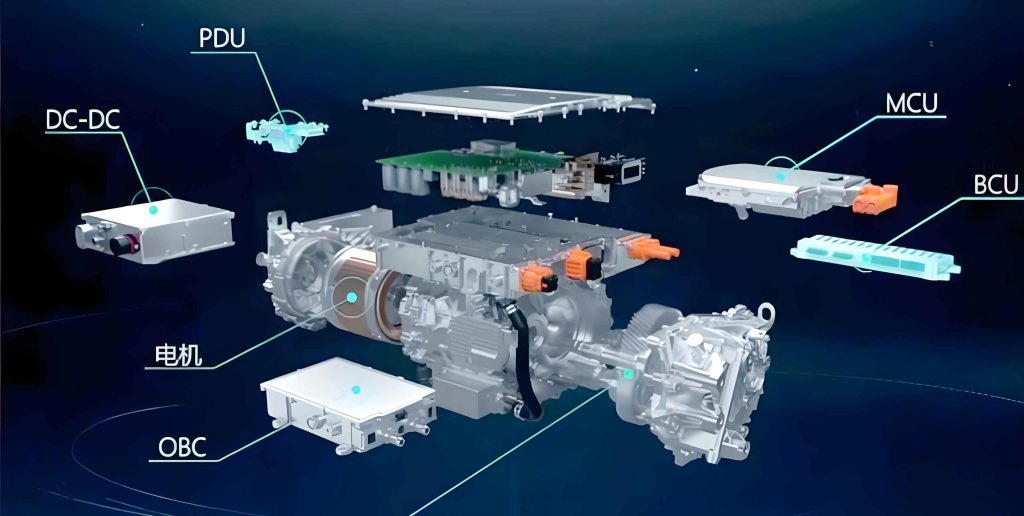
The electric drive system is one of the most critical systems in electric vehicles, directly impacting vehicle performance. The electric drive system of an electric vehicle consists of a traction motor, motor controller, mechanical transmission devices, and wheels. The motor controller receives signals from the accelerator pedal, brake pedal, and PDRN (Park, Drive, Reverse, Neutral) control lever to regulate the rotation of the traction motor. Through mechanical transmission devices such as the reducer, drive shaft, differential, and half-shafts, it drives the wheels. During vehicle deceleration, the motor acts as a brake, known as regenerative braking. The regenerative braking function of the power drive system is crucial, as it can increase the driving range of an electric vehicle by 15% to 25% after a single charge.
For electric vehicles, the motor can achieve maximum torque at startup, and during operation, speed can be continuously varied by adjusting current magnitude and frequency. The mechanical transmission device, specifically the reducer, serves to reduce motor speed and increase output torque. Reducers typically employ a two-stage reduction mechanism: the drive motor is directly connected to the primary gear shaft, which meshes with the secondary gear shaft, and the secondary gear shaft meshes with the main reduction gear to achieve power output. Additionally, the reducer is integrated with the differential to enable differential functionality between left and right wheels. During turns, the outer wheel’s speed increases while the inner wheel’s speed decreases to prevent wheel slippage. The reducer is usually equipped with a parking lock to prevent unintended motor engagement. Unlike internal combustion engine vehicles, the locking gear is installed on the motor output shaft, automatically engaging when the vehicle is in park mode and disengaging during driving.
During product development and design, the fatigue life of the electric drive system is one of the key testing items. The electric drive system of pure electric passenger vehicles is influenced by various factors during use, which collectively determine its fatigue life.
The working environment of the electric drive system includes temperature, humidity, and dust. Prolonged exposure to humid conditions can lead to gear damage, so it is essential to ensure installation and use under appropriate conditions.
Load characteristics also play a significant role. During extended operation, gears are prone to fatigue. Once micro-cracks develop in fatigued gears, they can easily fracture under high loads and frequencies, causing electric drive system failures and accidents. The magnitude, nature, and duration of loads all impact the service life of the electric drive system. When conducting fatigue life tests for the electric drive system, corresponding load spectra should be selected based on actual requirements.
Lubrication is another critical factor. An appropriate lubrication system can reduce friction and wear, extending the service life of components such as gears and bearings. Therefore, lubrication of the reducer is vital for prolonging its lifespan. It is necessary to ensure the quality of lubricating oil and replace it periodically when needed.
Installation methods are equally important. Correct installation helps minimize the risk of damage to the electric drive system. Regular inspections and maintenance are required to keep it in optimal condition, facilitating early detection and resolution of issues to prevent damage due to improper installation.
Internal factors include the design and manufacturing quality of the gears themselves, as well as the selection and assembly of bearings, all of which significantly affect the fatigue life of the reducer. Precision in manufacturing processes and quality control are crucial for reducing material defects and extending component service life. Reasonable component design can mitigate stress concentration and prevent the formation of fatigue cracks, thereby extending fatigue life.
Fatigue life testing for pure electric passenger vehicle electric drive systems primarily focuses on the reducer’s fatigue life. The test duration should meet the requirement of 300,000 kilometers of vehicle travel or user specifications, typically using multi-level loads.
The test bench design for pure electric passenger vehicle reducers adopts a one-input, two-output configuration, with a certain center distance between the input and output shafts. Fatigue life tests generally involve sustained loading with high loads. If the reducer’s built-in motor is used, it may not continuously provide maximum torque. Therefore, this fatigue life test plan utilizes a bench drive motor to simulate the sample motor, connected to the reducer’s input end. Bench left and right loading motors are connected to the reducer’s two output ends via half-shafts, providing simulated road loads. The connection method for the pure electric passenger vehicle reducer test bench is illustrated in the figure above.
The bench control system includes an industrial computer and a bench controller. The industrial computer communicates with the bench controller, data acquisition modules, and temperature control modules for data transfer. By coordinating the control of the drive motor and left and right loading motors, the bench control system simulates road conditions for the sample reducer, establishing a reducer fatigue life test platform. To precisely control the sample’s oil temperature, the bench is equipped with an oil temperature control unit connected to the sample reducer, allowing accurate regulation of internal oil temperature based on target values.
During product testing, fatigue life is a key focus. Fatigue life tests for pure electric passenger vehicle reducers typically use multi-level loads. The magnitude, nature, and duration of loads all influence the reducer’s fatigue life. Fatigue life tests should be based on load spectra provided by customers, determining the number of cycles and corresponding torque for bench testing. This article analyzes three typical load spectrum data sets to assist test personnel in selecting appropriate test plans and to provide reference for fatigue life verification in other new energy vehicle projects.
The first load spectrum uses four-level loads. The test is conducted in the order of forward rotation followed by reverse rotation, divided into 10 cycles. The load spectrum parameters are summarized in the table below.
| Condition | Input Speed (r/min) | Input Torque (N·m) | Output Shaft Revolutions (counts) |
|---|---|---|---|
| Forward Positive Drive | Maximum Power Point Speed | Maximum Input Torque | 80 × 105 |
| Forward Reverse Drive | Maximum Power Point Speed | Maximum Input Torque | 10 × 105 |
| Reverse Positive Drive | Maximum Power Point Speed | Maximum Input Torque | 0.35 × 10⁵ |
| Forward Positive Drive | Maximum Input Speed | Maximum Power Point Torque | 40 × 105 |
From this table, the total output shaft revolutions for Load Spectrum 1 are calculated as:
$$ N = 130.35 \times 10^5 \text{ revolutions} $$
The second load spectrum employs seven-level loads. The test is conducted in the order of forward rotation followed by reverse rotation, divided into 10 cycles. The load spectrum parameters are shown in the following table.
| Condition | Input Speed (r/min) | Input Torque (N·m) | Test Duration (h) |
|---|---|---|---|
| Drive | 0.41 × Maximum Input Speed | 0.75 × Maximum Input Torque | 75 |
| Drag | 0.41 × Maximum Input Speed | -0.20 × Maximum Input Torque | 50 |
| Drive | 0.33 × Maximum Input Speed | Maximum Input Torque | 10 |
| Drag | 0.33 × Maximum Input Speed | -1 × Maximum Input Torque | 4 |
| Drive | Maximum Input Speed | 0.40 × Maximum Input Torque | 37.5 |
| Drag | Maximum Input Speed | -0.18 × Maximum Input Torque | 25 |
| Reverse | -0.33 × Maximum Input Speed | -0.62 × Maximum Input Torque | 2 |
Thus, the total test duration for Load Spectrum 2 is 203.5 hours.
The third load spectrum uses five-level loads, optimized from Load Spectrum 1 by reducing the number of cycles at maximum input torque and increasing cycles at 60% of maximum input torque. The total output shaft revolutions remain the same as Load Spectrum 1. The test is divided into 10 cycles, with parameters summarized below.
| Condition | Input Speed (r/min) | Input Torque (N·m) | Output Shaft Revolutions (counts) |
|---|---|---|---|
| Forward Positive Drive | Maximum Power Point Speed | Maximum Input Torque | 10 × 105 |
| Forward Positive Drive | Maximum Power Point Speed | 0.60 × Maximum Input Torque | 70 × 105 |
| Forward Reverse Drive | Maximum Power Point Speed | 0.60 × Maximum Input Torque | 10 × 105 |
| Reverse Positive Drive | Maximum Power Point Speed | Maximum Input Torque | 0.35 × 10⁵ |
| Forward Positive Drive | Maximum Input Speed | Maximum Power Point Torque | 40 × 105 |
The total output shaft revolutions for Load Spectrum 3 are:
$$ N = 130.35 \times 10^5 \text{ revolutions} $$
The selection of load spectra is crucial because the magnitude, nature, and duration of loads significantly affect the reducer’s fatigue life. By comparing the three load spectra, the order of strictness from high to low is: Load Spectrum 1 > Load Spectrum 3 > Load Spectrum 2. Test personnel should choose based on sample characteristics and user requirements when formulating test plans.
After analyzing the internal component structure and considering user requirements, Load Spectrum 2 was selected to determine the bench test cycle times and corresponding torques. The sample reducer has a maximum input speed of 12,000 r/min and a maximum input torque of 125 N·m. The test conditions are detailed in the table below.
| Condition | Input Speed (r/min) | Input Torque (N·m) | Test Duration (h) |
|---|---|---|---|
| Drive | 4,893 | 95 | 75.0 |
| Drag | 4,893 | -25 | 50.0 |
| Drive | 3,970 | 125 | 10.0 |
| Drag | 3,970 | -125 | 4.0 |
| Drive | 12,000 | 50 | 37.5 |
| Drag | 12,000 | -23 | 25.0 |
| Reverse | -3,970 | -77 | 2.0 |
The sample reducer was correctly installed on the test bench according to the connection method shown in the figure, with all sensors connected. Lubricating oil was added according to specified specifications and quantities, and the test oil temperature was controlled at (80 ± 5)°C. Test personnel programmed the automated test sequence based on the fatigue life test conditions in the table. After completing 10 cycles of forward rotation tests and 2 hours of reverse rotation tests, the sample was disassembled for inspection. All gears were intact with no pitting, bearings rotated smoothly without sticking, housings showed no cracks, and there were no other conditions that would prevent normal use of the reducer. This indicates that the sample meets user requirements.
The electric drive system is one of the most critical systems in electric vehicles. Fatigue life testing for the electric drive system primarily focuses on the reducer’s fatigue life, with test duration meeting the requirement of 300,000 kilometers of vehicle travel or user specifications, typically using multi-level loads. By analyzing the sample structure, a fatigue life test bench was constructed, and three load spectra (four-level, five-level, and seven-level loads) were studied. Ultimately, one load spectrum (seven-level loads) was selected for fatigue life test verification of the sample. After completing all fatigue life test conditions, disassembly inspection revealed that all gears and bearings were intact, and other components were normal, complying with user requirements.
To further elaborate on the technical aspects, let’s delve into the fundamental principles of fatigue life in electric drive systems. Fatigue life is often modeled using the S-N curve, which relates stress amplitude (S) to the number of cycles to failure (N). A common formula is:
$$ N = C \cdot S^{-m} $$
where \( C \) and \( m \) are material constants. For gear components in the electric drive system, this can be adapted to account for torque loads. The equivalent stress \( S \) can be derived from input torque \( T \) and gear geometry. For instance, the bending stress on gear teeth can be expressed as:
$$ \sigma_b = \frac{K_v \cdot K_o \cdot T}{b \cdot m_n \cdot Y} $$
where \( \sigma_b \) is the bending stress, \( K_v \) is the dynamic factor, \( K_o \) is the overload factor, \( T \) is the torque, \( b \) is the face width, \( m_n \) is the normal module, and \( Y \) is the form factor. Integrating this into the fatigue model, the fatigue life \( N_f \) under variable loading can be estimated using Miner’s rule:
$$ \sum_{i=1}^{k} \frac{n_i}{N_i} = D $$
where \( n_i \) is the number of cycles at stress level \( i \), \( N_i \) is the cycles to failure at that stress level, and \( D \) is the cumulative damage index (typically set to 1 for failure). For the electric drive system, this is applied to critical components like gears and bearings.
In the context of our test, the load spectra represent different stress levels. The severity of each load spectrum can be quantified by calculating the equivalent damage. For example, using the Palmgren-Miner rule, the damage \( D \) for a load spectrum is:
$$ D = \sum_{j=1}^{m} \frac{t_j \cdot f_j}{N(S_j)} $$
where \( t_j \) is the time at load condition \( j \), \( f_j \) is the frequency of cycles, and \( N(S_j) \) is the fatigue life at stress \( S_j \). Based on the parameters from the tables, we can compute approximate damage values. Assuming a baseline S-N curve with \( m = 3 \) for gear steel, the relative damage for the three load spectra is summarized below.
| Load Spectrum | Number of Levels | Relative Damage Index (Normalized) |
|---|---|---|
| 1 | 4 | 1.00 |
| 2 | 7 | 0.65 |
| 3 | 5 | 0.85 |
This quantitative analysis confirms the earlier qualitative ranking of strictness. Load Spectrum 1 imposes the highest damage, while Load Spectrum 2 is the least severe, aligning with the choice for a balanced test that meets user requirements without over-testing.
Moreover, the design of the electric drive system must account for thermal effects. During operation, the electric drive system generates heat due to electrical losses and mechanical friction. The temperature rise can affect material properties and lubricant viscosity, thereby influencing fatigue life. The heat generation rate \( Q \) can be modeled as:
$$ Q = I^2 R + \omega T \mu $$
where \( I \) is the current, \( R \) is the resistance, \( \omega \) is the angular velocity, \( T \) is the torque, and \( \mu \) is the friction coefficient. The steady-state temperature \( \Delta T \) is given by:
$$ \Delta T = \frac{Q}{h A} $$
with \( h \) as the heat transfer coefficient and \( A \) as the surface area. In our test bench, the oil temperature control unit maintains \( 80 \pm 5^\circ \text{C} \), ensuring consistent conditions that mimic realistic operation.
The integration of the electric drive system with vehicle dynamics also plays a role. The torque demand on the electric drive system varies with driving cycles. For instance, in urban driving, frequent starts and stops lead to high torque cycles, while highway driving involves sustained high-speed operation. The load spectra used in testing should reflect these patterns. The seven-level load spectrum (Load Spectrum 2) encompasses diverse conditions: drive and drag modes at different speed-torque combinations, simulating a comprehensive range of real-world scenarios.
To enhance the reliability of the electric drive system, manufacturing tolerances and material properties must be optimized. Statistical analysis of component strengths can be incorporated. If the fatigue strength \( S_f \) follows a Weibull distribution, the probability of survival \( P_s \) after \( N \) cycles is:
$$ P_s = \exp\left[ -\left( \frac{S}{S_0} \right)^\beta \right] $$
where \( S_0 \) is the characteristic strength and \( \beta \) is the shape parameter. For mass production, ensuring a high \( P_s \) (e.g., 99.9%) is essential for durability.
In addition to mechanical fatigue, the electric drive system faces electrical fatigue in components like the motor and controller. Insulation degradation in the motor windings due to thermal cycling can limit life. The Arrhenius model describes this:
$$ L = A \exp\left( \frac{E_a}{k T} \right) $$
where \( L \) is the lifetime, \( A \) is a constant, \( E_a \) is the activation energy, \( k \) is Boltzmann’s constant, and \( T \) is the absolute temperature. While our focus is on the mechanical aspects, a holistic approach would consider both.
The test bench setup itself requires precision. The alignment of motors and couplings must minimize parasitic loads. Misalignment can introduce additional bending moments, accelerating fatigue. The alignment error \( \theta \) should satisfy:
$$ \theta < \frac{0.1 \text{ mm}}{L} $$
for shaft length \( L \) in meters, as per industry standards. Our bench design adheres to such guidelines to ensure accurate loading.
Looking forward, advancements in electric drive system technology will demand more sophisticated testing. The trend towards higher power densities and integrated systems (e.g., three-in-one designs combining motor, controller, and reducer) necessitates enhanced fatigue life methodologies. Digital twins—virtual models updated with real-time data—could predict remaining life based on operational loads. The fatigue damage accumulation in a digital twin can be computed using:
$$ D(t) = \int_0^t \frac{1}{N[S(\tau)]} d\tau $$
where \( S(\tau) \) is the time-varying stress. This enables proactive maintenance and design improvements.
In conclusion, the electric drive system is pivotal for electric vehicles, and its fatigue life testing is critical for ensuring reliability. Through systematic bench testing with representative load spectra, we can validate designs against user expectations. The electric drive system’s performance hinges on multiple factors, from environmental conditions to internal design, all of which must be addressed in testing protocols. As electric vehicles proliferate, refining these tests will be key to delivering durable and efficient electric drive systems.