
1. Introduction and Research Background
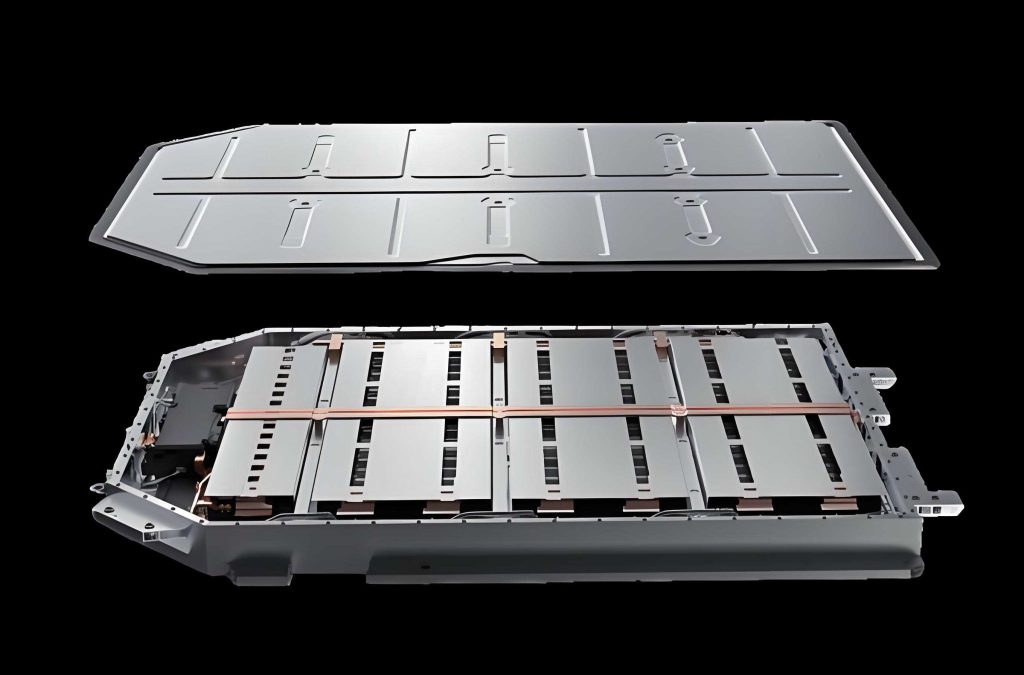
The rapid expansion of the new energy vehicle market has brought the thermal management of traction batteries to the forefront of technological bottlenecks constraining industry development. Lithium-ion batteries are widely favored due to their high energy storage density, low degradation rates, and stable cycling performance. However, they inevitably generate substantial heat during operation. Under high-rate charge and discharge conditions, the core temperature of a traction battery can escalate sharply and compromise its operational performance and safety integrity. The ideal working temperature window for a traction battery pack is generally defined between 298.15 K and 318.15 K, with a permissible maximum temperature difference across the pack of less than 5 K, as depicted in the literature.
Maintaining this narrow temperature band is critical; over-temperature conditions accelerate capacity fade, shorten cycle life, and can trigger catastrophic thermal runaway events that endanger vehicle occupants. Conventional cooling architectures each present inherent limitations in meeting these stringent thermal requirements. Forced air cooling systems suffer from low heat transfer coefficients due to the poor thermal properties of air, making them unsuitable for high-energy-density cells. Liquid cooling systems, while effective, introduce significant complexity, weight, and parasitic power losses through the required pumps, manifolds, and cold plates. Phase change material cooling is limited by the inherent low thermal conductivity of the materials, and heat pipe systems face challenges in module integration and cost.
This thesis addresses these shortcomings by proposing and investigating an advanced thermal management concept for traction batteries: a coupled spray and ventilation cooling system. Unlike traditional evaporative pre-cooling methods that cool only the inlet air, this system injects atomized water droplets directly into the battery airflow channels. Compared with pure forced air cooling, the gas-liquid two-phase flow formed by the atomized droplets and air within the system substantially augments the heat dissipation efficiency by enabling both sensible heat exchange and latent heat absorption via droplet evaporation in close proximity to the cell surfaces.
2. Thermal Characterization of the Traction Battery
2.1 Battery Selection and Physical Parameters
A comprehensive comparison of power sources including lead-acid, nickel-metal hydride, and lithium-ion chemistries underscores the dominance of the lithium-ion system in automotive applications. Li-ion offers four to five times the energy density of lead-acid and double that of nickel-metal hydride batteries. Among the various lithium-ion form factors—cylindrical, pouch, and prismatic—the prismatic type was selected for this investigation due to its high spatial utilization, robust mechanical integrity, and stable performance. The chosen cell was an aluminum-cased square lithium-ion battery with the detailed specifications presented in Table 1.
Table 1: Physical Parameters of the Investigated Prismatic Battery Cell
| Attribute | Unit | Value |
| Dimensions | mm | 20*100*140 |
| Mass | kg | 0.588 |
| Nominal Voltage | V | 3.2 |
| Operating Voltage | V | 2.0~3.65 |
| AC Resistance | mΩ | 0.8~1.2 |
| DC Resistance | mΩ | ≤3.0 |
| Rated Capacity | Ah | 27 |
2.2 Heat Generation Mechanism and Modeling
The heat generated within a lithium-ion traction battery during operation arises from four primary sources: reaction heat \( Q_r \), polarization heat \( Q_p \), Joule heating \( Q_j \), and side reaction heat \( Q_s \). The total heat generation \( Q_{total} \) is expressed as:
$$
Q_{total} = Q_r + Q_j + Q_p + Q_s
$$
Given their stable electrochemical performance and low self-discharge rates, the side reaction heat is typically negligible during normal operating conditions. The most robust method for predicting battery thermal behavior is the application of the Bernardi equation, which models the internal volume heat source \( Q_{gen} \) as a combination of irreversible resistive heating and reversible entropic heating:
$$
Q_{gen} = I(U_{OC} – U) – IT_b \frac{dU_{OC}}{dT_b}
$$
where \( I \) is the current, \( U_{OC} \) and \( U \) are the open-circuit voltage and terminal voltage, and \( T_b \) is battery temperature. This equation can be recast as a linear function of the current \( I \) to estimate the total internally generated heat:
$$
Q_{gen} = I^{2}R_j + IT_b \frac{\partial U_{OC}}{\partial T_b}
$$
2.3 Experimental Determination of Heat Generation Rate
To accurately capture the traction battery’s thermal output under various loads, experimental discharge tests were performed using a experimental bench consisting of a Neware BTS-8000 battery tester, a constant temperature chamber and an Agilent 34972A data acquisition unit. The cell surface temperature was measured using an array of Type-T thermocouples attached to the battery can. Thermal tests were performed at 1C, 2C, and 3C discharge rates within a controlled environment chamber maintained at 300 K.
From the acquired temperature elevation curves (dT/dt), and by fitting the linearized relationship between \( dT/(I \cdot dt) \) and I, the instantaneous heat generation rate can be written as a function of current:
$$
Q_{gen} = 1.06 \times 10^{-3} \cdot I^{2} + 0.085 \cdot I
$$
Normalized for the battery’s volume, the effective volumetric heat source term \( q_{gen} \) becomes:
$$
q_{gen} = 3.42 \cdot I^{2} + 274.19 \cdot I
$$
Based on these equations, the equivalent volumetric heat generation used as the thermal load for the subsequent CFD simulations at each discharge rate is summarized in Table 2.
Table 2: Calculated Volumetric Heat Generation Rates for the Traction Battery
| Discharge Rate (C) | 1 | 2 | 3 |
| Volumetric Heat Generation (W/m³) | 9,893 | 24,777 | 44,626 |
3. Development of the Numerical Spray-Ventilation Coupled Cooling Model
3.1 Physical Model Configuration
The core of this investigation centers on a battery pack assembly, constructed with 24 prismatic cells arranged in series along the airflow path. Within this model, each cell, measuring 140 mm in height, 100 mm in width, and 20 mm in thickness, is subject to cooling by a coupled system of forced ventilation and mist injection. Leading-edge spray nozzles are positioned to inject fine droplets into the discrete ventilation channels between the cells, creating the gas-liquid two-phase flow that is the foundation of the proposed for traction battery thermal management.
3.2 Governing Equations
The numerical simulation utilizes the Eulerian-Lagrangian approach to model this coupled heat and mass transfer system. The airflow is treated as a continuous phase within an Eulerian framework, while the discrete water droplets are treated as a dispersed phase with trajectories tracked in a Lagrangian frame. This allows for a full two-way coupling calculation to resolve the interactions between the two phases.
For the continuous air phase, the steady-state conservation equations are as follows.
Mass Conservation:
$$
\frac{\partial \rho}{\partial t} + \nabla \cdot (\rho \vec{u}) = S_m
$$
Momentum Conservation:
$$
\frac{\partial (\rho \vec{u})}{\partial t} + \nabla \cdot (\rho \vec{u} \vec{u}) = -\nabla p + \nabla \cdot \bar{\tau} + \rho \vec{g} + \vec{F}
$$
Energy Conservation:
$$
\frac{\partial (\rho E)}{\partial t} + \nabla \cdot [\vec{u}(\rho E + p)] = \nabla \cdot \left[ k_{eff} \nabla T – \sum_j h_j \vec{J}_j \right] + \Phi + S_h
$$
Species Transport:
$$
\frac{\partial (\rho_m)}{\partial t} + \nabla \cdot (\rho \vec{u} Y_m) = \nabla \cdot (\rho D \nabla Y_m) + S_i
$$
The additional source terms originating from the interaction between the continuous and discrete phases are rigorously integrated. Mass exchange modifying the continuity equation \( S_m \) is defined as:
$$
S_m = \frac{\Delta m_p}{m_{p,0}} \dot{m}_{p,0}
$$
Similarly, thermal coupling via heat source \( S_h \) is expressed as:
$$
Q = \frac{\dot{m}_{p,o}}{m_{p,o}} \left[ (m_{p,in} – m_{p,out})(-H_{lat}^{ref}) – m_{p,out} \int_{T_{ref}}^{T_{p,out}} C_{p,p} dT + m_{p,in} \int_{T_{ref}}^{T_{p,in}} C_{p,p} dT \right]
$$
The momentum exchange between the droplets and the airflow is given via volumetric force:
$$
F = \sum \left[ \frac{18 \mu C_D Re}{\rho_p d_p^2 24} (u_p – u) + F_{other} \right] \dot{m}_p \Delta t
$$
Turbulence within the channel is resolved using the realizable k-ε model due to its superior performance in simulating planar and round jet diffusion rates, highly relevant to spray injection. The governing equations are:
$$
\frac{\partial (\rho k)}{\partial t} + \frac{\partial (\rho k u_i)}{\partial x_i} = \frac{\partial}{\partial x_j} \left[ \left( \mu + \frac{\mu_t}{\sigma_k} \right) \frac{\partial k}{\partial x_j} \right] + P_k + G_b – \rho \epsilon – Y_M
$$
$$
\frac{\partial (\rho \epsilon)}{\partial t} + \frac{\partial (\rho \epsilon u_i)}{\partial x_i} = \frac{\partial}{\partial x_j} \left[ \left( \mu + \frac{\mu_t}{\sigma_\epsilon} \right) \frac{\partial \epsilon}{\partial x_j} \right] + C_1 S \epsilon – C_2 \rho \frac{\epsilon^2}{k + \sqrt{\nu \epsilon}} + C_3 \frac{\epsilon}{k} G_b
$$
3.3 Discrete Phase Model
For droplet tracking, the governing equation for particle motion in the Lagrangian frame includes contributions from drag, gravity, buoyancy, and additional forces:
$$
\frac{d\vec{u}_p}{dt} = F_D (\vec{u} – \vec{u}_p) + \frac{g(\rho_p – \rho)}{\rho_p} + \vec{F}
$$
where the drag force coefficient \( F_D \) is influenced by the droplet Reynolds number \( Re \):
$$
C_D = \frac{24}{Re} (1 + 0.15 Re^{0.687})
$$
The atomizer was simulated using a pressure-swirl atomizer model incorporating the Rosin-Rammler size distribution. This approach allows for a statistical representation of the droplet cloud and analyzing how the droplet spectrum influences the cooling performance. To account for secondary atomization and the breakup of larger droplets, the Taylor Analogy Breakup (TAB) model was utilized. Evaporation of droplets was handled by implementing a non-equilibrium evaporation model that defines the vapor mass transfer coefficient based on the local concentration gradient between the droplet surface and the main flow.
3.4 Mesh Independence Study and Model Validation
A robust hexahedral-dominant mesh was generated for the battery module. To ensure computational fidelity without excessive cost, a mesh independence study was performed as summarized in Table 3. The variation in maximum temperature between the 2.81 million and 3.45 million (a difference of only 0.15 K) indicates grid convergence was achieved. Therefore, a mesh density of ~2.8 million cells was chosen for all subsequent simulations.
Table 3: Grid Independence Verification Results
| Number of Elements | Resulting Max Temperature (K) |
| 893,896 | 315.51 |
| 1,433,159 | 314.95 |
| 2,815,236 | 314.61 |
| 3,455,368 | 314.46 |
| 4,560,371 | 314.39 |
| 5,744,296 | 314.31 |
To evaluate the numerical model’s accuracy, an experimental validation platform was constructed. An equivalent aluminum block with embedded heating rods simulated the heat generation of a single traction battery cell. In experiments, the ambient temperature was recorded at 298.4 K, and tests were conducted with velocities of 1.0 m/s, 1.5 m/s, and 2.0 m/s, both in dry-air and spray conditions. The spray condition maintained a constant water flow rate of 0.15 g/s. The experiments were conducted for 1200 seconds to mimic a full 3C discharge cycle.
The comparison between the simulated average battery temperature and the experimental measurements at the battery mid-life for the six test cases is presented as a root mean square error (RMSE) analysis. The RMSE metric is calculated as:
$$
RMSE = \sqrt{\frac{1}{n}\sum_{i=1}^n (y_i – \hat{y}_i)^2} = \sqrt{\frac{73.5277}{30}} \approx 1.566
$$
The calculated RMSE of ~1.57 K, with a maximum deviation of 1.9 K, confirms strong agreement between the numerical predictions and the physical experiments. This validates that the coupled spray-ventilation model can effectively capture the thermal and fluid phenomena relevant to the traction battery cooling system.
4. Numerical Results and Discussion
4.1 Baseline Forced Air Cooling Parameters
Before examining the complexities added by the spray, steady-state forced air cooling simulations were run at a discharge rate of 3C and inlet temperature 300 K to establish a baseline. From the results in Figure 4-1 of the original work, the average cell temperature drops from 321.7 K to 307.3 K as the inlet velocity increases from 0.5 m/s to 3.0 m/s. While higher speeds generate more turbulence and convective heat transfer, they also cause a dramatic rise in pressure drop, from 2.4 Pa to 61.9 Pa. Based on this trade-off regarding pump consumption, the range of 1 m/s-2 m/s is deemed the most efficient baseline for subsequent operations.
Inlet air temperature also has a profound impact on the cooling performance because it defines the temperature gradient for convective heat transfer. Inlet temperatures of 290, 295, 300, 305, and 310 K were assessed with wind speed of 1 m/s. A 20.2 K increase in maximum battery temperature was recorded when raising inlet air from 290 K to 310 K. However, the maximum temperature difference within the pack remained surprisingly stable, fluctuating only between 6.3 K and 6.6 K across this range, indicating that the inlet temperature primarily affects the absolute temperature level and not the thermal uniformity.
4.2 Spray Nozzle Parameter Selection
To optimize the spray cooling injection strategy, this study first compared three different types of nozzles available in the Fluent model: `Surface`, `Cone-back`, and `Cone` at a fixed total spray mass flow rate. In each scenario, the heat sink properties of the traction battery were fixed at 3C discharge heat generation, an airspeed of 1 m/s, and an ambient temperature of 300 K.
Table 4 presents a comparison of the cooling effectiveness indicators–the maximum temperature and the maximum difference in the module, where “Air” denotes the pure air-cooled scenario. In general, all spray types reduced the maximum temperature compared to pure air, yet their effect on temperature uniformity was markedly different.
Table 4: Cooling Performance Comparison for Different Nozzle Types
| Configuration | Air | Surface | Cone-back | Cone | Cone (2x) |
| Max Temp (K) | 318.1 | 314.9 | 315.0 | 315.1 | 314.5 |
| Max ΔT (K) | 7.8 | 9.2 | 8.9 | 5.0 | 4.6 |
The results reveal a critical flaw in the broad-area spray designs (`surface` and `cone-back`). Their extensive droplet coverage accumulates mist on the first rows of cells, causing intense localized cooling that amplifies thermal non-uniformity. In contrast, the `Cone` type was the only design that improved both metrics compared to pure air. By confining the spray to the interstitial volume between cells, it ensured a more balanced phase distribution. A further refinement involved changing the configuration from a single nozzle per channel to two vertically symmetric nozzles with a reduced mass flow rate per individual nozzle. This design (“2 Cone”) lowered maximum temperature further (to 314.5 K), but, more importantly, decreasing spacing.
As such, nozzle distance became the primary variable during the optimization phase. For a constant total mass flow rate per gap, the vertical distance between the two opposing nozzles was varied between 30 mm and 130 mm. Through this analysis, an optimal separation of 110 mm was defined, which demonstrably decreased both the maximum temperature and maximum temperature difference in the traction battery module by ensuring an even droplet mist distribution along the cells’ vertical extent. This optimal configuration was employed for all subsequent analyses.
4.3 Effect of Total Spray Mass Flow Rate
Holding the optimal geometric and flow field parameters constant (1 m/s, 110 mm nozzle distance), the impact of increasing the total spray flow rate from 0.1 g/s to 0.5 g/s was evaluated. The data in Table 5 highlights a clear, yet dimishing, returns principle. Introducing a spray flow of just 0.1 g/s reduces maximum temperature by 3.0 K relative to the 318 K observed in pure forced air. When the total volumetric water flow rate is increased from 0.1 g/s to 0.2 g/s, a notable drop of 0.5 K is observed (315.1 to 314.6 K). However, from 0.3 g/s to 0.5 g/s, the temperature falls just 0.1 K annually. This plateau effect can be attributed to the reaching of a saturation limit for the water vapor within the air stream at that specific wind speed. Once the air is near its dew point, additional droplets cannot efficiently evaporate to absorb more latent heat.
Table 5: Summary of Cooling Metrics under Various Operating Parameters
| Case | Parameter Value | Max Temp (K) | Max ΔT (K) |
| Spray Rate | 0.1 g/s | 315.1 | 4.8 |
| Spray Rate | 0.2 g/s | 314.6 | 4.7 |
| Spray Rate | 0.3 g/s | 314.4 | 4.7 |
| Spray Rate | 0.4 g/s | 314.3 | 4.6 |
| Spray Rate | 0.5 g/s | 314.1 | 4.6 |
| Droplet Diameter | 20 μm | 314.6 | 4.7 |
| Droplet Diameter | 40 μm | 315.1 | 5.0 |
| Droplet Diameter | 60 μm | 315.4 | 5.2 |
| Droplet Diameter | 80 μm | 315.6 | 5.4 |
| Droplet Diameter | 100 μm | 315.9 | 5.5 |
4.4 Effect of Droplet Diameter
Maintaining a total flow rate of 0.2 g/s (a compromise between peak performance and water consumption), five different droplet sizes were examined. As shown in Table 5, decreasing the Sauter Mean Diameter of the spray from 100 μm down to 20 μm produced a measurable improvement in heat transfer. The reasons for this are twofold. First, the total surface area of the droplet cloud expands significantly as droplet diameter diminishes, facilitating a much more rapid evaporation rate and subsequent air pre-cooling. Second, the small droplet size allows them to follow the air streamlines and to distribute more evenly across the battery surfaces, keeping wall temperatures more uniform. The 20 μm particles delivered the lowest temperature and smallest thermal gradient.
4.5 Interaction Between Air Velocity and Spray Mass Flow
The performance of the cooling system when both air velocity and spray volume are varied simultaneously is critical in defining an optimal control algorithm for the traction battery thermal management system, since it uses water as an auxiliary resource. The results illustrate a strong antagonistic interaction. At a very low wind speed of 0.5 m/s, increasing the spray rate from 0.1 to 0.2 g/s proved highly impactful in decreasing max battery temperature (~1 K decrease). Yet, when the wind speed was raised to 2 m/s, changing the water flow in this way yielded only a 0.17 K drop.
This is due to the reduced aerodynamic residence time. With high velocity, water droplets are conveyed out through the module before they complete their phase change and deliver the latent heat to the airflow. In this situation, although the mass flow of air confines the droplets’ cooling effect closer to the point of injection, this disadvantage is mitigated by the very high convective coefficient of the rapidly moving air. These insights suggest that, in a real battery system, the cooling strategy should map the use of spray only at lower fan speeds, thus saving water and mist in most transient operation modes.
4.6 Effect of Cell-to-Cell Gap Spacing
Changing the distance between individual traction battery cells modifies the cross-section available for airflow and may change the spray droplet transit and accumulation characteristics. The simulation matrix included 5mm, 10mm, 15mm, and 20mm spacing. Decreasing the gap width directly constricts the inlet channel area which forces the mean air speed through the battery channels to increase and elevates the magnitude of the resulting pressure loss to enforce this flow. Results show an inverse relationship between gap spacing and module thermal performance: a smaller gap is more likely to yield lower max temperatures due to increased turbulence and flow disruption at the cell’s boundary layer.
However, the advantages of smaller gaps come at the price of larger pressure drops (5 mm spacing is associated with 258 Pa at 3 m/s inlet speed, whereas the 20 mm spacing only has 17 Pa). This could harm overall energy efficiency and potentially negate the gains from reducing the maximum cell temperature. Looking at the temperature differential behavior provides a nuance: creating more space (20 mm) helps to reduce the temperature spread. This occurs because open channels allow the droplets to travel further along the flow path, maintaining a more uniform phase distribution. At too small an interval, the droplets coalesce at localized points on the wall (creating hotspots downstream). The study showed that at larger spacings (≥15 mm), increasing the spray volume at low wind speeds potentially worsens the maximum temperature difference due to undesirable droplet settling on the cells. This is a non-linear effect that disappears once the wind is high enough to promote re-entrainment. Given the Pareto optimization, a cell gap of 10 mm emerges as the best compromise among pack size, safe thermal gradients, channel pressure drop, and energy consumption.
4.7 Discharge Rate and the Performance of the Coupled System
The system was evaluated under traction battery discharge loads of 1C, 2C, and 3C, with a fixed spray rate (0.2 g/s) and a range of air speeds. As Table 6 reveals, the maximum temperature of cells with 3C discharge conditions can be maintained at 307 K if they are cooled with 3 m/s in this spray-ventilation coupled system. Since the thermal load is proportional to the square of the current, the benefit of spray cooling becomes increasingly important in higher discharge scenarios. At 1C, the battery max temperature stays impressively low (near 301 K), and the data indicates such operating conditions can be met with reduced cooling effort (lower spray rate, or fan speed) to reduce parasitic draw.
Table 6: Module Thermal Metrics under Variable Heat Load and Air Speeds
| Air Speed | Parameter | 1C | 2C | 3C |
| 0.5 m/s | Max Temp (K) | 303.1 | 310.5 | 320.1 |
| 0.5 m/s | Max ΔT (K) | 2.4 | 5.0 | 8.2 |
| 3.0 m/s | Max Temp (K) | 301.4 | 303.9 | 307.4 |
| 3.0 m/s | Max ΔT (K) | 1.2 | 1.3 | 3.7 |
4.8 Environmental Condition Impact
Since the spray system relies on evaporating mist into the ambient airflow, the ambient air temperature and humidity have a dominant role in driving mass transfer. Therefore, simulations were run to assess the applicability of this thermal management system under various climates.
Influence of ambient temperature: At standard humidity, a sweep of ambient temperature from 290 K up to 310 K was run. Since the inlet air is not artificially pre-cooled, higher ambient temperatures naturally raise the average temperature of a traction battery. Specifically, as ambient temperature increases, the temperature differential between the cell and the air is lower, weakening the passive convective cooling term. In the simulations at 1 m/s and 50% relative humidity, the maximum temperature of the pack increased by 17.2 K (from 306 K to 323.2 K) when the environment went from 290 K to 310 K. The temperature uniformity metric also worsens with increased environmental temperature (from ΔT of 5.5 K to 6 K at 1 m/s). This behavior indicates that hotter climates may need higher fan speed or spray water to offset decreased thermal driving force.
Influence of relative humidity: The effect of humidity is very powerful, because it changes the evaporation capacity of the air as a receiving medium for the water spray. At 300 K, the exit humidity was raised from 20% to 80%. As anticipated, the temperature differential of the cell to the direct contact air is lowered as the driving mass gradient for vapor transfer is reduced. The average outlet vapor mass fraction analysis shows that at 80% relative humidity, the turbine exit humidity was 0.0202 whereas the exit air humidity only reached 0.0092 with 20% inlet humidity; indicating a lower amount of water is being vaporized as humidity climbs. In terms of temperature, for the 1 m/s test condition, cell maximum temperature went from 313.5 K (20% RH) to 315.4 K (80% RH). Among every parameter, the influence was less for the 3 m/s wind due to forced convection dominating over the evaporation latent heat contribution. This insight is valuable to decide the desired operating ranges for this system: Spray cooling is extremely effective in arid conditions, while its advantage decreases in tropical environments.
5. Conclusions
This thesis conducted a comprehensive numerical and experimental inquiry into the heat transfer characteristics of a spray-ventilation coupled cooling system designed for prismatic traction batteries in electric vehicle applications. From the thorough analysis of several parameters, the following key conclusions can be articulated:
1. This work validated that a carefully designed mist injection system operating within the cell gaps of a traction battery pack reduces maximum module temperatures substantially compared to conventional air cooling methods. Distinct from existing literature, this study considered not just inlet air pre-cooling but direct mist injection in the cell space, significantly improving cell surface wetted area and local evaporative cooling.
2. The cooling performance of the system is closely tied to the nozzle geometry. It was determined through simulation that the full-cone type nozzle was the most effective. Spatial placement is also crucial; two vertically arrayed spray nozzles with an optimized spacing of 110 mm were found to strike the best balance between droplet coverage and reducing interference between phases.
3. Maximum temperature decreases proportionally with the increased spray mass flow rate, but there is a limiting saturation point, which is controlled by the air’s capacity to absorb the corresponding water vapor. Given that increasing water consumption is associated with diminishing returns, it is more efficient to design for moderate flow rates, e.g., 0.2 g/s per channel in the tested conditions, rather than merely maxing out water input.
4. However, the velocity of the air has dual and complex effects. It is beneficial for drying, but too high a speed (above 2 m/s) decreases the droplets’ residence duration within the pack, limiting evaporation potential. This implies that the cooling system parameters should be tailored specific ambient thermal load and ambient humidity to avoid the unnecessary use of water and pumping power in a genuine vehicular application.
5. Geometric parameters like the battery gap distance play an integral role. A smaller gap (<10mm) yields efficient heat sink and improves performance but generates undesirable air dynamic losses and can foster local temperature non-uniformities if droplets are allowed to pool on the initial batteries. Larger gaps of 15 mm or 20 mm create more pressure on cooling system design to maintain consistency in cell temperatures, particularly at high C-rates.
6. External weather parameters govern the theoretically achievable performance: The spray is more efficient in climates with low temperature and low humidity conditions. This confirms the proposed technology as a potential alternative for cooling high-rate discharging traction batteries, especially for geographic and seasonal contexts where standard air cooling is usually unable to manage the excess heat load. Future work should focus on active control strategies that modulate airflow and spray volume, taking as input real-time state-of-charge, temperature, and environmental data, to fully realize the energy efficiency advantages of such an advanced thermal system.